Engineers are always looking to improve the efficiency of how they work, but don’t want to sacrifice accuracy in the process. This is true in the world of semiconductor process development, where traditional build-and-test cycles are both time and resource intensive. But what if there was a way to do certain steps in a ‘virtual’ way, at your desktop, through predictive modeling technologies? This can only be done if you are able to accurately predict the structural behavioral sensitivity to process variation observed in the fab.
In this article I will focus on the copper interconnect formation in the BEOL (Back-End-Of-Line). At 16nm and below, Etch and PVD (Physical Vapor Deposition) metallization are left with extremely narrow process windows, and at the same time there is pressure on analytical resources and time-to-market requirements. There is a need for a robust automated process modeling platform which can precisely do variation analysis and accurately predict the design model.
Being fascinated with SEMulator3D tool for process modeling, I looked further into a BEOL Metallization whitepaperbased on this platform, written by Ryan J Patz at Coventor. This is an informative paper about how SEMulator3D enables process interaction characterization (as opposed to individual unit process optimization) and how Virtual Metrology and cross-section capability can give more information per run as compared to trial-and-error silicon testing. Using virtual fabrication to optimize complex process flows for large design areas (e.g. complete SRAM block) before committing silicon can help reduce time-to-market and lower technology development costs significantly.
Patz demonstrated the new capabilities in SEMulator3D 2013 through an experiment of M1-V1-M2 via chain integration. The design features a Trench First Metal Hard-Mask flow with a Self-Aligned Via scheme (TFMHM-SAV) for V1-M2 with double patterning for the M2 level. The paper highlights how SEMulator3D 2013 uses its Virtual Metrology capability to perform standard in-fab measurements and out-of-fab destructive physical characterization. We will see how SEMulator3D Expeditor, a tool for automating a large number of runs, helps in investigating BEOL process sensitivity to lithography and process variation.

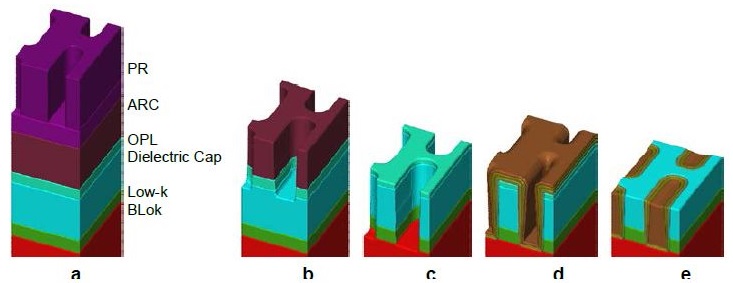
[M1 baseline after a) Lithography, b) Mask open, c) BLok open, d) Copper barrier seed (CuBS), e) CMP]
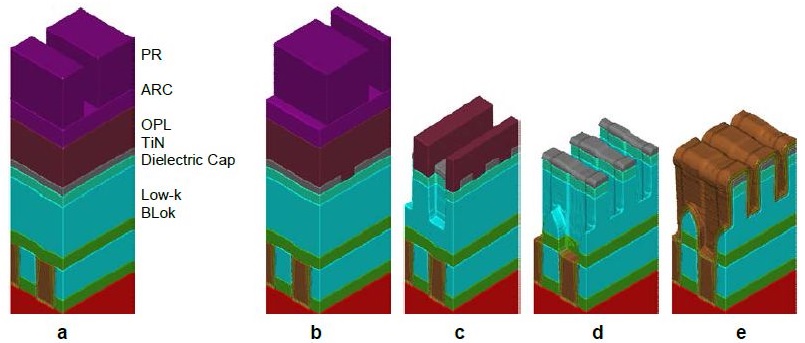
[V1-M2 baseline after a) M2-L1 lithography, b) M2-L2 lithography, c) V1 partial etch, d) BLok open, e) CuBS]
The above figures show the nominal integrated process. The M1-V1-M2 dual damascene baseline flow used Litho-Etch-Litho-Etch (LELE) double patterning for the M2 level and the model was run through V1-M2 metallization and CMP.
The Ta/TaN Liner deposition needs to be conformal and continuous for device yield and reliability. The SEMulator3D platform allows the user to control liner thickness, conformality (thickness/overhang ratio) and overhang angle to study the deposition process. Virtual Metrology was used to measure M2 CD (critical dimension) and Cu cross-section area to quantify the impact of Liner Conformality on the device. An 81-way experiment was completed in about 3 hours on a single 4 core CPU machine. Such a comprehensive in-fab study will likely be prohibited by wafer and SEM (Scanning Electron Microscope) resource requirements.
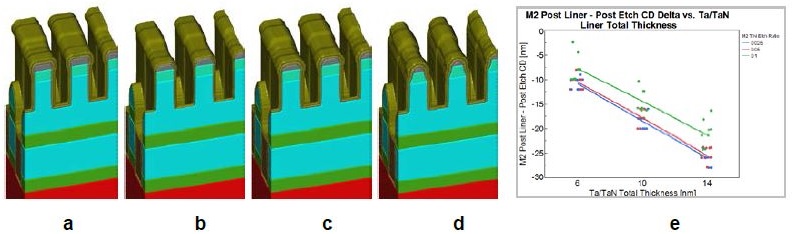
[Ta/TaN liner thickness (nm) and TiN etch ratio profile impact on M2 space CD – a) 5/5, 0.025, b) 3/3, 0.05, c) 5/5, 0.05, d) 5/5, 0.1, e) M2 space CD dependence on liner thickness and TiN etch ratio]
In the above figure, images a, c and d show the impact of the TiN etch ratio (selectivity) on liner profile. Images b and c show bread-loaf formation as the liner thickness increases. This learning could be used in-fab to optimize the post etch TiN profile and thickness for maximum liner deposition process margin.
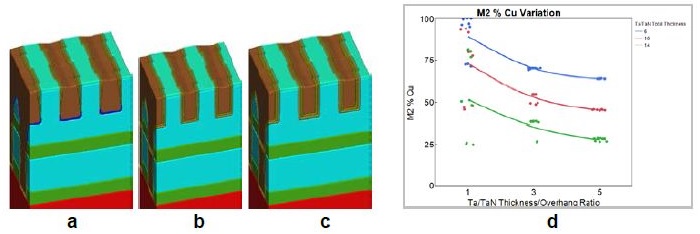
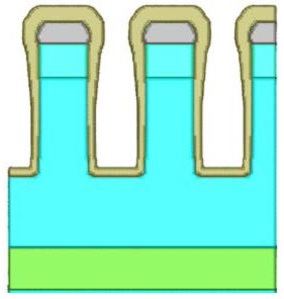
[% of Cu in M2 trench at liner thickness/overhang ratio of a) 1, b) 3 and c) 5; d) % of Cu in M2 trench dependence on liner thickness/overhang ratio and thickness]
The above figure shows that the M2 Cu cross-section area as a percentage of total metal is sensitive to both liner conformality (thickness/overhang ratio) and total thickness. The percentage of Cu in the 32nm trench can be substantially increased with a more conformal liner. In the same figure, the blue marker at the bottom of the M2 trench in image a highlights discontinuous liner coverage and direct contact of Cu and low-k. This interface was detected automatically during the model build.
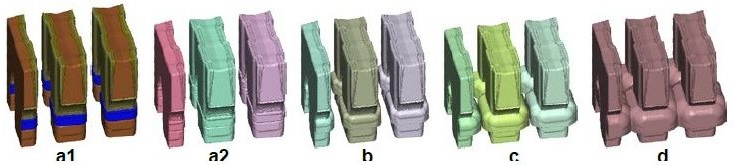
[Dielectric materials are not shown. Cu diffusion during subsequent processing in a1) 0nm with material view, a2) 0nm with electrical new view, b) 5nm, c) 10nm, d) 15nm]
The above figure shows the risk of a Cu diffusion at a Cu/low-k interface during subsequent processing which can result in shorting. In the above figure, each electrical net is represented by a unique color (which can be counted by Virtual Metrology). The image d with largest Cu diffusion shows that the electrical nets are shorted and represented in a single color.
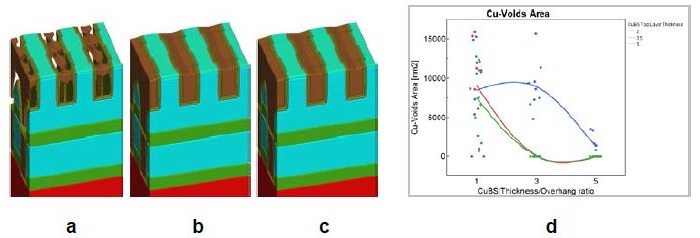
[Cu void formation at CuBS thickness/overhang ratio of a) 1, b) 3 and c) 5; Ta/TaN thickness=5/5nm, thickness/overhang=3, CuBS top layer thickness=3.5nm. d) Cu voiding area over a single V1-M1 contact for 81 runs]
An experiment was run using the Coventor Expeditor tool to characterize the process window for continuous liner and Cu seed layers. Image a in the above figure illustrates void formation due to a discontinuous Cu seed layer. The Cu/Void interface area is not possible to measure in-fab but it is possible to measure with Virtual Metrology and the results are in the above chart. The results suggest overhang during Cu seed can help ensure a continuous seed layer.
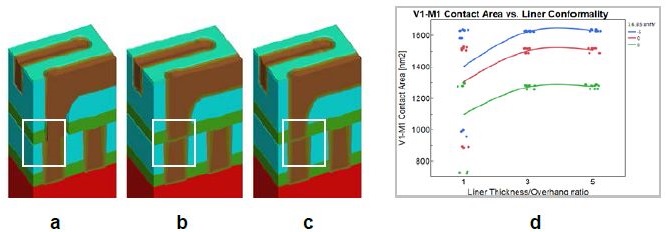
[Liner thickness/Overhang ratio and Via lithography misalignment of a) 1 and -5nm, b) 3 and -5nm and c) 3 and +5nm. V1-M1 interface area as a function of liner thickness/overhang ratio]
Another important study was the sensitivity of Line-end self-aligned Viascontact area to process variation. The above figure shows that liner conformality and via lithography misalignment have a strong impact on the V1-M1 interface area, specifically at a thickness/overhang ratio of 1. Characterization of constructs like this example can help determine design rules and weak points in the device to drive development priorities.
It’s interesting to note how the unit processes interactions impact the final device. This realization is an important step towards understanding how to enable APC (Automated Process Control). For example, if M1 post etch CD is small, it may require a different M2 overlay tolerance or M2 TiN thickness to ensure electrical performance is in spec.
This whitepaperis a must read for process engineers, chip designers and others associated with the semiconductor industry. This paper discusses important metallization process trends with focus on the impact to the final device. The SEMulator3D platform offers a virtual fabrication tool with automation and metrology capability to quickly and thoroughly map a complete process space. Happy read!!


Comments
There are no comments yet.
You must register or log in to view/post comments.