Periodically Mentor does us all a big favor by commissioning a survey of verification engineers across the world to illuminate trends in verification. This is valuable not only to satisfy our intellectual curiosity but also to help convince managers and finance mandarins that our enthusiasm to invest in new methods and tools is supported by broad industry trends.

I always find these surveys fascinating, as much for how they align (or not) with conventional wisdom as for new or evolving insights. So let’s dive in, starting with design sizes. Not including memory, ~31% of projects in 2016 were at 80M gates or more and ~20% were at 500M gates or more. Nearly 75% of all surveyed designs had at least one embedded processor, half had 2 or more processors and 16% had eight or more. They also note that “it is not uncommon” (no percentage provided) to find 150 or more IP blocks in a design.

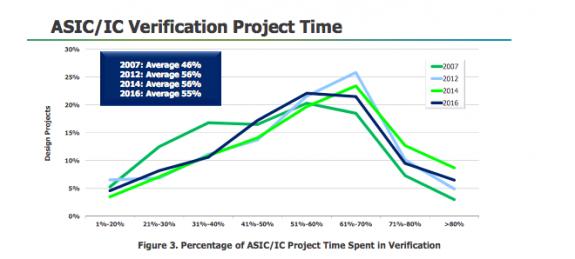
On time spent in verification, the survey shows an average of 55% in 2016, though I see a fairly flat top to the distribution, from 50% to 70%. In 2012 more projects were between 60% and 70%, though the average was barely higher than in 2016. Perhaps growing verification teams contributed to flattening the peak. That would be thanks to the compound annual growth rate (CAGR) in verification heads over this period, at over 10%, versus CAGR in design heads at 3-4%. Also of note is that design engineers are spending half their time in verification, and that this hasn’t changed significantly since 2007.
Where do verification engineers spend their time? Unsurprisingly, nearly 40% in debug, 22% each in creating tests/running simulations and testbench development and 14% in test planning. I doubt much has changed here.
In dynamic verification, well over half of all projects are using code coverage and functional coverage metrics, along with assertions A slightly smaller number, apparently declining from earlier years, are using constrained random techniques, though Mentor note that this is skewed by an increased number of designs at under 100K gates (perhaps around sensor designs). They speculate that these teams may be less mature in digital verification methods. In general, the survey finds adoption of all these techniques leveling off, which they attribute to scaling limits in simulation – these methods are useful at the IP level, perhaps less so at the SoC level.

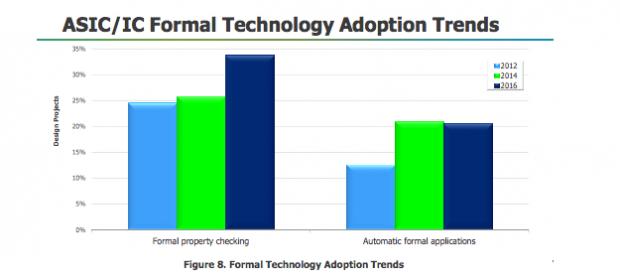
Some interesting results are shown around adoption of formal methods. In 2014, adoption of automatic formal methods (smart lint, connectivity checking, apps in general) was picking up fast and property checking (“classic formal”) grew very little. In 2016, automatic usage leveled off at around 20% of projects while property checking grew significantly to nearly 35% of projects. Mentor attribute this to teams having grown sufficiently comfortable with automatic methods to now branch out into property checking. This certainly suggests fertile territory for tool vendors to continue to grow adoption in both areas.
In hardware-assisted verification, 24% of projects are using emulation and 30% are using FPGA prototyping. For emulation, dominant usage is in hardware/chip verification, software development and HW/SW code-design and verification (I would guess the software here would be bare-metal), also system validation, though there is surprisingly significant (and growing) usage in IP development and validation.
In FPGA prototyping, dominant usage is in hardware/chip verification also with a significant component in IP design and verification. This is surprising for me since FPGA prototypes are not generally very good for hardware debug (thanks to lack of extensive internal visibility). However, they are much cheaper than emulators, so perhaps that’s the reason – trading off cost versus verification effort and cleverness. Less surprisingly, system validation, software design and HW/SW co-verification are leading use-models.
In verification languages and methodologies SystemVerilog still dominates at ~75%, Verilog (for verification) is still around but declining fast and the only other significant player is C/C++ at ~25% presumably for software-based verification. (By the way, the survey allows for multiple answers in many of these questions so don’t expect stats to add to 100%.) In testbench methodology UVM dominates at ~70% and everything else is in rapid decline. Equally SVA is massively preferred for assertions. No big surprises here.

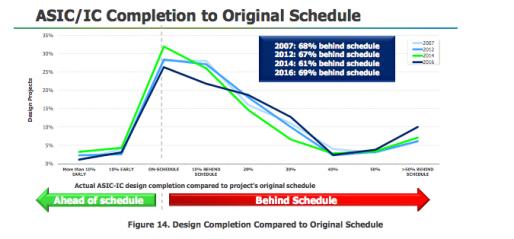
The survey wraps up with an ever-interesting survey (anonymous of course) of design schedules – what goes wrong and why. The peak of the distribution in 2016 is at on-schedule completion (funny how that happens) but there’s a long and fat tail out to a 30% overrun, with an average of 69% of projects behind schedule. This seems to be worse than in previous years (61% behind in 2014 for example), not an encouraging direction.
Only 30% of designs were able to get to success on first silicon, ~40% required at least one and ~20% two respins. I have recently come to think of this as a routine need primarily to handle software and analog problems, but I was wrong. Logic/functional problems remain the leading cause (~50%) and power consumption problems grew rapidly as a contender (~30%). Root causes were led by design errors (70%!) and spec problems (incorrect/incomplete at 50%, change in spec at nearly 40%).
Hats off again to Mentor for sponsoring and summarizing the results of these surveys. This is real value for all of us in the industry. You can access the survey HERE.
Share this post via:


Comments
There are no comments yet.
You must register or log in to view/post comments.