RVN! 26 Banner revised (800 x 100 px) (600 x 100 px)

StarFive Surpasses Development Goal with the Prodigy Rapid Prototyping System from S2C

StarFive Surpasses Development Goal with the Prodigy Rapid Prototyping System from S2C
by rdgreen on 07-13-2021 at 10:00 am

SartFive

Faced with the challenge of developing a high-performance hardware platform with critical software components, what choices do companies have in rapidly moving their development forward with modest budgets and resources?

That was the challenge faced by StarFive Technology, a leading IP and semiconductor SoC platform solution provider. StarFive recently completed its development of the Jinghong 7100; a system that integrates deep learning, image processing, speech recognition, and machine vision. The Jinghong 7100 also holds the honor of being the world’s first multi-functional platform based on RISC-V. “Our R&D team required a prototyping platform to confirm a new design,” recalls Hu Jian, StarFive’s Vice President of R&D. His choice? – the Prodigy Rapid Prototyping System from S2C.

Since the founding of the RISC-V Foundation in 2015, a large number of commercial application companies have been formed around this new architecture. The free and open-source nature of RISC-V provides firms with many advantages: it supports a wide variety of practical use cases, attracts a large base of contributors, and reduces the cost of software by enabling more reuse. And due to its characteristics of modularization and extensibility, RISC-V is easily tailored to different applications such as those brought about by the rise of IoT (Internet of Things). Additionally, no royalty payments are required to use RISC-V, which provides companies with a powerful financial incentive. With all these contributing factors, many people see the gathering momentum behind RISC-V as a trend that will not be easily stopped.

But systems based on RISC-V (or ARM) technology come with a steep burden for verifying their function and performance. To verify these complex systems, developers typically must choose between three approaches: using discrete-event simulation; employing a modular FPGA-based prototype, or using streaming slices to form a complete system for verification. This last method is the most rigorous, but requires a lot of capital investment and has both high complexity and a long cycle time. Discrete event simulation has been widely adopted because it only involves software, but has the disadvantage of being highly subjective and producing controversial results.

In contrast with these two techniques, modular FPGA-based prototypes are ideally suited for verifying designs that rely on extensive software content. This approach enables the software team to begin work early on final system integration. The prototype platform provides the fastest and most efficient way to perform comprehensive hardware/software co-validation, especially during the critical phase of stack reduction and validation before software is incorporated into the final chip.

StarFive used S2C’s Virtex UltraScale (VU) Prodigy Logic System for their verification tasks. “Prodigy proved to be a powerful and easy to use configurable prototyping platform for our Jinghong 7100, explains Hu Jian.

Prodigy Logic Systems are shipped with a low-profile enclosure that includes all components – FPGA module, extendable power control module and power supply for maximum flexibility, durability, and portability. System features include:

  • Modular and All-in-One design offering highest flexibility and performance
  • Abundant prototyping tool support (partition and debug) to speed prototype bring-up
  • Easy reconfiguration/stacking to expand capability for additional projects
  • Comprehensive portfolio of Prototype Ready Accessories for quick prototype build

Together with support from S2C we managed to successfully prototype our SoC starting from the early phases of our project,” said Hu Jian.

So how did the Prodigy System help StarFive? Beginning with a step-by-step approach, it allowed them to begin hardware/software integration before their RTL was complete and gave them early insights into system design and performance. And the Prodigy System was able to accelerate StarFive’s engineering effort, allowing Hu Jian to cut two months off the development schedule.

The power and flexibility built into the Prodigy System helps companies like StarFive succeed with their design and verification efforts. Prodigy can help your company be successful too. For more information: https://w2.s2ceda.com/

Also Read:

CEO Interview: Toshio Nakama of S2C EDA

S2C Raises the Bar for High Capacity, High-Performance FPGA Prototyping

Prototyping with the Latest and Greatest Xilinx FPGAs


Obtaining Early Analog Block Area Estimates

Obtaining Early Analog Block Area Estimates
by Tom Simon on 07-13-2021 at 6:00 am

Animate Preview Area Estimation

I’ve written before about Pulsic’s Animate Preview software, which is extremely helpful in completing placement in analog blocks so that they are ready for routing. Analog design automation has always been a tough proposition, but Animate Preview looks like a promising tool, with practical benefits. Obtaining DRC clean placement that meets many of analog design’s complicated constraints is a huge win. Interestingly the team at Pulsic found another benefit derived from having good placement rapidly available.

Anyone who has done an SOC floorplan knows how hard it is to get good size estimates for analog blocks. Without good estimates for the analog content, figuring out the overall floor plan for an SOC is nearly impossible. Both over- and under-estimates can wreak havoc on an SOC floor plan. Late arrival of accurate analog block area information can disrupt SOC development schedules.

Animate preview, it turns out, is really good at estimating the final size of analog blocks at the start of the design process. I recently had the chance to read a paper on how Pulsic’s Animate Preview can improve analog block area estimation as compared to commonly employed estimation methods. The paper titled “Analog Integrated Circuit Design Area Estimation” surveys 280 commercially developed analog blocks to see how existing estimation methods stack up to Animate Preview.

The circuits used cover a wide variety of foundries and fabrication processes. These ranged from 0.8um to 28nm. There were many different types of commonly used blocks, such as DAC, ADC, bandgaps, amplifiers, comparators, etc. They used hand-crafted layout data that was DRC clean and fully verified as the reference.

The rule of thumb estimates that they applied were off by as much as a factor of 8x. The standard deviation was around a factor of 4.14. Given that the error in area can also be expressed in the x or y direction the reliability of areas estimates derived this way are extremely unreliable. When Pulsic’s Animate Preview was used to estimate block area the results were far closer to those seen in the final hand crafted blocks. The standard deviation of the error factor was 0.57. The paper goes into much more detail on how these conclusions were reached, with a thorough discussion on how to interpret the results.

Yet, the most interesting point for me was that Pulsic is making the area estimation capability of Animate Preview available to the design community for free. This is to say that anyone can download the software and execute a no-fee license agreement to run the software. The free version, of course, has limitations on what users can save off. With the free version users can save the block outline and pin positions.

Animate Preview Analog Block Area Estimation

The “Plus” version, which is paid, can save out schematic driven layout, well shapes, guard rings, poly heads, and device & pCell placement. It comes with full support as well. Yet for free, users can gain a big benefit and perhaps see the value of the “Plus” version. So called Freemium software has not been seen a lot in EDA. Here we have an innovative tool that can be brought into almost any design flow where predicting analog block sizes is important. For more information on using Animate Preview for analog block size estimation look at the Pulsic website.

Also Read:

WEBINAR: Pulsic’s Animate Makes Automated Analog Layout a Reality

CEO Interview: Mark Williams of Pulsic

Webinar: Boosting Analog IC Layout Productivity


Automotive Safety Island: Test, Safety, Security, ISO 26262

Automotive Safety Island: Test, Safety, Security, ISO 26262
by Daniel Payne on 07-12-2021 at 10:00 am

functional safety

I first fell in love with electric vehicles back in 1978 as an Electrical Engineering student, studying at the University of Minnesota. What caught my fancy was a small advertisement listed in the back of Popular Mechanics magazine to build your own electric vehicle by replacing the gas engine of a Honda with an electric motor, so I bought the plans and showed them to my dad’s machinist friend. He quickly informed me that the cost to machine the parts for this one of a kind EV would cost more than a new car, so I waited decades for the auto industry to start designing affordable EVs.

Modern automobiles are oft described as “data centers on wheels”, and I believe it’s true, because the typical 2021 Ford auto can have 25-35 ECUs (Electronic Control Unit), while a luxury BMW 7 series contains 60-65 ECUs. With the growth of Advanced Driver-Assist Systems (ADAS) also comes the need to design for functional safety by following ISO 26262, plus defending against cyber security hacking is another design requirement. This is a true systems-level challenge, so no surprise that systems companies like Siemens are talking about this topic in a recent White Paper, Automotive Safety Island. Their approach to meet these challenges is a “safety island”, where a scalable system using an embedded CPU and software control is used.

The audio and entertainment system inside of a car can have an Automotive Safety Integrity Level (ASIL) that is low, like level A, while self-steering would fall under the highest integrity, so level D. IP subsystems get designed for the automotive market with one of these four ASIL levels in mind.

Safety Island

The promise of a safety island is to manage and control the safety content inside an SoC by:

  • Signaling failures
  • Enabling recovery
  • Adapting to future needs

Preventing any harm from the failure of a safety-critical system is what functional safety is all about. Adding logic inside a chip to detect random hardware faults that are either latent or transient is part of diagnostics coverage, while meeting the desired level of ASIL. These added functional safety blocks are shown in grey for an automotive SoC:

Functional Safety Blocks (Grey)

The safety mechanisms used for an IP within an SoC depend on the type of IP, and engineers trade off coverage, test time, silicon area and the amount of disruption to normal operation:

Safety Mechanisms

Connecting all of these safety mechanisms together can be done readily with the Tessent MissionMode architecture, where SiB is Segment insertion Bit, and FSM stands for Finite State Machine.

Tessent MissionMode architecture

With the addition of a Safety CPU, the MissionMode controller becomes a safety island:

Safety Island architecture

When adding this safety island, it is separated from the rest of the design: logically, physically, power.

Memory BIST

Memory Built In Self-Test (BIST) can test any memory instance, so the question is when to run these tests. With non-destructive Memory BIST, the BIST engine only does bursts of testing, while the SoC is functionally operating. The safety CPU is the brains that decides when to do these bursts, based on system activity.

Beyond Just Test

BIST is managed through the IJTAG interface, and it tests for structural defects in the silicon. Another type of IP that can be added is called Embedded Analytics, and that has monitoring and data collection for an entire SoC for a higher level of safety checking, even aware of cyber security activity. Here’s the idea of Embedded Analytics for an automotive SoC, where the safety island is connected to the message infrastructure:

Embedded Analytics

Along with the Embedded Analytics there is an Embedded SDK, a software library that runs on an embedded safety manager inside your SoC, and it configures and controls the Embedded Analytics monitors (shown above in grey boxes).

Embedded SDK

Summary

Automobiles have become incredibly complex systems, which present many challenges to design teams about test, safety and security. By designing new automotive SoCs to meet these challenges, and using the approach of on-chip monitors and analytics with a safety island, it’s possible to meet your ASIL levels in a software-driven flow.

Read the complete 9-page White Paper here from Siemens.

Related Blogs


TSMC Design Considerations for Gate-All-Around (GAA) Technology

TSMC Design Considerations for Gate-All-Around (GAA) Technology
by Tom Dillinger on 07-12-2021 at 6:00 am

mobility differences 3

The annual VLSI Symposium provides unique insights into R&D innovations in both circuits and technology.  Indeed, the papers presented are divided into two main tracks – Circuits and Technology.  In addition, the symposium offers workshops, forums, and short courses, providing a breadth of additional information.

At this year’s symposium, a compelling short course was:  “Advanced Process and Device Technology Toward 2nm-CMOS and Emerging Memory”.  A previous SemiWiki article from Scotten Jones gave an excellent summary of the highlights of (part of) this extensive short course. (link)

Due to space limitations, Scotten wasn’t able to delve too deeply into the upcoming introduction of Gate-All-Around (GAA) technology.  This article provides a bit more info, focusing on material presented in the short course by Jin Cai from TSMC’s R&D group, entitled:  “CMOS Device Technology for the Next Decade”.

FinFET to GAA Transition

Successive generations of FinFET process technology development have resulted in tighter fin pitch and taller fins, with increasingly vertical fin sidewall profile.  Significant improvements in drive current per unit area have been realized.  The electrostatic control of the gate input over the three surfaces of the vertical fin has also improved subthreshold leakage currents.

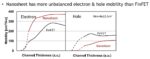
Yet, Jin highlighted that, “Free carrier mobility in the vertical fin is adversely impacted for very small fin thickness.  TSMC has introduced SiGe (for pFETs) at the N5 node, to improve mobility.  Strain engineering continues to be a crucial aspect of FinFET fabrication, as well.”  (nFET:  tensile strain; pFET:  compressive strain)

The figure below illustrates the trends in short-channel effect and carrier mobility versus fin width.

Jin continued, “An optimal process target is ~40-50nm fin height, ~6nm fin thickness, and ~15nm gate length, or 2.5X the fin thickness.”

The next step in device scaling is the horizontal gate-all-around, or “nanosheet” (NS) configuration.  A superlattice of alternating Si and SiGe layers are fabricated on the wafer substrate.  A unique set of etch/dep steps are used to remove the SiGe material at the NS layer edges and deposit a spacer oxide in the recessed area, leaving the Si layer sidewalls exposed.   Source/drain epitaxy is then grown out from the Si sidewalls, providing both the S/D doping and structural support for the Si nanosheets.  The SiGe layers in the nanosheet stack are then selectively removed, exposing the Si channels.  Subsequent atomic layer deposition (ALD) steps introduce the gate oxide stack, potentially with multiple workfunctions for device Vt offerings.  Another ALD step provides the gate material, fully encapsulating the nanosheet stack.

Jin focused on the carrier mobility characteristics of the nanosheet-based GAA device, as representative of performance.  (More on GAA parasitic capacitance and resistance shortly.)  The figure below provides an illustration of the crystalline orientation for GAA devices, to optimize the lateral mobility in the horizontal nanosheet layer channels.

Jin highlighted a key issue facing the development of NS process technology – the (unoptimized) hole mobility is significantly less than the nFET electron mobility, as illustrated below.

Digression:  Carrier Mobility and Circuit Beta Ratio

When CMOS technology was first introduced, there was a considerable disparity in nFET electron and pFET hole mobility in strong inversion.  A general circuit design target is to provide “balanced” RDLY and FDLY delay (and signal transition) values, especially critical for any circuit in a clock distribution network.  As a result, logic circuits adopted device sizing guidelines, where Wp/Wn was inversely proportional to the carrier mobility ratio – i.e., Wp/Wn ~ mu_electron/mu_hole.  For example, a device sizing “beta ratio” of ~2.5 was commonly used.

(Wp and Wn are “effective” design values – for logic circuit branches with multiple series devices, to maintain the same effective drive strength, wider devices are required.)

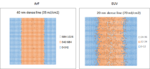
With process technology scaling employing thinner channels below the oxide surface, and with extensive channel strain engineering, the ratio between electron and hole mobility was reduced, approaching unity.  Indeed, as illustrated below, the introduction of FinFET devices with quantized width values depended upon the reduction in carrier mobility difference.  (Imagine trying to design logic circuits with a non-integral beta ratio in the 2+2 fin standard cell image shown below.)

Nanosheet Circuit Design

The figure above depicts a standard cell library image, for both current FinFET and upcoming nanosheet technologies.  Unlike the quantized width of each fin (Wfin ~ 2*Hfin + Tfin), the nanosheet device width is a continuous design parameter, and (fortuitously) can more readily accommodate a unique beta ratio.

Note that there will be limits on the maximum nanosheet device width.  The process steps for selectively removing the interleaved SiGe superlattice layers and the deposition of the oxide and gate materials need to result in highly uniform surfaces and dimensions, which will be more difficult for wider nanosheet stacks.

Speaking of nanosheet stacks, it should also be noted that the layout device width is multiplied by the number of nanosheet layers.  Jin presented the results of an insightful analysis evaluating a potential range of layers, as shown below.

A larger number of layers increases the drive current, but the (distributed) contact resistance through the S/D regions to the lower layers mitigates this gain.  The majority of the published research on nanosheet technology has focused on ~3-4 layers, for optimal efficiency.

Parenthetically, there has also been published research investigating nanosheet fabrication process techniques that would locally remove one (or more) nanosheet layers for a specific set of devices, before ALD of the surrounding oxide and gate.  In other words, some devices could incorporate less than 3 layers.  Consider the circuit applications where a weak device strength is optimum, such as a leakage node “keeper” or a pullup device in a 6-transistor SRAM bitcell.  Yet, the resulting uneven surface topography adds to the process complexity – the upcoming introduction of GAA technology may not offer a variable number of nanosheet layers.  The same surface topography issue would apply toward a GAA process that would attempt to build nFETs from superlattice Si layers and pFETs from superlattice SiGe layers, assuming the ability to selectively etch Si from SiGe for pFETs.

The net for designers is that GAA technology will offer (some) variability in device sizing, compared to the quantized nature of FinFETs.  Leakage currents will be reduced, due to the GAA electrostatics surrounding the nanosheet channel (more on that shortly).

Analog circuits may be more readily optimized, rather than strictly relying upon a ratio of the number of fins.  SRAM cell designs are no longer limited to the PD:PU:PG = 2:1:1 or 1:1:1 FinFET sizing restrictions.

Currently, FinFET standard cell libraries offer cells in integral 1X, 2X, 4X drive strength options, often with 3 or 4 device Vt variants.  With greater sizing freedom (and potentially fewer device Vt alternatives) in a GAA technology, library designers have a different set of variables from which to select.  It will be interesting to see how cell library designers utilize this device flexibility.

Ongoing Nanosheet Fabrication R&D

Jin described three areas of active process R&D for more optimum nanosheet characteristics.

  • increased SiGe stoichiometry for pFETs

The lower hole mobility in nanosheet Si layers is a concern.  Research is ongoing to increase the SiGe composition in pFET nanosheet layers (without adopting a SiGe superlattice stack, due to the topography difficulties mentioned above).  One approach would be to “trim” the pFET Si nanosheet thickness after superlattice etch, and deposit a SiGe “cladding” layer, prior to oxide and gate deposition.  The difficulty would be maintaining a uniform nanosheet thickness after the trim and SiGe cladding deposition steps.

  • optimization of parasitic Cgs/Cgd capacitances

FinFETs have a (relatively) high parasitic capacitance between gate and source/drain nodes, due in part to the gate vertical sidewall-to-S/D node capacitance contribution between fins.  The horizontal nanosheet utilizes a different gate-to-S/D oxide orientation, arising from the inner spacer deposited in the SiGe superlattice layers prior to S/D epitaxy and SiGe etch.  Jin highlighted that the nanosheet and recessed oxide dimensions need to be optimized not only for the drive current, but also the parasitic Cgs/Cgd capacitances, as illustrated below.

  • bottom nanosheet “mesa” leakage

The GAA topology improves upon the (3-sided) FinFET electrostatics, reducing subthreshold device leakage current.  However, there is a parasitic leakage path for the very bottom (or “mesa”) nanosheet layer.  After the superlattice etching, oxide dep, and gate dep steps, the gate-to-substrate electrostatics offers a (non-GAA) channel current path.

As illustrated above, Jin highlighted R&D efforts to reduce this leakage current contribution, through either:

  • additional impurity introduction below the nanosheet stack
  • partial dielectric isolation between the substrate and S/D nodes
  • full dielectric isolation between the substrate, S/D nodes, and bottom layer nanosheet gate

Summary

Jin’s presentation offered great insights into the relative characteristics of FinFET and GAA devices, as process nodes evolve to the horizontal nanosheet topology.  Designers will benefit from reduced leakage currents and design sizing flexibility, although disparities between nanosheet channel electron and hole mobility will require renewed consideration of circuit beta ratios.  Ongoing process R&D efforts are seeking to reduced this carrier mobility difference, and optimize parasitic Rs, Rd, Cgs, and Cgd elements.

Jin presented a rough timeline shown below, for the introduction of GAA nanosheet technology, before new device configurations (e.g., 3D silicon fabrication) and non-silicon materials (e.g., 2D semiconductors) will emerge.

As Scotten also suggested in his article, if you have the opportunity, I would encourage you to register and view this enlightening VLSI Symposium short course.

-chipguy


Stochastic Origins of EUV Feature Edge Roughness

Stochastic Origins of EUV Feature Edge Roughness
by Fred Chen on 07-11-2021 at 10:00 am

Stochastic Origins of EUV Feature Edge Roughness

Due to the higher energy of EUV (13.3-13.7 nm wavelength) compared to ArF (193 nm wavelength) light, images produced by EUV are more susceptible to photon shot noise.

Figure 1. (Left) 40 nm dense (half-pitch) line image projected onto wafer at 35 mJ/cm2; (Right) 20 nm dense (half-pitch) line image projected onto wafer at 70 mJ/cm2. The label numbers indicate photons/pixel (1 nm x 1nm for ArF (left), 0.5 nm x 0.5 nm for EUV (right). Photon numbers are simulated according to Gaussian-weighted random sampling between -3sigma and +3sigma as determined from the local photon dose and the Poisson distribution.

The projected images are generally smoothed by photogenerated species diffusion (such as acids, secondary electrons, etc.), which are often represented as Gaussian blur functions [1]. Dose-dependent blur can possibly be linked to the emergence of defects [2]. The blur function should only be effective over a fraction of the feature width; otherwise the whole feature is washed out. By applying a reasonable pixel averaging function, the actual printed images may be simulated:

Figure 2. A 7 x 7 pixel rolling average is applied to the images of Figure 1. Pixel size is 1 nm x 1 nm (left) and 0.5 nm x 0.5 nm (right).

The EUV image after smoothing still carries more line edge roughness (LER) than the DUV case. This can be more quantitatively presented as an edge position uncertainty.

Figure 3. Individual line scans for the ArF (left) and EUV (right) cases of Figure 2.

In Figure 3, while the ArF line scans show virtually no edge movement, the EUV line scans show a 1-2 nm range of possible positions for each edge. A larger effective range of the blur (or more pixels being averaged) would reduce this range, but also begins to affect the original line image as a whole as the feature width is approached.

2D features show even more obvious edge variability, as shown in Figure 4.

Figure 4. Hexagonally staggered contacts in a 40 nm (x) by 70 nm (y) unit cell. Left: Incident photon images. Right: 5 x 5 pixel (1 nm) rolling average applied.

There are obvious shape variations from contact to contact, as well as corresponding contact area differences, leading to obvious implications for contact resistance. As estimated earlier [3], a 57 x increase in dose (14.3 x wavelength difference, 4x pixel area difference) would be needed for the 20 nm EUV image to have the same stochastic quality as the 40 nm ArF image.

References

[1] https://www.linkedin.com/pulse/contrast-reduction-vs-photon-noise-euv-lithography-frederick-chenhttps://semiwiki.com/lithography/299525-contrast-reduction-vs-photon-noise-in-euv-lithography/

[2] https://www.linkedin.com/pulse/from-shot-noise-stochastic-defects-dose-dependent-gaussian-chen/

[3] https://www.linkedin.com/pulse/stochastic-behavior-optical-images-impact-resolution-frederick-chen

This article originally appeared in LinkedIn Pulse: Stochastic Origins of EUV Feature Edge Roughness

Related Lithography Posts


Apple’s Orphan Silicon

Apple’s Orphan Silicon
by Paul Boldt on 07-11-2021 at 6:00 am

T2 die anno lr

Apple’s recent Spring Loaded Event brought us M1-based iMacs.  After the MacBook Air and 13” MacBook Pro in the fall, iMacs are the third Mac to jettison Intel processors.  With this transition Apple’s T2 chip enters End of Life status, so to speak.  The T2 is a bit of an enigma and now it does not have much time left.

We know it performs a wide range of tasks in Macs, including security, encryption, video processing, storage control and housekeeping.  This 2019 AppleInsider article tested encode times for Macs having the same processor, where one had a T2, and one did not.  The Mac with the T2 executed the encode in 1/2 the time.

Despite all this functionality we know surprising little about the T2.  There simply is not much information floating around.  Wikipedia does not even report a die size or process node.  Did Apple design a whole new chip? How much is borrowed from the A-series family?  How much is new design?  How much is Apple investing to achieve the desired functionality for Macs?  It is time to look at a T2 and find out what Apple created for their Intel-based Mac co-processor.

Package & hints of memory

The T2 under study came from a 2019 13” MacBook Air logic board.  The T2’s package has a decent footprint compared to the other ICs around it.  For comparison, the larger of the shiny dies to the right of the T2, between four mounts, is the Intel i5.  One can envision the T2 being a similar size, based on the package.  There is a “1847” date code on the package indicating late 2018 assembly.

2019 13” MacBook Air logic board

A teardown of the late 2018 MacBook Air simply listed the T2’s part number.  However, a teardown of a 2019 15” MacBook Pro indicated the T2 was “layered on a 1 GB Micron D9VLN LPDDR4 memory”.  Our package also included the “D9VLN” marking.  A decoder at Micron points to a 1GB LPDDR4.  The T2 and memory would likely be in a Package-On-Package (PoP) arrangement.

A second die was in fact found in the beaker after de-packaging.  The markings visible at top metal are Micron’s.  The inclusion of in-package DRAM is interesting, not to mention costly, for a companion IC or co-processor.  It is however not too surprising considering the T2 is derived from the A-series that has long had in-package DRAM.

Top metal die markings of second die in T2 package.

Die photo & “PUs”

It is time for the main event.  SEM analysis of several line pitches and 6T SRAM cell size confirmed the T2 is fabbed in a TSMC16 nm process.  This is the same node as the A10, so the latter will serve as a reference A-series processor against which the T2 can be compared.

T2 die photo with CPU and GPU annotations.

A10 die photo with original annotations.  Source: Chipworks

Visually, the CPU is the  first thing that jumps out at you.  It is the same design and layout as the A10.  Assuming the T2 was designed after the A10, the CPU was dropped in as a hard macro.  Remember it is a 4-core CPU!  There are two performance i.e. large Hurricane cores and two efficiency i.e. small Zephyr cores.  That is quite a bit power considering there is already an Intel i5 for the main system processor.

One can only imagine the conversation within Apple.  “Do you have any CPU’s ready to go?”  “Yup … there is a 4-core 17.4 mm2 design that is only a few months old on the shelf over there.” “Great, I’ll take one of those.” Well, maybe it was a bit more technical.

The GPU does not follow suit.  The A10’s 6-core GPU is organized as 3 blocks for the cores and a block of logic.  The T2’s GPU appears to be along the lower edge of the die.  Again, the cores are organized as 3 blocks.  We did not discern symmetry within these blocks, suggesting 3 cores.  The GPU logic is likely in a block just above the cores, where the hashed lines encircle a potential area for it.  Even if all 3 blocks within this area were GPU logic, it would be smaller than that identified for the A10.  There is more analysis needed here to confirm the GPU configuration, but there are suggestions that both the GPU’s logic and cores are smaller than those on the A10.

Additional block-level analysis is ongoing.  We see blocks that were used as-is, when compared to the A10, ones that received a new layout, and straight-up new design.

Early numbers

The T2 measures 9.6 mm by 10.8 mm, yielding a die size of 104 mm2.  It is not a small die!  The T2 is a serious processor.  This is roughly 80% of the A10’s 125 mm2.

As expected, the CPU has an area of approximately 17.4 mm2 on both dies.  This yields a higher % of the total die dedicated to the CPU in the T2.  The T2’s GPU is considerably smaller than the A10’s.  Each core comes in at 1.2 mm2 v. 5.3 mm2 for the cores of the A10.  Functionally, this makes sense as the T2 GPU should not be tasked near as much as the A10’s because it is not the primary GPU.  Again, there is already either Intel embedded graphics or a dedicated GPU on the logic board.

Pulling threads together

There is plenty more to extract from the reverse engineering, but this snippet provides a flavor of Apple’s thinking.  As a starting point, Apple looks to user functionality.  An ongoing question at Apple seems to be “What do we want the user to experience from an Apple product?”  Then they build it.  The T2 became Apple’s interpretation of this for Intel-based Macs, but remember prior to the T1 the Intel processors were flying solo, and Macs still worked.

The T2 leveraged design from the A-series processors as shown in the CPU.  It’s 4-core CPU is large, to say the least, and it is hard not to think it is overpowered for the T2.  That said, Apple would look at the cost of re-design v. the silicon cost associated with dropping in something that might be larger than is truly needed.  The latter was probably more enticing as the wafer starts for the T2 would be nowhere near those of the A10, or any A-series processor for that matter.  Besides, the extra horsepower will provide a better experience.

The T2 also consolidated stand-alone ICs within a Mac.  The storage or SSD controller is one example of this.  Apple bought Israeli-based Anobit in 2011.  The 2016 13” MacBook Pro (with Function Keys) included an Apple stand-alone storage controller (see slide 11).  The controller became a block on the T2.  Today, it would be a block on the M1.

Conclusion

We will continue to dig into the T2, focusing on the known block functionalities, it’s comparison with the A10 and looking forward.  Yes, the T2 and the A10 are both old designs, but the comparison liberates information about use of semiconductor design and the effort Apple invests to provide their desired user experience.

*This article is jointly authored by Lev Klibanov. Dr. Klibanov is an independent consultant in semiconductor process and related fields. Dr. Klibanov has focused on and has considerable experience in advanced CMOS logic, non-volatile memory, CMOS image sensors, advanced packaging, and MEMS technologies.  He has spent 20+ years working in reverse engineering, metrology, and fabrication.


Podcast EP28: Funding approaches for semiconductor startups

Podcast EP28: Funding approaches for semiconductor startups
by Daniel Nenni on 07-09-2021 at 10:00 am

Dan is joined by Wally Rhines to discuss funding approaches for semiconductor startups. Wally has led a fundraising effort for a fabless semiconductor startup for the last year.  His experience is useful for others who are trying to raise funding for promising semiconductor startups.

Wally Rhines is widely recognized as an expert in business value creation and technology for the semiconductor and electronic design automation (EDA) industries. https://en.wikipedia.org/wiki/Wally_Rhines

The views, thoughts, and opinions expressed in these podcasts belong solely to the speaker, and not to the speaker’s employer, organization, committee or any other group or individual.


CEO Interview: Harald Neubauer of MunEDA

CEO Interview: Harald Neubauer of MunEDA
by Daniel Nenni on 07-09-2021 at 6:00 am

Harald Neubauer CEO of MunEDA

It has been my pleasure to interview Harald Neubauer, CEO of MunEDA. A veteran of the EDA industry, Harald cofounded MunEDA in 2001.

What brought you to the EDA industry?

Well, I always wanted to found a tech startup and was developing and evaluating various business ideas together with my later cofounder Andreas. Soon after we got introduced to Michael and Frank, who both worked on optimization techniques and statistical analysis at the Chair of Electronic Design Automation at TUM back in 2001, we started off in EDA as a spin off from the Technical University of Munich. Since then and until today all four of us have been serving as managing partner and building up MunEDA together.

Please tell us more about the origin of MunEDA

The origin of MunEDA has been based on excellent EDA research work done at the Technical University of Munich. The TUM Department of Electrical and Computer Engineering has been consistently ranked among the most successful departments worldwide. We have a continuous close cooperation with TUM and Prof. Ulf Schlichtmann, Prof. Kurt Antreich and Prof. Helmut Gräb from the Chair of Electronic Design Automation have been serving as member of MunEDA`s Advisory Board for many years until today.

So MunEDA stands for Munich EDA?

Oh yes, how could you tell? But certainly, MunEDA today also stands for EDA Tools for process migration, circuit sizing and optimization, as well as for high-sigma variation analysis and verification of Custom ICs.

Our key customers are Integrated Device Manufacturers, fabless IC design houses and silicon foundries. Our tool suite WiCkeD™ has been proven in industrial use for many years with semiconductor industry leaders globally and we do have numerous published success cases from our annual user group meetings from these companies.

What makes MunEDA unique?

Well, within our tool suite WiCkeD™, we offer the industry’s most advanced and powerful EDA tool suite for circuit sizing & optimization. Our solutions help circuit designers to improve the circuit design efficiency, decrease the risk of hidden failures and significantly increase the circuit quality. Designers often use WiCkeD™ especially for difficult sizing problems involving trade-offs between corners, parametric variation, yield, area, low power and low noise.

With our WiCkeD™ High Sigma and Variation tools we deliver best-in-class EDA tools for automated circuit analysis for high-sigma and ultra-high-sigma variation even beyond 6 sigma. Our solutions are unique in terms of speed, accuracy and scalability.

Our WiCkeD™ Schematic Porting Tool helps circuit designers to smoothly migrate analog IP from older process nodes to newer technologies or from one foundry technology to another foundry technology.

What are the top applications for the WiCkeD™ tool suite?

Gaining efficiency and quality with analog and mixed-signal design migration, optimization, and verification are the three main drivers for customers introducing our tools into their design flow. Analog and mixed-signal circuit optimization is applied with great success to interface circuits such as memory I/O in advanced node technologies, but also to power management ICs, amplifiers, comparators, RF power amplifiers, transceivers, filters, and other analog IP in larger more-than-Moore processes. Typical goals are minimizing power consumption and/or area footprint while meeting performance requirements for every process condition, temperature and supply voltage.

What does the next twelve months have in store for MunEDA?

MunEDA’s solutions enable customers to reduce the design time and effort of their circuits, increase robustness, and maximize circuit performance and yield. This is ever more important, especially in current times of chip shortage and also talent shortage in the semiconductor industry.

Moreover, we see more demand now for circuit migration to FinFET technologies. Going from bulk CMOS to FinFET with its discrete optimization variables and layout-dependent effects posed new challenges for optimization tools that we addressed.

We also increased the capacity of our analysis and verification tools. The statistical software is now able to efficiently perform statistical analysis of standard cells for LVF characterization, as well as high-sigma analysis of memory read paths with 100,000 devices and more.

So within the next 12 months, we are looking forward to see many further new customers looking for enhancing their capabilities with our leading-edge EDA tools to speed up their design work while achieving higher quality.

Also Read:

Webinar on Methods for Monte Carlo and High Sigma Analysis

Webinar on Tools and Solutions for Analog IP Migration

56th DAC – In Depth Look at Analog IP Migration from MunEDA


PCIe Gen 6 Verification IP Speeds Up Chip Development

PCIe Gen 6 Verification IP Speeds Up Chip Development
by Tom Simon on 07-08-2021 at 10:00 am

PCIe Gen 6 VIP

PCIe is a prevalent and popular interface standard that is used in just about every digital electronic system. It is used widely in SOCs and in devices that connect to them. Since it was first released in 2003, it has evolved to keep up with rapidly accelerating needs for high speed data transfers. Each version has doubled in throughput, with updates coming every few years – except for the notable gap between version 3.0 and 4.0. PCIe Gen 6 is expected to be have its final release in 2021.

PCIe Gen 6 supports 126 GB/s in each direction when using 16 lanes. The individual lane speed will be 7.87 GB/s. Many changes were made in the specification to achieve these data rates. Most significant of these is the change to PAM-4 (pulse amplitude modulation with four levels) and the addition of ECC. Numerous other changes were made to the protocol as well. As is always the case, PCIe Gen 6 interfaces will be backward compatible with earlier versions to ensure interoperability. All of this is good news to system designers in need of higher bandwidth and flexibility.

However, these changes mean that designing and verifying complete and correct functionality has become even more difficult. Lots of system designers will choose to use IP blocks to help implement PCIe Gen 6 in their designs. Whether or not the interface controller and PHY are developed in house or outsourced, complete verification is a necessity.

Developing a test suite takes a level of effort on par with or greater than developing the PCIe IP itself. Fortunately, Truechip, a developer of verification IP(VIP), offers a complete test suite and verification environment for PCIe Gen 6. Their VIP is fully compliant with the latest PCIe Gen 6 specifications. It is built, using years of experience, to be lightweight, with an easy plug-and-play interface to ensure rapid deployment.

PCIe Gen 6 VIP

Their PCIe test bench includes agents for the Root Complex and the Device Endpoint. They each come with bus functional models for the TL, DL and PHY layers. In addition, there is a PCIe Bus Monitor which performs many useful operations. It supports assertions, coverage, as well as checkers for the TL, DL and PHY. All of this is connected to a scoreboard to help monitor test results.

The test bench is backward compatible with all of the relevant earlier specifications. It supports precoding for 32GT/s and 64GT/s, PAM-4 signaling, FLIT and non-FLIT mode and the new PIPE 6.0 specification. It can be configured to support from x1 to x32 link widths. All low power management states, including the new L0p state are available. The list of features in the documentation and data sheet is comprehensive and supports every feature in the specification.

To ensure comprehensive validation the test environment and test suite provide a wide range of tests. Users can run basic and directed protocols tests. There are also random tests and error scenario tests. Truechip includes assertions and cover point tests. Lastly there are compliance tests, to ensure the finish product will work smoothly with other PCIe devices. There is a full set of documentation that goes through the integration process and can be used as a reference guide during use.

The time frame for bringing PCIe Gen 6 devices to market is fast approaching. Truechip has already had customer deliveries for this VIP product. Having ready to go VIP can make a big positive impact on the development and testing schedules for products that rely on PCIe Gen6. With PCIe playing such a large role in SOCs and device operation, it is crucial to support the latest standard and be able to offer the highest interoperability, quality and reliability. Truechip offers much more information about their PCIe Gen 6 VIP on their website. If you are developing products that rely on PCIe Gen 6, it might be worth a look.

Also read:

Bringing PCIe Gen 6 Devices to Market

USB4 Makes Interfacing Easy, But is Hard to Implement

TrueChip CXL Verification IP

Webinar Replay on TileLink from Truechip


The Design Lifecycle of an Electronics Interface

The Design Lifecycle of an Electronics Interface
by Kalar Rajendiran on 07-08-2021 at 6:00 am

Product Process Organizational Complexities

We live in a world run by electronics systems. With the exception of completely isolated systems, all others take inputs, process them and produce outputs. The value of a system is determined not only by how well it processes the inputs but also by how well it handles inputs and outputs. Handling in this context means, how much data can the system take in and how fast can it accurately read inputs and write outputs. That is the reason so much importance has been placed on electronics interfaces over the years.

Over time, the industry has introduced a number of different interfaces to satisfy various applications and systems needs. In the age of big data, high performance computing and edge computing, very high-speed interfaces are intrinsic to electronics systems. The demanding data transfer requirements of these systems impose their own complexity factors into electronics systems designs. But the introduced complexities are not just from the tight and demanding specification of the interfaces themselves. The traditional design methodology (process) and design teams (organizational) introduce significant challenges as well. Refer to Figure 1. These challenges cut deep into how successfully and cost-effectively the systems are designed for manufacture. Yet not much attention is focused on these aspects.

Figure 1

Source: Siemens EDA


A recently published whitepaper identifies how these challenges affect a number of phases of the design lifecycle from design definition all the way through to design approval for release to manufacture. The whitepaper is titled “The Design Lifecycle of an Electronics Interface,” and is authored by David Wiens, product marketing manager at Siemens Digital Industries Software. A primer reading material is an earlier SemiWiki blog, “The Five Pillars for Profitable Next Generation Electronic Systems,” which is based off of another whitepaper by David Wiens.

While the earlier whitepaper discusses the full scope of digital transformation needed for next-generation electronic systems design, the latest one focuses on ways to overcome challenges faced during the lifecycle of implementing electronic interfaces.

Design definition and early optimization phase

As the topology of an interface can span across multiple boards, more than one stack-up may be likely and the interconnect topology will include connectors. To ensure optimal performance, it is easy to play conservative and over-specify materials, which will lead to high-cost boards. Tools to allow early exploration of interface interconnect topologies enables optimal termination and decoupling strategies in the context of the chosen stack-ups. With large teams collaborating on complex designs, errors can easily creep in. Errors such as components not properly connected to power or ground, missing power, incorrect diode orientation, missing drivers or receivers and incorrect board-to-board connections are frequently seen with large teams working on complex designs. Rugged tools will catch these errors from propagating to layout.

Interface constraint definition phase

Traditionally, constraints definition and communication among team members have followed a manual approach. This calls for manually converting electrical constraints into their physical equivalents when preparing for layout, thereby restricting the options during layout. Ideally signal integrity analysis should directly generate constraints for topology and impedance. Tools that operate off of a unified constraints playbook and allow multiple members of the team to review and update constraints reduces the chances of errors due to miscommunications among team members.

Mechanical design and component placement phase

As the design of physical boards involves collaboration with teams from various disciplines, a very strong common thread is needed to eliminate the need for frequent data re-entries. A virtual model of the final product that is being designed is called a digital-twin. Tools that work off of a unified data base operating under a digital-twin methodology will serve well to minimize rework once routing starts.

Design approval and release phase

With the design reviewed for performance and manufacturability, the final step involves cost estimates, confirmation of materials and component availability and final management signoff on the design. Traditionally this involves generating and sending various files around to different people but to maintain a common thread approach, everyone should have access to a single unified database.

Tying it all together

The common thread that ties together the entire process and associated teams’ design related activities is made possible through advanced tools. Siemens EDA’s Xcelerator portfolio of tools enables integrated workflows and organizations to deliver digital transformations. Xcelerator technologies that address the challenges in this paper include: the Xpedition Enterprise design flow for electronics systems, NX for mechanical design, Teamcenter for PLM data management, HyperLynx and Simcenter for performance verification, and Valor for manufacturability verification.

Summary

If you are involved in designing electronics interfaces, I strongly recommend downloading and reading David’s complete whitepaper. It contains a lot of objective and compelling details to help you evaluate if any critical changes may be needed in your design process and team deployments.