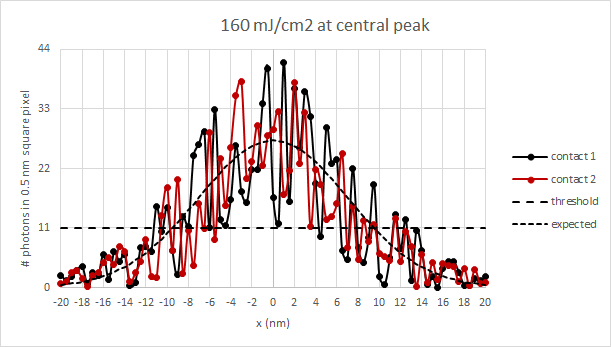
The stochastic behavior of images formed in EUV lithography has already been highlighted by a number of authors [1-3]. How serious it appears depends on the pixel size with which the photons are bunched. Generally, though, for features of around 20 nm or less, even 1 nm can have at least a +/- 15% gradient across it, which is still a considerable deviation from the condition for applying the Poisson distribution. Applying a 0.5 nm pixel at least can get below +/- 10%. Using such a pixel size, the noise is readily apparent for 19 nm contacts at 65 mJ/cm2 (Figure 1). Multiple locations are expected to fail to reach the threshold to print in the resist.
Figure 1. Targeting a 19 nm feature width at 65 mJ/cm2. The noise (up to +/- 3 sigma) is significant across the feature as well as different at different feature locations. A 0.5 nm pixel size is used for photon grouping.
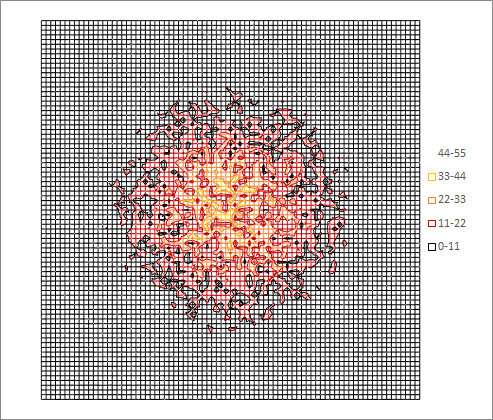
The picture becomes even more striking when it is viewed as a 2D feature like a contact or via from above (Figure 2), using the same 0.5 nm x 0.5 nm pixel size.
Figure 2. A 2D top view of the feature in Figure 1. The same printing threshold of 11 photons per 0.5 nm square pixel is used.
This picture shows the incident photon number spatial distribution; the actual absorbed photon number distribution is even more noisy. The black areas are those areas where the actual photon number is not expected to expose the resist. There are many of them within where the feature is expected to print. Clearly, the actual image typically formed in the resist does not resemble this picture. Apparently, some mechanism is able to smoothe out this appearance. The migration of secondary electrons [4] is one. Acid diffusion [5] is another. Although these factors can help smoothe out the roughness, they must operate over scales comparable to the feature size itself. In other words, the resist contrast must be sufficiently blurry to fight the photon shot noise [1]. Smaller features present more noise, which would need more blur. At some point, the contrast reduction from the blur will become prohibitive.
References
[1] https://www.fractilia.com/s/Morestochasticsandthephenomenonofline-edgeroughness_Mack-lnfk.pdf
[2] P. deBisschop and E. Hendrickx, Proc. SPIE 10957, 109570E (2019).
[3] https://www.linkedin.com/pulse/demonstration-stochastic-edge-placement-error-epe-frederick-chen
[4] A. Narasimhan et al., Proc. SPIE 9422, 942208 (2015).
[5] https://www.jstage.jst.go.jp/article/photopolymer/27/5/27_623/_pdf


Moore’s Law Wiki