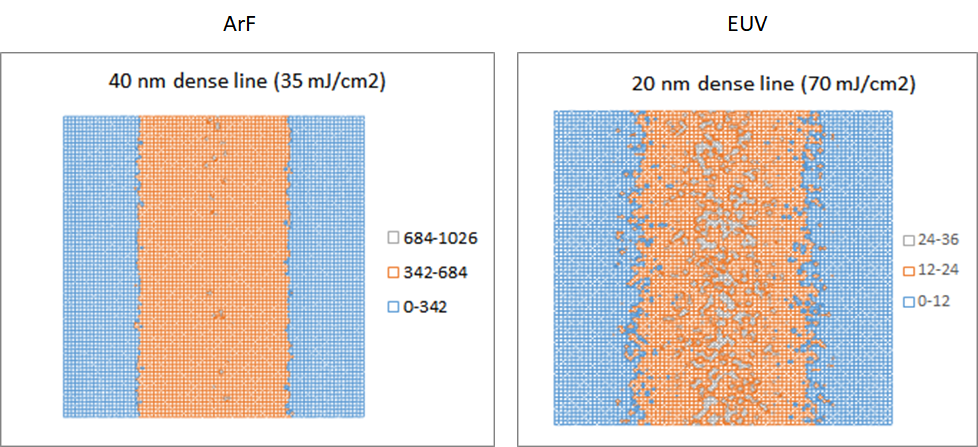
Due to the higher energy of EUV (13.3-13.7 nm wavelength) compared to ArF (193 nm wavelength) light, images produced by EUV are more susceptible to photon shot noise.
Figure 1. (Left) 40 nm dense (half-pitch) line image projected onto wafer at 35 mJ/cm2; (Right) 20 nm dense (half-pitch) line image projected onto wafer at 70 mJ/cm2. The label numbers indicate photons/pixel (1 nm x 1nm for ArF (left), 0.5 nm x 0.5 nm for EUV (right). Photon numbers are simulated according to Gaussian-weighted random sampling between -3sigma and +3sigma as determined from the local photon dose and the Poisson distribution.
The projected images are generally smoothed by photogenerated species diffusion (such as acids, secondary electrons, etc.), which are often represented as Gaussian blur functions [1]. Dose-dependent blur can possibly be linked to the emergence of defects [2]. The blur function should only be effective over a fraction of the feature width; otherwise the whole feature is washed out. By applying a reasonable pixel averaging function, the actual printed images may be simulated:
Figure 2. A 7 x 7 pixel rolling average is applied to the images of Figure 1. Pixel size is 1 nm x 1 nm (left) and 0.5 nm x 0.5 nm (right).
The EUV image after smoothing still carries more line edge roughness (LER) than the DUV case. This can be more quantitatively presented as an edge position uncertainty.
Figure 3. Individual line scans for the ArF (left) and EUV (right) cases of Figure 2.
In Figure 3, while the ArF line scans show virtually no edge movement, the EUV line scans show a 1-2 nm range of possible positions for each edge. A larger effective range of the blur (or more pixels being averaged) would reduce this range, but also begins to affect the original line image as a whole as the feature width is approached.
2D features show even more obvious edge variability, as shown in Figure 4.
Figure 4. Hexagonally staggered contacts in a 40 nm (x) by 70 nm (y) unit cell. Left: Incident photon images. Right: 5 x 5 pixel (1 nm) rolling average applied.
There are obvious shape variations from contact to contact, as well as corresponding contact area differences, leading to obvious implications for contact resistance. As estimated earlier [3], a 57 x increase in dose (14.3 x wavelength difference, 4x pixel area difference) would be needed for the 20 nm EUV image to have the same stochastic quality as the 40 nm ArF image.
References
[1] https://www.linkedin.com/pulse/contrast-reduction-vs-photon-noise-euv-lithography-frederick-chen; https://semiwiki.com/lithography/299525-contrast-reduction-vs-photon-noise-in-euv-lithography/
[2] https://www.linkedin.com/pulse/from-shot-noise-stochastic-defects-dose-dependent-gaussian-chen/
[3] https://www.linkedin.com/pulse/stochastic-behavior-optical-images-impact-resolution-frederick-chen
This article originally appeared in LinkedIn Pulse: Stochastic Origins of EUV Feature Edge Roughness
Share this post via:


Moore’s Law Wiki