Threads
XF\Mvc\Entity\ArrayCollection Object
(
[entities:protected] => Array
(
[25553] => ThemeHouse\XPress\XF\Entity\Thread Object
(
[_uniqueEntityId:XF\Mvc\Entity\Entity:private] => 57
[rootClass:protected] => XF\Entity\Thread
[_useReplaceInto:protected] =>
[_newValues:protected] => Array
(
)
[_values:protected] => Array
(
[thread_id] => 25553
[node_id] => 2
[title] => Intel Layoff, Data Center Group, 2026-July
[reply_count] => 24
[view_count] => 1425
[user_id] => 5
[username] => Daniel Nenni
[post_date] => 1784581906
[sticky] => 0
[discussion_state] => visible
[discussion_open] => 1
[discussion_type] => discussion
[first_post_id] => 101916
[first_post_reaction_score] => 1
[first_post_reactions] => {"1":1}
[last_post_date] => 1784697453
[last_post_id] => 101978
[last_post_user_id] => 447054
[last_post_username] => tim_b
[prefix_id] => 0
[tags] => []
[custom_fields] => []
[vote_score] => 0
[vote_count] => 0
[featured] => 0
[type_data] => []
[index_state] => default
)
[_relations:protected] => Array
(
[User] => ThemeHouse\XLink\XF\Entity\User Object
(
[_uniqueEntityId:XF\Mvc\Entity\Entity:private] => 54
[rootClass:protected] => XF\Entity\User
[_useReplaceInto:protected] =>
[_newValues:protected] => Array
(
)
[_values:protected] => Array
(
[user_id] => 5
[username] => Daniel Nenni
[username_date] => 0
[username_date_visible] => 0
[email] => dnenni@semiwiki.com
[custom_title] => Founder
[language_id] => 1
[style_id] => 0
[style_variation] =>
[timezone] => America/Los_Angeles
[visible] => 1
[activity_visible] => 1
[user_group_id] => 3
[secondary_group_ids] => 4,5,132
[display_style_group_id] => 3
[permission_combination_id] => 88
[message_count] => 15855
[question_solution_count] => 0
[conversations_unread] => 0
[register_date] => 1280720820
[last_activity] => 1784695634
[last_summary_email_date] => 1605968657
[trophy_points] => 113
[alerts_unviewed] => 103
[alerts_unread] => 103
[avatar_date] => 1663211649
[avatar_width] => 110
[avatar_height] => 107
[avatar_highdpi] => 0
[avatar_optimized] => 0
[gravatar] =>
[user_state] => valid
[security_lock] =>
[is_moderator] => 1
[is_admin] => 1
[is_banned] => 0
[reaction_score] => 9702
[warning_points] => 0
[is_staff] => 1
[secret_key] => 0HwyUVVHCwJotUUVEpvqAclfYJdGNPpw
[privacy_policy_accepted] => 0
[terms_accepted] => 0
[vote_score] => 0
)
[_relations:protected] => Array
(
)
[_previousValues:protected] => Array
(
)
[_options:protected] => Array
(
)
[_deleted:protected] =>
[_readOnly:protected] =>
[_writePending:protected] =>
[_writeRunning:protected] =>
[_errors:protected] => Array
(
)
[_whenSaveable:protected] => Array
(
)
[_cascadeSave:protected] => Array
(
)
[_behaviors:protected] =>
)
[Forum] => XF\Entity\Forum Object
(
[_uniqueEntityId:XF\Mvc\Entity\Entity:private] => 56
[rootClass:protected] => XF\Entity\Forum
[_useReplaceInto:protected] =>
[_newValues:protected] => Array
(
)
[_values:protected] => Array
(
[node_id] => 2
[discussion_count] => 8891
[message_count] => 64897
[last_post_id] => 101978
[last_post_date] => 1784697453
[last_post_user_id] => 447054
[last_post_username] => tim_b
[last_thread_id] => 25553
[last_thread_title] => Intel Layoff, Data Center Group, 2026-July
[last_thread_prefix_id] => 0
[moderate_threads] => 0
[moderate_replies] => 0
[allow_posting] => 1
[count_messages] => 1
[auto_feature] => 0
[find_new] => 1
[allow_index] => allow
[index_criteria] =>
[field_cache] => []
[prefix_cache] => []
[prompt_cache] => []
[default_prefix_id] => 0
[default_sort_order] => last_post_date
[default_sort_direction] => desc
[list_date_limit_days] => 0
[require_prefix] => 0
[allowed_watch_notifications] => all
[min_tags] => 0
[forum_type_id] => discussion
[type_config] => {"allowed_thread_types":["poll"]}
)
[_relations:protected] => Array
(
[Node] => XF\Entity\Node Object
(
[_uniqueEntityId:XF\Mvc\Entity\Entity:private] => 55
[rootClass:protected] => XF\Entity\Node
[_useReplaceInto:protected] =>
[_newValues:protected] => Array
(
)
[_values:protected] => Array
(
[node_id] => 2
[title] => SemiWiki Main Forum ( Ask the Experts! )
[description] => Post your questions to the experts here!
[node_name] =>
[node_type_id] => Forum
[parent_node_id] => 1
[display_order] => 1
[display_in_list] => 1
[lft] => 2
[rgt] => 3
[depth] => 1
[style_id] => 0
[effective_style_id] => 0
[breadcrumb_data] => {"1":{"node_id":1,"title":"Main Category","depth":0,"lft":1,"node_name":null,"node_type_id":"Category","display_in_list":true}}
[navigation_id] =>
[effective_navigation_id] =>
)
[_relations:protected] => Array
(
)
[_previousValues:protected] => Array
(
)
[_options:protected] => Array
(
)
[_deleted:protected] =>
[_readOnly:protected] =>
[_writePending:protected] =>
[_writeRunning:protected] =>
[_errors:protected] => Array
(
)
[_whenSaveable:protected] => Array
(
)
[_cascadeSave:protected] => Array
(
)
[_behaviors:protected] =>
)
)
[_previousValues:protected] => Array
(
)
[_options:protected] => Array
(
)
[_deleted:protected] =>
[_readOnly:protected] =>
[_writePending:protected] =>
[_writeRunning:protected] =>
[_errors:protected] => Array
(
)
[_whenSaveable:protected] => Array
(
)
[_cascadeSave:protected] => Array
(
)
[_behaviors:protected] =>
)
[25549] => ThemeHouse\XPress\XF\Entity\Thread Object
(
[_uniqueEntityId:XF\Mvc\Entity\Entity:private] => 61
[rootClass:protected] => XF\Entity\Thread
[_useReplaceInto:protected] =>
[_newValues:protected] => Array
(
)
[_values:protected] => Array
(
[thread_id] => 25549
[node_id] => 2
[title] => Semiwiki Access Other Apps on Phone
[reply_count] => 8
[view_count] => 435
[user_id] => 20231
[username] => Barnsley
[post_date] => 1784531340
[sticky] => 0
[discussion_state] => visible
[discussion_open] => 1
[discussion_type] => discussion
[first_post_id] => 101886
[first_post_reaction_score] => 0
[first_post_reactions] => []
[last_post_date] => 1784695634
[last_post_id] => 101977
[last_post_user_id] => 5
[last_post_username] => Daniel Nenni
[prefix_id] => 0
[tags] => []
[custom_fields] => []
[vote_score] => 0
[vote_count] => 0
[featured] => 0
[type_data] => []
[index_state] => default
)
[_relations:protected] => Array
(
[User] => ThemeHouse\XLink\XF\Entity\User Object
(
[_uniqueEntityId:XF\Mvc\Entity\Entity:private] => 58
[rootClass:protected] => XF\Entity\User
[_useReplaceInto:protected] =>
[_newValues:protected] => Array
(
)
[_values:protected] => Array
(
[user_id] => 20231
[username] => Barnsley
[username_date] => 0
[username_date_visible] => 0
[email] => apickering72@gmail.com
[custom_title] =>
[language_id] => 1
[style_id] => 0
[style_variation] =>
[timezone] => Asia/Irkutsk
[visible] => 1
[activity_visible] => 1
[user_group_id] => 2
[secondary_group_ids] =>
[display_style_group_id] => 2
[permission_combination_id] => 8
[message_count] => 1581
[question_solution_count] => 0
[conversations_unread] => 0
[register_date] => 1429440429
[last_activity] => 1784703415
[last_summary_email_date] => 1653315673
[trophy_points] => 113
[alerts_unviewed] => 14
[alerts_unread] => 14
[avatar_date] => 0
[avatar_width] => 0
[avatar_height] => 0
[avatar_highdpi] => 0
[avatar_optimized] => 0
[gravatar] =>
[user_state] => valid
[security_lock] =>
[is_moderator] => 0
[is_admin] => 0
[is_banned] => 0
[reaction_score] => 835
[warning_points] => 0
[is_staff] => 0
[secret_key] => iAnkz9GTDfivRmH1BOp6OTrgESJR57G8
[privacy_policy_accepted] => 0
[terms_accepted] => 0
[vote_score] => 0
)
[_relations:protected] => Array
(
)
[_previousValues:protected] => Array
(
)
[_options:protected] => Array
(
)
[_deleted:protected] =>
[_readOnly:protected] =>
[_writePending:protected] =>
[_writeRunning:protected] =>
[_errors:protected] => Array
(
)
[_whenSaveable:protected] => Array
(
)
[_cascadeSave:protected] => Array
(
)
[_behaviors:protected] =>
)
[Forum] => XF\Entity\Forum Object
(
[_uniqueEntityId:XF\Mvc\Entity\Entity:private] => 56
[rootClass:protected] => XF\Entity\Forum
[_useReplaceInto:protected] =>
[_newValues:protected] => Array
(
)
[_values:protected] => Array
(
[node_id] => 2
[discussion_count] => 8891
[message_count] => 64897
[last_post_id] => 101978
[last_post_date] => 1784697453
[last_post_user_id] => 447054
[last_post_username] => tim_b
[last_thread_id] => 25553
[last_thread_title] => Intel Layoff, Data Center Group, 2026-July
[last_thread_prefix_id] => 0
[moderate_threads] => 0
[moderate_replies] => 0
[allow_posting] => 1
[count_messages] => 1
[auto_feature] => 0
[find_new] => 1
[allow_index] => allow
[index_criteria] =>
[field_cache] => []
[prefix_cache] => []
[prompt_cache] => []
[default_prefix_id] => 0
[default_sort_order] => last_post_date
[default_sort_direction] => desc
[list_date_limit_days] => 0
[require_prefix] => 0
[allowed_watch_notifications] => all
[min_tags] => 0
[forum_type_id] => discussion
[type_config] => {"allowed_thread_types":["poll"]}
)
[_relations:protected] => Array
(
[Node] => XF\Entity\Node Object
(
[_uniqueEntityId:XF\Mvc\Entity\Entity:private] => 55
[rootClass:protected] => XF\Entity\Node
[_useReplaceInto:protected] =>
[_newValues:protected] => Array
(
)
[_values:protected] => Array
(
[node_id] => 2
[title] => SemiWiki Main Forum ( Ask the Experts! )
[description] => Post your questions to the experts here!
[node_name] =>
[node_type_id] => Forum
[parent_node_id] => 1
[display_order] => 1
[display_in_list] => 1
[lft] => 2
[rgt] => 3
[depth] => 1
[style_id] => 0
[effective_style_id] => 0
[breadcrumb_data] => {"1":{"node_id":1,"title":"Main Category","depth":0,"lft":1,"node_name":null,"node_type_id":"Category","display_in_list":true}}
[navigation_id] =>
[effective_navigation_id] =>
)
[_relations:protected] => Array
(
)
[_previousValues:protected] => Array
(
)
[_options:protected] => Array
(
)
[_deleted:protected] =>
[_readOnly:protected] =>
[_writePending:protected] =>
[_writeRunning:protected] =>
[_errors:protected] => Array
(
)
[_whenSaveable:protected] => Array
(
)
[_cascadeSave:protected] => Array
(
)
[_behaviors:protected] =>
)
)
[_previousValues:protected] => Array
(
)
[_options:protected] => Array
(
)
[_deleted:protected] =>
[_readOnly:protected] =>
[_writePending:protected] =>
[_writeRunning:protected] =>
[_errors:protected] => Array
(
)
[_whenSaveable:protected] => Array
(
)
[_cascadeSave:protected] => Array
(
)
[_behaviors:protected] =>
)
)
[_previousValues:protected] => Array
(
)
[_options:protected] => Array
(
)
[_deleted:protected] =>
[_readOnly:protected] =>
[_writePending:protected] =>
[_writeRunning:protected] =>
[_errors:protected] => Array
(
)
[_whenSaveable:protected] => Array
(
)
[_cascadeSave:protected] => Array
(
)
[_behaviors:protected] =>
)
[25537] => ThemeHouse\XPress\XF\Entity\Thread Object
(
[_uniqueEntityId:XF\Mvc\Entity\Entity:private] => 65
[rootClass:protected] => XF\Entity\Thread
[_useReplaceInto:protected] =>
[_newValues:protected] => Array
(
)
[_values:protected] => Array
(
[thread_id] => 25537
[node_id] => 2
[title] => 'The AI bubble is an OpenAI bubble:' Ed Zitron says the ChatGPT maker is the Lehman Brothers of AI
[reply_count] => 19
[view_count] => 1877
[user_id] => 5
[username] => Daniel Nenni
[post_date] => 1784255180
[sticky] => 0
[discussion_state] => visible
[discussion_open] => 1
[discussion_type] => discussion
[first_post_id] => 101817
[first_post_reaction_score] => 3
[first_post_reactions] => {"1":3}
[last_post_date] => 1784681490
[last_post_id] => 101971
[last_post_user_id] => 396
[last_post_username] => swka
[prefix_id] => 0
[tags] => []
[custom_fields] => []
[vote_score] => 0
[vote_count] => 0
[featured] => 0
[type_data] => []
[index_state] => default
)
[_relations:protected] => Array
(
[User] => ThemeHouse\XLink\XF\Entity\User Object
(
[_uniqueEntityId:XF\Mvc\Entity\Entity:private] => 54
[rootClass:protected] => XF\Entity\User
[_useReplaceInto:protected] =>
[_newValues:protected] => Array
(
)
[_values:protected] => Array
(
[user_id] => 5
[username] => Daniel Nenni
[username_date] => 0
[username_date_visible] => 0
[email] => dnenni@semiwiki.com
[custom_title] => Founder
[language_id] => 1
[style_id] => 0
[style_variation] =>
[timezone] => America/Los_Angeles
[visible] => 1
[activity_visible] => 1
[user_group_id] => 3
[secondary_group_ids] => 4,5,132
[display_style_group_id] => 3
[permission_combination_id] => 88
[message_count] => 15855
[question_solution_count] => 0
[conversations_unread] => 0
[register_date] => 1280720820
[last_activity] => 1784695634
[last_summary_email_date] => 1605968657
[trophy_points] => 113
[alerts_unviewed] => 103
[alerts_unread] => 103
[avatar_date] => 1663211649
[avatar_width] => 110
[avatar_height] => 107
[avatar_highdpi] => 0
[avatar_optimized] => 0
[gravatar] =>
[user_state] => valid
[security_lock] =>
[is_moderator] => 1
[is_admin] => 1
[is_banned] => 0
[reaction_score] => 9702
[warning_points] => 0
[is_staff] => 1
[secret_key] => 0HwyUVVHCwJotUUVEpvqAclfYJdGNPpw
[privacy_policy_accepted] => 0
[terms_accepted] => 0
[vote_score] => 0
)
[_relations:protected] => Array
(
)
[_previousValues:protected] => Array
(
)
[_options:protected] => Array
(
)
[_deleted:protected] =>
[_readOnly:protected] =>
[_writePending:protected] =>
[_writeRunning:protected] =>
[_errors:protected] => Array
(
)
[_whenSaveable:protected] => Array
(
)
[_cascadeSave:protected] => Array
(
)
[_behaviors:protected] =>
)
[Forum] => XF\Entity\Forum Object
(
[_uniqueEntityId:XF\Mvc\Entity\Entity:private] => 56
[rootClass:protected] => XF\Entity\Forum
[_useReplaceInto:protected] =>
[_newValues:protected] => Array
(
)
[_values:protected] => Array
(
[node_id] => 2
[discussion_count] => 8891
[message_count] => 64897
[last_post_id] => 101978
[last_post_date] => 1784697453
[last_post_user_id] => 447054
[last_post_username] => tim_b
[last_thread_id] => 25553
[last_thread_title] => Intel Layoff, Data Center Group, 2026-July
[last_thread_prefix_id] => 0
[moderate_threads] => 0
[moderate_replies] => 0
[allow_posting] => 1
[count_messages] => 1
[auto_feature] => 0
[find_new] => 1
[allow_index] => allow
[index_criteria] =>
[field_cache] => []
[prefix_cache] => []
[prompt_cache] => []
[default_prefix_id] => 0
[default_sort_order] => last_post_date
[default_sort_direction] => desc
[list_date_limit_days] => 0
[require_prefix] => 0
[allowed_watch_notifications] => all
[min_tags] => 0
[forum_type_id] => discussion
[type_config] => {"allowed_thread_types":["poll"]}
)
[_relations:protected] => Array
(
[Node] => XF\Entity\Node Object
(
[_uniqueEntityId:XF\Mvc\Entity\Entity:private] => 55
[rootClass:protected] => XF\Entity\Node
[_useReplaceInto:protected] =>
[_newValues:protected] => Array
(
)
[_values:protected] => Array
(
[node_id] => 2
[title] => SemiWiki Main Forum ( Ask the Experts! )
[description] => Post your questions to the experts here!
[node_name] =>
[node_type_id] => Forum
[parent_node_id] => 1
[display_order] => 1
[display_in_list] => 1
[lft] => 2
[rgt] => 3
[depth] => 1
[style_id] => 0
[effective_style_id] => 0
[breadcrumb_data] => {"1":{"node_id":1,"title":"Main Category","depth":0,"lft":1,"node_name":null,"node_type_id":"Category","display_in_list":true}}
[navigation_id] =>
[effective_navigation_id] =>
)
[_relations:protected] => Array
(
)
[_previousValues:protected] => Array
(
)
[_options:protected] => Array
(
)
[_deleted:protected] =>
[_readOnly:protected] =>
[_writePending:protected] =>
[_writeRunning:protected] =>
[_errors:protected] => Array
(
)
[_whenSaveable:protected] => Array
(
)
[_cascadeSave:protected] => Array
(
)
[_behaviors:protected] =>
)
)
[_previousValues:protected] => Array
(
)
[_options:protected] => Array
(
)
[_deleted:protected] =>
[_readOnly:protected] =>
[_writePending:protected] =>
[_writeRunning:protected] =>
[_errors:protected] => Array
(
)
[_whenSaveable:protected] => Array
(
)
[_cascadeSave:protected] => Array
(
)
[_behaviors:protected] =>
)
)
[_previousValues:protected] => Array
(
)
[_options:protected] => Array
(
)
[_deleted:protected] =>
[_readOnly:protected] =>
[_writePending:protected] =>
[_writeRunning:protected] =>
[_errors:protected] => Array
(
)
[_whenSaveable:protected] => Array
(
)
[_cascadeSave:protected] => Array
(
)
[_behaviors:protected] =>
)
[25544] => ThemeHouse\XPress\XF\Entity\Thread Object
(
[_uniqueEntityId:XF\Mvc\Entity\Entity:private] => 69
[rootClass:protected] => XF\Entity\Thread
[_useReplaceInto:protected] =>
[_newValues:protected] => Array
(
)
[_values:protected] => Array
(
[thread_id] => 25544
[node_id] => 2
[title] => Kimi K3 disrupting EDA?
[reply_count] => 18
[view_count] => 2971
[user_id] => 321678
[username] => Y.H
[post_date] => 1784339833
[sticky] => 0
[discussion_state] => visible
[discussion_open] => 1
[discussion_type] => discussion
[first_post_id] => 101835
[first_post_reaction_score] => 1
[first_post_reactions] => {"1":1}
[last_post_date] => 1784680917
[last_post_id] => 101970
[last_post_user_id] => 22796
[last_post_username] => horace
[prefix_id] => 0
[tags] => []
[custom_fields] => []
[vote_score] => 0
[vote_count] => 0
[featured] => 0
[type_data] => []
[index_state] => default
)
[_relations:protected] => Array
(
[User] => ThemeHouse\XLink\XF\Entity\User Object
(
[_uniqueEntityId:XF\Mvc\Entity\Entity:private] => 66
[rootClass:protected] => XF\Entity\User
[_useReplaceInto:protected] =>
[_newValues:protected] => Array
(
)
[_values:protected] => Array
(
[user_id] => 321678
[username] => Y.H
[username_date] => 0
[username_date_visible] => 0
[email] => chenyanhao1@gmail.com
[custom_title] =>
[language_id] => 1
[style_id] => 0
[style_variation] =>
[timezone] => Asia/Hong_Kong
[visible] => 1
[activity_visible] => 1
[user_group_id] => 2
[secondary_group_ids] =>
[display_style_group_id] => 2
[permission_combination_id] => 8
[message_count] => 145
[question_solution_count] => 0
[conversations_unread] => 0
[register_date] => 1663612743
[last_activity] => 1784637566
[last_summary_email_date] => 1784298003
[trophy_points] => 43
[alerts_unviewed] => 0
[alerts_unread] => 0
[avatar_date] => 0
[avatar_width] => 0
[avatar_height] => 0
[avatar_highdpi] => 0
[avatar_optimized] => 0
[gravatar] =>
[user_state] => valid
[security_lock] =>
[is_moderator] => 0
[is_admin] => 0
[is_banned] => 0
[reaction_score] => 109
[warning_points] => 0
[is_staff] => 0
[secret_key] => KNUB0RgWxZ29bDcHEZ5yY2GLDL3jsO7J
[privacy_policy_accepted] => 1663612743
[terms_accepted] => 1663612743
[vote_score] => 0
)
[_relations:protected] => Array
(
)
[_previousValues:protected] => Array
(
)
[_options:protected] => Array
(
)
[_deleted:protected] =>
[_readOnly:protected] =>
[_writePending:protected] =>
[_writeRunning:protected] =>
[_errors:protected] => Array
(
)
[_whenSaveable:protected] => Array
(
)
[_cascadeSave:protected] => Array
(
)
[_behaviors:protected] =>
)
[Forum] => XF\Entity\Forum Object
(
[_uniqueEntityId:XF\Mvc\Entity\Entity:private] => 56
[rootClass:protected] => XF\Entity\Forum
[_useReplaceInto:protected] =>
[_newValues:protected] => Array
(
)
[_values:protected] => Array
(
[node_id] => 2
[discussion_count] => 8891
[message_count] => 64897
[last_post_id] => 101978
[last_post_date] => 1784697453
[last_post_user_id] => 447054
[last_post_username] => tim_b
[last_thread_id] => 25553
[last_thread_title] => Intel Layoff, Data Center Group, 2026-July
[last_thread_prefix_id] => 0
[moderate_threads] => 0
[moderate_replies] => 0
[allow_posting] => 1
[count_messages] => 1
[auto_feature] => 0
[find_new] => 1
[allow_index] => allow
[index_criteria] =>
[field_cache] => []
[prefix_cache] => []
[prompt_cache] => []
[default_prefix_id] => 0
[default_sort_order] => last_post_date
[default_sort_direction] => desc
[list_date_limit_days] => 0
[require_prefix] => 0
[allowed_watch_notifications] => all
[min_tags] => 0
[forum_type_id] => discussion
[type_config] => {"allowed_thread_types":["poll"]}
)
[_relations:protected] => Array
(
[Node] => XF\Entity\Node Object
(
[_uniqueEntityId:XF\Mvc\Entity\Entity:private] => 55
[rootClass:protected] => XF\Entity\Node
[_useReplaceInto:protected] =>
[_newValues:protected] => Array
(
)
[_values:protected] => Array
(
[node_id] => 2
[title] => SemiWiki Main Forum ( Ask the Experts! )
[description] => Post your questions to the experts here!
[node_name] =>
[node_type_id] => Forum
[parent_node_id] => 1
[display_order] => 1
[display_in_list] => 1
[lft] => 2
[rgt] => 3
[depth] => 1
[style_id] => 0
[effective_style_id] => 0
[breadcrumb_data] => {"1":{"node_id":1,"title":"Main Category","depth":0,"lft":1,"node_name":null,"node_type_id":"Category","display_in_list":true}}
[navigation_id] =>
[effective_navigation_id] =>
)
[_relations:protected] => Array
(
)
[_previousValues:protected] => Array
(
)
[_options:protected] => Array
(
)
[_deleted:protected] =>
[_readOnly:protected] =>
[_writePending:protected] =>
[_writeRunning:protected] =>
[_errors:protected] => Array
(
)
[_whenSaveable:protected] => Array
(
)
[_cascadeSave:protected] => Array
(
)
[_behaviors:protected] =>
)
)
[_previousValues:protected] => Array
(
)
[_options:protected] => Array
(
)
[_deleted:protected] =>
[_readOnly:protected] =>
[_writePending:protected] =>
[_writeRunning:protected] =>
[_errors:protected] => Array
(
)
[_whenSaveable:protected] => Array
(
)
[_cascadeSave:protected] => Array
(
)
[_behaviors:protected] =>
)
)
[_previousValues:protected] => Array
(
)
[_options:protected] => Array
(
)
[_deleted:protected] =>
[_readOnly:protected] =>
[_writePending:protected] =>
[_writeRunning:protected] =>
[_errors:protected] => Array
(
)
[_whenSaveable:protected] => Array
(
)
[_cascadeSave:protected] => Array
(
)
[_behaviors:protected] =>
)
[25552] => ThemeHouse\XPress\XF\Entity\Thread Object
(
[_uniqueEntityId:XF\Mvc\Entity\Entity:private] => 73
[rootClass:protected] => XF\Entity\Thread
[_useReplaceInto:protected] =>
[_newValues:protected] => Array
(
)
[_values:protected] => Array
(
[thread_id] => 25552
[node_id] => 2
[title] => TSMC expects 'strong, multi-year' demand for AI chips as it ramps up Arizona investment
[reply_count] => 12
[view_count] => 611
[user_id] => 5
[username] => Daniel Nenni
[post_date] => 1784568989
[sticky] => 0
[discussion_state] => visible
[discussion_open] => 1
[discussion_type] => discussion
[first_post_id] => 101908
[first_post_reaction_score] => 0
[first_post_reactions] => []
[last_post_date] => 1784678653
[last_post_id] => 101968
[last_post_user_id] => 36640
[last_post_username] => soAsian
[prefix_id] => 0
[tags] => []
[custom_fields] => []
[vote_score] => 0
[vote_count] => 0
[featured] => 0
[type_data] => []
[index_state] => default
)
[_relations:protected] => Array
(
[User] => ThemeHouse\XLink\XF\Entity\User Object
(
[_uniqueEntityId:XF\Mvc\Entity\Entity:private] => 54
[rootClass:protected] => XF\Entity\User
[_useReplaceInto:protected] =>
[_newValues:protected] => Array
(
)
[_values:protected] => Array
(
[user_id] => 5
[username] => Daniel Nenni
[username_date] => 0
[username_date_visible] => 0
[email] => dnenni@semiwiki.com
[custom_title] => Founder
[language_id] => 1
[style_id] => 0
[style_variation] =>
[timezone] => America/Los_Angeles
[visible] => 1
[activity_visible] => 1
[user_group_id] => 3
[secondary_group_ids] => 4,5,132
[display_style_group_id] => 3
[permission_combination_id] => 88
[message_count] => 15855
[question_solution_count] => 0
[conversations_unread] => 0
[register_date] => 1280720820
[last_activity] => 1784695634
[last_summary_email_date] => 1605968657
[trophy_points] => 113
[alerts_unviewed] => 103
[alerts_unread] => 103
[avatar_date] => 1663211649
[avatar_width] => 110
[avatar_height] => 107
[avatar_highdpi] => 0
[avatar_optimized] => 0
[gravatar] =>
[user_state] => valid
[security_lock] =>
[is_moderator] => 1
[is_admin] => 1
[is_banned] => 0
[reaction_score] => 9702
[warning_points] => 0
[is_staff] => 1
[secret_key] => 0HwyUVVHCwJotUUVEpvqAclfYJdGNPpw
[privacy_policy_accepted] => 0
[terms_accepted] => 0
[vote_score] => 0
)
[_relations:protected] => Array
(
)
[_previousValues:protected] => Array
(
)
[_options:protected] => Array
(
)
[_deleted:protected] =>
[_readOnly:protected] =>
[_writePending:protected] =>
[_writeRunning:protected] =>
[_errors:protected] => Array
(
)
[_whenSaveable:protected] => Array
(
)
[_cascadeSave:protected] => Array
(
)
[_behaviors:protected] =>
)
[Forum] => XF\Entity\Forum Object
(
[_uniqueEntityId:XF\Mvc\Entity\Entity:private] => 56
[rootClass:protected] => XF\Entity\Forum
[_useReplaceInto:protected] =>
[_newValues:protected] => Array
(
)
[_values:protected] => Array
(
[node_id] => 2
[discussion_count] => 8891
[message_count] => 64897
[last_post_id] => 101978
[last_post_date] => 1784697453
[last_post_user_id] => 447054
[last_post_username] => tim_b
[last_thread_id] => 25553
[last_thread_title] => Intel Layoff, Data Center Group, 2026-July
[last_thread_prefix_id] => 0
[moderate_threads] => 0
[moderate_replies] => 0
[allow_posting] => 1
[count_messages] => 1
[auto_feature] => 0
[find_new] => 1
[allow_index] => allow
[index_criteria] =>
[field_cache] => []
[prefix_cache] => []
[prompt_cache] => []
[default_prefix_id] => 0
[default_sort_order] => last_post_date
[default_sort_direction] => desc
[list_date_limit_days] => 0
[require_prefix] => 0
[allowed_watch_notifications] => all
[min_tags] => 0
[forum_type_id] => discussion
[type_config] => {"allowed_thread_types":["poll"]}
)
[_relations:protected] => Array
(
[Node] => XF\Entity\Node Object
(
[_uniqueEntityId:XF\Mvc\Entity\Entity:private] => 55
[rootClass:protected] => XF\Entity\Node
[_useReplaceInto:protected] =>
[_newValues:protected] => Array
(
)
[_values:protected] => Array
(
[node_id] => 2
[title] => SemiWiki Main Forum ( Ask the Experts! )
[description] => Post your questions to the experts here!
[node_name] =>
[node_type_id] => Forum
[parent_node_id] => 1
[display_order] => 1
[display_in_list] => 1
[lft] => 2
[rgt] => 3
[depth] => 1
[style_id] => 0
[effective_style_id] => 0
[breadcrumb_data] => {"1":{"node_id":1,"title":"Main Category","depth":0,"lft":1,"node_name":null,"node_type_id":"Category","display_in_list":true}}
[navigation_id] =>
[effective_navigation_id] =>
)
[_relations:protected] => Array
(
)
[_previousValues:protected] => Array
(
)
[_options:protected] => Array
(
)
[_deleted:protected] =>
[_readOnly:protected] =>
[_writePending:protected] =>
[_writeRunning:protected] =>
[_errors:protected] => Array
(
)
[_whenSaveable:protected] => Array
(
)
[_cascadeSave:protected] => Array
(
)
[_behaviors:protected] =>
)
)
[_previousValues:protected] => Array
(
)
[_options:protected] => Array
(
)
[_deleted:protected] =>
[_readOnly:protected] =>
[_writePending:protected] =>
[_writeRunning:protected] =>
[_errors:protected] => Array
(
)
[_whenSaveable:protected] => Array
(
)
[_cascadeSave:protected] => Array
(
)
[_behaviors:protected] =>
)
)
[_previousValues:protected] => Array
(
)
[_options:protected] => Array
(
)
[_deleted:protected] =>
[_readOnly:protected] =>
[_writePending:protected] =>
[_writeRunning:protected] =>
[_errors:protected] => Array
(
)
[_whenSaveable:protected] => Array
(
)
[_cascadeSave:protected] => Array
(
)
[_behaviors:protected] =>
)
[25568] => ThemeHouse\XPress\XF\Entity\Thread Object
(
[_uniqueEntityId:XF\Mvc\Entity\Entity:private] => 77
[rootClass:protected] => XF\Entity\Thread
[_useReplaceInto:protected] =>
[_newValues:protected] => Array
(
)
[_values:protected] => Array
(
[thread_id] => 25568
[node_id] => 2
[title] => The $1 Trillion+ Bet Against ASML: Substrate
[reply_count] => 2
[view_count] => 263
[user_id] => 5
[username] => Daniel Nenni
[post_date] => 1784653023
[sticky] => 0
[discussion_state] => visible
[discussion_open] => 1
[discussion_type] => discussion
[first_post_id] => 101952
[first_post_reaction_score] => 3
[first_post_reactions] => {"1":1,"2":1,"3":1}
[last_post_date] => 1784675491
[last_post_id] => 101966
[last_post_user_id] => 138292
[last_post_username] => MKWVentures
[prefix_id] => 0
[tags] => []
[custom_fields] => []
[vote_score] => 0
[vote_count] => 0
[featured] => 0
[type_data] => []
[index_state] => default
)
[_relations:protected] => Array
(
[User] => ThemeHouse\XLink\XF\Entity\User Object
(
[_uniqueEntityId:XF\Mvc\Entity\Entity:private] => 54
[rootClass:protected] => XF\Entity\User
[_useReplaceInto:protected] =>
[_newValues:protected] => Array
(
)
[_values:protected] => Array
(
[user_id] => 5
[username] => Daniel Nenni
[username_date] => 0
[username_date_visible] => 0
[email] => dnenni@semiwiki.com
[custom_title] => Founder
[language_id] => 1
[style_id] => 0
[style_variation] =>
[timezone] => America/Los_Angeles
[visible] => 1
[activity_visible] => 1
[user_group_id] => 3
[secondary_group_ids] => 4,5,132
[display_style_group_id] => 3
[permission_combination_id] => 88
[message_count] => 15855
[question_solution_count] => 0
[conversations_unread] => 0
[register_date] => 1280720820
[last_activity] => 1784695634
[last_summary_email_date] => 1605968657
[trophy_points] => 113
[alerts_unviewed] => 103
[alerts_unread] => 103
[avatar_date] => 1663211649
[avatar_width] => 110
[avatar_height] => 107
[avatar_highdpi] => 0
[avatar_optimized] => 0
[gravatar] =>
[user_state] => valid
[security_lock] =>
[is_moderator] => 1
[is_admin] => 1
[is_banned] => 0
[reaction_score] => 9702
[warning_points] => 0
[is_staff] => 1
[secret_key] => 0HwyUVVHCwJotUUVEpvqAclfYJdGNPpw
[privacy_policy_accepted] => 0
[terms_accepted] => 0
[vote_score] => 0
)
[_relations:protected] => Array
(
)
[_previousValues:protected] => Array
(
)
[_options:protected] => Array
(
)
[_deleted:protected] =>
[_readOnly:protected] =>
[_writePending:protected] =>
[_writeRunning:protected] =>
[_errors:protected] => Array
(
)
[_whenSaveable:protected] => Array
(
)
[_cascadeSave:protected] => Array
(
)
[_behaviors:protected] =>
)
[Forum] => XF\Entity\Forum Object
(
[_uniqueEntityId:XF\Mvc\Entity\Entity:private] => 56
[rootClass:protected] => XF\Entity\Forum
[_useReplaceInto:protected] =>
[_newValues:protected] => Array
(
)
[_values:protected] => Array
(
[node_id] => 2
[discussion_count] => 8891
[message_count] => 64897
[last_post_id] => 101978
[last_post_date] => 1784697453
[last_post_user_id] => 447054
[last_post_username] => tim_b
[last_thread_id] => 25553
[last_thread_title] => Intel Layoff, Data Center Group, 2026-July
[last_thread_prefix_id] => 0
[moderate_threads] => 0
[moderate_replies] => 0
[allow_posting] => 1
[count_messages] => 1
[auto_feature] => 0
[find_new] => 1
[allow_index] => allow
[index_criteria] =>
[field_cache] => []
[prefix_cache] => []
[prompt_cache] => []
[default_prefix_id] => 0
[default_sort_order] => last_post_date
[default_sort_direction] => desc
[list_date_limit_days] => 0
[require_prefix] => 0
[allowed_watch_notifications] => all
[min_tags] => 0
[forum_type_id] => discussion
[type_config] => {"allowed_thread_types":["poll"]}
)
[_relations:protected] => Array
(
[Node] => XF\Entity\Node Object
(
[_uniqueEntityId:XF\Mvc\Entity\Entity:private] => 55
[rootClass:protected] => XF\Entity\Node
[_useReplaceInto:protected] =>
[_newValues:protected] => Array
(
)
[_values:protected] => Array
(
[node_id] => 2
[title] => SemiWiki Main Forum ( Ask the Experts! )
[description] => Post your questions to the experts here!
[node_name] =>
[node_type_id] => Forum
[parent_node_id] => 1
[display_order] => 1
[display_in_list] => 1
[lft] => 2
[rgt] => 3
[depth] => 1
[style_id] => 0
[effective_style_id] => 0
[breadcrumb_data] => {"1":{"node_id":1,"title":"Main Category","depth":0,"lft":1,"node_name":null,"node_type_id":"Category","display_in_list":true}}
[navigation_id] =>
[effective_navigation_id] =>
)
[_relations:protected] => Array
(
)
[_previousValues:protected] => Array
(
)
[_options:protected] => Array
(
)
[_deleted:protected] =>
[_readOnly:protected] =>
[_writePending:protected] =>
[_writeRunning:protected] =>
[_errors:protected] => Array
(
)
[_whenSaveable:protected] => Array
(
)
[_cascadeSave:protected] => Array
(
)
[_behaviors:protected] =>
)
)
[_previousValues:protected] => Array
(
)
[_options:protected] => Array
(
)
[_deleted:protected] =>
[_readOnly:protected] =>
[_writePending:protected] =>
[_writeRunning:protected] =>
[_errors:protected] => Array
(
)
[_whenSaveable:protected] => Array
(
)
[_cascadeSave:protected] => Array
(
)
[_behaviors:protected] =>
)
)
[_previousValues:protected] => Array
(
)
[_options:protected] => Array
(
)
[_deleted:protected] =>
[_readOnly:protected] =>
[_writePending:protected] =>
[_writeRunning:protected] =>
[_errors:protected] => Array
(
)
[_whenSaveable:protected] => Array
(
)
[_cascadeSave:protected] => Array
(
)
[_behaviors:protected] =>
)
[25569] => ThemeHouse\XPress\XF\Entity\Thread Object
(
[_uniqueEntityId:XF\Mvc\Entity\Entity:private] => 81
[rootClass:protected] => XF\Entity\Thread
[_useReplaceInto:protected] =>
[_newValues:protected] => Array
(
)
[_values:protected] => Array
(
[thread_id] => 25569
[node_id] => 2
[title] => 'Give me my money back’: South Korean traders’ leveraged SK Hynix, Samsung bets unravel after sell-off
[reply_count] => 1
[view_count] => 177
[user_id] => 20231
[username] => Barnsley
[post_date] => 1784656100
[sticky] => 0
[discussion_state] => visible
[discussion_open] => 1
[discussion_type] => discussion
[first_post_id] => 101955
[first_post_reaction_score] => 0
[first_post_reactions] => []
[last_post_date] => 1784656180
[last_post_id] => 101956
[last_post_user_id] => 20231
[last_post_username] => Barnsley
[prefix_id] => 0
[tags] => []
[custom_fields] => []
[vote_score] => 0
[vote_count] => 0
[featured] => 0
[type_data] => []
[index_state] => default
)
[_relations:protected] => Array
(
[User] => ThemeHouse\XLink\XF\Entity\User Object
(
[_uniqueEntityId:XF\Mvc\Entity\Entity:private] => 58
[rootClass:protected] => XF\Entity\User
[_useReplaceInto:protected] =>
[_newValues:protected] => Array
(
)
[_values:protected] => Array
(
[user_id] => 20231
[username] => Barnsley
[username_date] => 0
[username_date_visible] => 0
[email] => apickering72@gmail.com
[custom_title] =>
[language_id] => 1
[style_id] => 0
[style_variation] =>
[timezone] => Asia/Irkutsk
[visible] => 1
[activity_visible] => 1
[user_group_id] => 2
[secondary_group_ids] =>
[display_style_group_id] => 2
[permission_combination_id] => 8
[message_count] => 1581
[question_solution_count] => 0
[conversations_unread] => 0
[register_date] => 1429440429
[last_activity] => 1784703415
[last_summary_email_date] => 1653315673
[trophy_points] => 113
[alerts_unviewed] => 14
[alerts_unread] => 14
[avatar_date] => 0
[avatar_width] => 0
[avatar_height] => 0
[avatar_highdpi] => 0
[avatar_optimized] => 0
[gravatar] =>
[user_state] => valid
[security_lock] =>
[is_moderator] => 0
[is_admin] => 0
[is_banned] => 0
[reaction_score] => 835
[warning_points] => 0
[is_staff] => 0
[secret_key] => iAnkz9GTDfivRmH1BOp6OTrgESJR57G8
[privacy_policy_accepted] => 0
[terms_accepted] => 0
[vote_score] => 0
)
[_relations:protected] => Array
(
)
[_previousValues:protected] => Array
(
)
[_options:protected] => Array
(
)
[_deleted:protected] =>
[_readOnly:protected] =>
[_writePending:protected] =>
[_writeRunning:protected] =>
[_errors:protected] => Array
(
)
[_whenSaveable:protected] => Array
(
)
[_cascadeSave:protected] => Array
(
)
[_behaviors:protected] =>
)
[Forum] => XF\Entity\Forum Object
(
[_uniqueEntityId:XF\Mvc\Entity\Entity:private] => 56
[rootClass:protected] => XF\Entity\Forum
[_useReplaceInto:protected] =>
[_newValues:protected] => Array
(
)
[_values:protected] => Array
(
[node_id] => 2
[discussion_count] => 8891
[message_count] => 64897
[last_post_id] => 101978
[last_post_date] => 1784697453
[last_post_user_id] => 447054
[last_post_username] => tim_b
[last_thread_id] => 25553
[last_thread_title] => Intel Layoff, Data Center Group, 2026-July
[last_thread_prefix_id] => 0
[moderate_threads] => 0
[moderate_replies] => 0
[allow_posting] => 1
[count_messages] => 1
[auto_feature] => 0
[find_new] => 1
[allow_index] => allow
[index_criteria] =>
[field_cache] => []
[prefix_cache] => []
[prompt_cache] => []
[default_prefix_id] => 0
[default_sort_order] => last_post_date
[default_sort_direction] => desc
[list_date_limit_days] => 0
[require_prefix] => 0
[allowed_watch_notifications] => all
[min_tags] => 0
[forum_type_id] => discussion
[type_config] => {"allowed_thread_types":["poll"]}
)
[_relations:protected] => Array
(
[Node] => XF\Entity\Node Object
(
[_uniqueEntityId:XF\Mvc\Entity\Entity:private] => 55
[rootClass:protected] => XF\Entity\Node
[_useReplaceInto:protected] =>
[_newValues:protected] => Array
(
)
[_values:protected] => Array
(
[node_id] => 2
[title] => SemiWiki Main Forum ( Ask the Experts! )
[description] => Post your questions to the experts here!
[node_name] =>
[node_type_id] => Forum
[parent_node_id] => 1
[display_order] => 1
[display_in_list] => 1
[lft] => 2
[rgt] => 3
[depth] => 1
[style_id] => 0
[effective_style_id] => 0
[breadcrumb_data] => {"1":{"node_id":1,"title":"Main Category","depth":0,"lft":1,"node_name":null,"node_type_id":"Category","display_in_list":true}}
[navigation_id] =>
[effective_navigation_id] =>
)
[_relations:protected] => Array
(
)
[_previousValues:protected] => Array
(
)
[_options:protected] => Array
(
)
[_deleted:protected] =>
[_readOnly:protected] =>
[_writePending:protected] =>
[_writeRunning:protected] =>
[_errors:protected] => Array
(
)
[_whenSaveable:protected] => Array
(
)
[_cascadeSave:protected] => Array
(
)
[_behaviors:protected] =>
)
)
[_previousValues:protected] => Array
(
)
[_options:protected] => Array
(
)
[_deleted:protected] =>
[_readOnly:protected] =>
[_writePending:protected] =>
[_writeRunning:protected] =>
[_errors:protected] => Array
(
)
[_whenSaveable:protected] => Array
(
)
[_cascadeSave:protected] => Array
(
)
[_behaviors:protected] =>
)
)
[_previousValues:protected] => Array
(
)
[_options:protected] => Array
(
)
[_deleted:protected] =>
[_readOnly:protected] =>
[_writePending:protected] =>
[_writeRunning:protected] =>
[_errors:protected] => Array
(
)
[_whenSaveable:protected] => Array
(
)
[_cascadeSave:protected] => Array
(
)
[_behaviors:protected] =>
)
[25565] => ThemeHouse\XPress\XF\Entity\Thread Object
(
[_uniqueEntityId:XF\Mvc\Entity\Entity:private] => 85
[rootClass:protected] => XF\Entity\Thread
[_useReplaceInto:protected] =>
[_newValues:protected] => Array
(
)
[_values:protected] => Array
(
[thread_id] => 25565
[node_id] => 2
[title] => From "Too Small" to Billion-Dollar Bets: Venture Capital's New Love Affair with EDA
[reply_count] => 1
[view_count] => 281
[user_id] => 5
[username] => Daniel Nenni
[post_date] => 1784632325
[sticky] => 0
[discussion_state] => visible
[discussion_open] => 1
[discussion_type] => discussion
[first_post_id] => 101940
[first_post_reaction_score] => 2
[first_post_reactions] => {"1":2}
[last_post_date] => 1784651933
[last_post_id] => 101949
[last_post_user_id] => 396
[last_post_username] => swka
[prefix_id] => 0
[tags] => []
[custom_fields] => []
[vote_score] => 0
[vote_count] => 0
[featured] => 0
[type_data] => []
[index_state] => default
)
[_relations:protected] => Array
(
[User] => ThemeHouse\XLink\XF\Entity\User Object
(
[_uniqueEntityId:XF\Mvc\Entity\Entity:private] => 54
[rootClass:protected] => XF\Entity\User
[_useReplaceInto:protected] =>
[_newValues:protected] => Array
(
)
[_values:protected] => Array
(
[user_id] => 5
[username] => Daniel Nenni
[username_date] => 0
[username_date_visible] => 0
[email] => dnenni@semiwiki.com
[custom_title] => Founder
[language_id] => 1
[style_id] => 0
[style_variation] =>
[timezone] => America/Los_Angeles
[visible] => 1
[activity_visible] => 1
[user_group_id] => 3
[secondary_group_ids] => 4,5,132
[display_style_group_id] => 3
[permission_combination_id] => 88
[message_count] => 15855
[question_solution_count] => 0
[conversations_unread] => 0
[register_date] => 1280720820
[last_activity] => 1784695634
[last_summary_email_date] => 1605968657
[trophy_points] => 113
[alerts_unviewed] => 103
[alerts_unread] => 103
[avatar_date] => 1663211649
[avatar_width] => 110
[avatar_height] => 107
[avatar_highdpi] => 0
[avatar_optimized] => 0
[gravatar] =>
[user_state] => valid
[security_lock] =>
[is_moderator] => 1
[is_admin] => 1
[is_banned] => 0
[reaction_score] => 9702
[warning_points] => 0
[is_staff] => 1
[secret_key] => 0HwyUVVHCwJotUUVEpvqAclfYJdGNPpw
[privacy_policy_accepted] => 0
[terms_accepted] => 0
[vote_score] => 0
)
[_relations:protected] => Array
(
)
[_previousValues:protected] => Array
(
)
[_options:protected] => Array
(
)
[_deleted:protected] =>
[_readOnly:protected] =>
[_writePending:protected] =>
[_writeRunning:protected] =>
[_errors:protected] => Array
(
)
[_whenSaveable:protected] => Array
(
)
[_cascadeSave:protected] => Array
(
)
[_behaviors:protected] =>
)
[Forum] => XF\Entity\Forum Object
(
[_uniqueEntityId:XF\Mvc\Entity\Entity:private] => 56
[rootClass:protected] => XF\Entity\Forum
[_useReplaceInto:protected] =>
[_newValues:protected] => Array
(
)
[_values:protected] => Array
(
[node_id] => 2
[discussion_count] => 8891
[message_count] => 64897
[last_post_id] => 101978
[last_post_date] => 1784697453
[last_post_user_id] => 447054
[last_post_username] => tim_b
[last_thread_id] => 25553
[last_thread_title] => Intel Layoff, Data Center Group, 2026-July
[last_thread_prefix_id] => 0
[moderate_threads] => 0
[moderate_replies] => 0
[allow_posting] => 1
[count_messages] => 1
[auto_feature] => 0
[find_new] => 1
[allow_index] => allow
[index_criteria] =>
[field_cache] => []
[prefix_cache] => []
[prompt_cache] => []
[default_prefix_id] => 0
[default_sort_order] => last_post_date
[default_sort_direction] => desc
[list_date_limit_days] => 0
[require_prefix] => 0
[allowed_watch_notifications] => all
[min_tags] => 0
[forum_type_id] => discussion
[type_config] => {"allowed_thread_types":["poll"]}
)
[_relations:protected] => Array
(
[Node] => XF\Entity\Node Object
(
[_uniqueEntityId:XF\Mvc\Entity\Entity:private] => 55
[rootClass:protected] => XF\Entity\Node
[_useReplaceInto:protected] =>
[_newValues:protected] => Array
(
)
[_values:protected] => Array
(
[node_id] => 2
[title] => SemiWiki Main Forum ( Ask the Experts! )
[description] => Post your questions to the experts here!
[node_name] =>
[node_type_id] => Forum
[parent_node_id] => 1
[display_order] => 1
[display_in_list] => 1
[lft] => 2
[rgt] => 3
[depth] => 1
[style_id] => 0
[effective_style_id] => 0
[breadcrumb_data] => {"1":{"node_id":1,"title":"Main Category","depth":0,"lft":1,"node_name":null,"node_type_id":"Category","display_in_list":true}}
[navigation_id] =>
[effective_navigation_id] =>
)
[_relations:protected] => Array
(
)
[_previousValues:protected] => Array
(
)
[_options:protected] => Array
(
)
[_deleted:protected] =>
[_readOnly:protected] =>
[_writePending:protected] =>
[_writeRunning:protected] =>
[_errors:protected] => Array
(
)
[_whenSaveable:protected] => Array
(
)
[_cascadeSave:protected] => Array
(
)
[_behaviors:protected] =>
)
)
[_previousValues:protected] => Array
(
)
[_options:protected] => Array
(
)
[_deleted:protected] =>
[_readOnly:protected] =>
[_writePending:protected] =>
[_writeRunning:protected] =>
[_errors:protected] => Array
(
)
[_whenSaveable:protected] => Array
(
)
[_cascadeSave:protected] => Array
(
)
[_behaviors:protected] =>
)
)
[_previousValues:protected] => Array
(
)
[_options:protected] => Array
(
)
[_deleted:protected] =>
[_readOnly:protected] =>
[_writePending:protected] =>
[_writeRunning:protected] =>
[_errors:protected] => Array
(
)
[_whenSaveable:protected] => Array
(
)
[_cascadeSave:protected] => Array
(
)
[_behaviors:protected] =>
)
[25528] => ThemeHouse\XPress\XF\Entity\Thread Object
(
[_uniqueEntityId:XF\Mvc\Entity\Entity:private] => 89
[rootClass:protected] => XF\Entity\Thread
[_useReplaceInto:protected] =>
[_newValues:protected] => Array
(
)
[_values:protected] => Array
(
[thread_id] => 25528
[node_id] => 2
[title] => TSMC 2026-Q2 results
[reply_count] => 6
[view_count] => 1813
[user_id] => 19450
[username] => user nl
[post_date] => 1784181204
[sticky] => 0
[discussion_state] => visible
[discussion_open] => 1
[discussion_type] => discussion
[first_post_id] => 101779
[first_post_reaction_score] => 0
[first_post_reactions] => []
[last_post_date] => 1784650989
[last_post_id] => 101945
[last_post_user_id] => 5
[last_post_username] => Daniel Nenni
[prefix_id] => 0
[tags] => []
[custom_fields] => []
[vote_score] => 0
[vote_count] => 0
[featured] => 0
[type_data] => []
[index_state] => default
)
[_relations:protected] => Array
(
[User] => ThemeHouse\XLink\XF\Entity\User Object
(
[_uniqueEntityId:XF\Mvc\Entity\Entity:private] => 86
[rootClass:protected] => XF\Entity\User
[_useReplaceInto:protected] =>
[_newValues:protected] => Array
(
)
[_values:protected] => Array
(
[user_id] => 19450
[username] => user nl
[username_date] => 0
[username_date_visible] => 0
[email] => mauricehmjanssen@gmail.com
[custom_title] =>
[language_id] => 1
[style_id] => 1
[style_variation] =>
[timezone] => Europe/Amsterdam
[visible] => 1
[activity_visible] => 1
[user_group_id] => 2
[secondary_group_ids] =>
[display_style_group_id] => 2
[permission_combination_id] => 8
[message_count] => 616
[question_solution_count] => 0
[conversations_unread] => 0
[register_date] => 1424291496
[last_activity] => 1784663941
[last_summary_email_date] =>
[trophy_points] => 63
[alerts_unviewed] => 1
[alerts_unread] => 1
[avatar_date] => 1726169369
[avatar_width] => 384
[avatar_height] => 384
[avatar_highdpi] => 1
[avatar_optimized] => 0
[gravatar] =>
[user_state] => valid
[security_lock] =>
[is_moderator] => 0
[is_admin] => 0
[is_banned] => 0
[reaction_score] => 473
[warning_points] => 0
[is_staff] => 0
[secret_key] => V-1lb5_AW69yhzqA5ok9b64U0fMjJiqf
[privacy_policy_accepted] => 0
[terms_accepted] => 0
[vote_score] => 0
)
[_relations:protected] => Array
(
)
[_previousValues:protected] => Array
(
)
[_options:protected] => Array
(
)
[_deleted:protected] =>
[_readOnly:protected] =>
[_writePending:protected] =>
[_writeRunning:protected] =>
[_errors:protected] => Array
(
)
[_whenSaveable:protected] => Array
(
)
[_cascadeSave:protected] => Array
(
)
[_behaviors:protected] =>
)
[Forum] => XF\Entity\Forum Object
(
[_uniqueEntityId:XF\Mvc\Entity\Entity:private] => 56
[rootClass:protected] => XF\Entity\Forum
[_useReplaceInto:protected] =>
[_newValues:protected] => Array
(
)
[_values:protected] => Array
(
[node_id] => 2
[discussion_count] => 8891
[message_count] => 64897
[last_post_id] => 101978
[last_post_date] => 1784697453
[last_post_user_id] => 447054
[last_post_username] => tim_b
[last_thread_id] => 25553
[last_thread_title] => Intel Layoff, Data Center Group, 2026-July
[last_thread_prefix_id] => 0
[moderate_threads] => 0
[moderate_replies] => 0
[allow_posting] => 1
[count_messages] => 1
[auto_feature] => 0
[find_new] => 1
[allow_index] => allow
[index_criteria] =>
[field_cache] => []
[prefix_cache] => []
[prompt_cache] => []
[default_prefix_id] => 0
[default_sort_order] => last_post_date
[default_sort_direction] => desc
[list_date_limit_days] => 0
[require_prefix] => 0
[allowed_watch_notifications] => all
[min_tags] => 0
[forum_type_id] => discussion
[type_config] => {"allowed_thread_types":["poll"]}
)
[_relations:protected] => Array
(
[Node] => XF\Entity\Node Object
(
[_uniqueEntityId:XF\Mvc\Entity\Entity:private] => 55
[rootClass:protected] => XF\Entity\Node
[_useReplaceInto:protected] =>
[_newValues:protected] => Array
(
)
[_values:protected] => Array
(
[node_id] => 2
[title] => SemiWiki Main Forum ( Ask the Experts! )
[description] => Post your questions to the experts here!
[node_name] =>
[node_type_id] => Forum
[parent_node_id] => 1
[display_order] => 1
[display_in_list] => 1
[lft] => 2
[rgt] => 3
[depth] => 1
[style_id] => 0
[effective_style_id] => 0
[breadcrumb_data] => {"1":{"node_id":1,"title":"Main Category","depth":0,"lft":1,"node_name":null,"node_type_id":"Category","display_in_list":true}}
[navigation_id] =>
[effective_navigation_id] =>
)
[_relations:protected] => Array
(
)
[_previousValues:protected] => Array
(
)
[_options:protected] => Array
(
)
[_deleted:protected] =>
[_readOnly:protected] =>
[_writePending:protected] =>
[_writeRunning:protected] =>
[_errors:protected] => Array
(
)
[_whenSaveable:protected] => Array
(
)
[_cascadeSave:protected] => Array
(
)
[_behaviors:protected] =>
)
)
[_previousValues:protected] => Array
(
)
[_options:protected] => Array
(
)
[_deleted:protected] =>
[_readOnly:protected] =>
[_writePending:protected] =>
[_writeRunning:protected] =>
[_errors:protected] => Array
(
)
[_whenSaveable:protected] => Array
(
)
[_cascadeSave:protected] => Array
(
)
[_behaviors:protected] =>
)
)
[_previousValues:protected] => Array
(
)
[_options:protected] => Array
(
)
[_deleted:protected] =>
[_readOnly:protected] =>
[_writePending:protected] =>
[_writeRunning:protected] =>
[_errors:protected] => Array
(
)
[_whenSaveable:protected] => Array
(
)
[_cascadeSave:protected] => Array
(
)
[_behaviors:protected] =>
)
[25566] => ThemeHouse\XPress\XF\Entity\Thread Object
(
[_uniqueEntityId:XF\Mvc\Entity\Entity:private] => 93
[rootClass:protected] => XF\Entity\Thread
[_useReplaceInto:protected] =>
[_newValues:protected] => Array
(
)
[_values:protected] => Array
(
[thread_id] => 25566
[node_id] => 2
[title] => Intel’s foundry lands first named customer under CEO Lip-Bu Tan, as Fortinet signs on for security chips
[reply_count] => 0
[view_count] => 199
[user_id] => 5
[username] => Daniel Nenni
[post_date] => 1784650224
[sticky] => 0
[discussion_state] => visible
[discussion_open] => 1
[discussion_type] => discussion
[first_post_id] => 101944
[first_post_reaction_score] => 0
[first_post_reactions] => []
[last_post_date] => 1784650224
[last_post_id] => 101944
[last_post_user_id] => 5
[last_post_username] => Daniel Nenni
[prefix_id] => 0
[tags] => []
[custom_fields] => []
[vote_score] => 0
[vote_count] => 0
[featured] => 0
[type_data] => []
[index_state] => default
)
[_relations:protected] => Array
(
[User] => ThemeHouse\XLink\XF\Entity\User Object
(
[_uniqueEntityId:XF\Mvc\Entity\Entity:private] => 54
[rootClass:protected] => XF\Entity\User
[_useReplaceInto:protected] =>
[_newValues:protected] => Array
(
)
[_values:protected] => Array
(
[user_id] => 5
[username] => Daniel Nenni
[username_date] => 0
[username_date_visible] => 0
[email] => dnenni@semiwiki.com
[custom_title] => Founder
[language_id] => 1
[style_id] => 0
[style_variation] =>
[timezone] => America/Los_Angeles
[visible] => 1
[activity_visible] => 1
[user_group_id] => 3
[secondary_group_ids] => 4,5,132
[display_style_group_id] => 3
[permission_combination_id] => 88
[message_count] => 15855
[question_solution_count] => 0
[conversations_unread] => 0
[register_date] => 1280720820
[last_activity] => 1784695634
[last_summary_email_date] => 1605968657
[trophy_points] => 113
[alerts_unviewed] => 103
[alerts_unread] => 103
[avatar_date] => 1663211649
[avatar_width] => 110
[avatar_height] => 107
[avatar_highdpi] => 0
[avatar_optimized] => 0
[gravatar] =>
[user_state] => valid
[security_lock] =>
[is_moderator] => 1
[is_admin] => 1
[is_banned] => 0
[reaction_score] => 9702
[warning_points] => 0
[is_staff] => 1
[secret_key] => 0HwyUVVHCwJotUUVEpvqAclfYJdGNPpw
[privacy_policy_accepted] => 0
[terms_accepted] => 0
[vote_score] => 0
)
[_relations:protected] => Array
(
)
[_previousValues:protected] => Array
(
)
[_options:protected] => Array
(
)
[_deleted:protected] =>
[_readOnly:protected] =>
[_writePending:protected] =>
[_writeRunning:protected] =>
[_errors:protected] => Array
(
)
[_whenSaveable:protected] => Array
(
)
[_cascadeSave:protected] => Array
(
)
[_behaviors:protected] =>
)
[Forum] => XF\Entity\Forum Object
(
[_uniqueEntityId:XF\Mvc\Entity\Entity:private] => 56
[rootClass:protected] => XF\Entity\Forum
[_useReplaceInto:protected] =>
[_newValues:protected] => Array
(
)
[_values:protected] => Array
(
[node_id] => 2
[discussion_count] => 8891
[message_count] => 64897
[last_post_id] => 101978
[last_post_date] => 1784697453
[last_post_user_id] => 447054
[last_post_username] => tim_b
[last_thread_id] => 25553
[last_thread_title] => Intel Layoff, Data Center Group, 2026-July
[last_thread_prefix_id] => 0
[moderate_threads] => 0
[moderate_replies] => 0
[allow_posting] => 1
[count_messages] => 1
[auto_feature] => 0
[find_new] => 1
[allow_index] => allow
[index_criteria] =>
[field_cache] => []
[prefix_cache] => []
[prompt_cache] => []
[default_prefix_id] => 0
[default_sort_order] => last_post_date
[default_sort_direction] => desc
[list_date_limit_days] => 0
[require_prefix] => 0
[allowed_watch_notifications] => all
[min_tags] => 0
[forum_type_id] => discussion
[type_config] => {"allowed_thread_types":["poll"]}
)
[_relations:protected] => Array
(
[Node] => XF\Entity\Node Object
(
[_uniqueEntityId:XF\Mvc\Entity\Entity:private] => 55
[rootClass:protected] => XF\Entity\Node
[_useReplaceInto:protected] =>
[_newValues:protected] => Array
(
)
[_values:protected] => Array
(
[node_id] => 2
[title] => SemiWiki Main Forum ( Ask the Experts! )
[description] => Post your questions to the experts here!
[node_name] =>
[node_type_id] => Forum
[parent_node_id] => 1
[display_order] => 1
[display_in_list] => 1
[lft] => 2
[rgt] => 3
[depth] => 1
[style_id] => 0
[effective_style_id] => 0
[breadcrumb_data] => {"1":{"node_id":1,"title":"Main Category","depth":0,"lft":1,"node_name":null,"node_type_id":"Category","display_in_list":true}}
[navigation_id] =>
[effective_navigation_id] =>
)
[_relations:protected] => Array
(
)
[_previousValues:protected] => Array
(
)
[_options:protected] => Array
(
)
[_deleted:protected] =>
[_readOnly:protected] =>
[_writePending:protected] =>
[_writeRunning:protected] =>
[_errors:protected] => Array
(
)
[_whenSaveable:protected] => Array
(
)
[_cascadeSave:protected] => Array
(
)
[_behaviors:protected] =>
)
)
[_previousValues:protected] => Array
(
)
[_options:protected] => Array
(
)
[_deleted:protected] =>
[_readOnly:protected] =>
[_writePending:protected] =>
[_writeRunning:protected] =>
[_errors:protected] => Array
(
)
[_whenSaveable:protected] => Array
(
)
[_cascadeSave:protected] => Array
(
)
[_behaviors:protected] =>
)
)
[_previousValues:protected] => Array
(
)
[_options:protected] => Array
(
)
[_deleted:protected] =>
[_readOnly:protected] =>
[_writePending:protected] =>
[_writeRunning:protected] =>
[_errors:protected] => Array
(
)
[_whenSaveable:protected] => Array
(
)
[_cascadeSave:protected] => Array
(
)
[_behaviors:protected] =>
)
[25546] => ThemeHouse\XPress\XF\Entity\Thread Object
(
[_uniqueEntityId:XF\Mvc\Entity\Entity:private] => 97
[rootClass:protected] => XF\Entity\Thread
[_useReplaceInto:protected] =>
[_newValues:protected] => Array
(
)
[_values:protected] => Array
(
[thread_id] => 25546
[node_id] => 2
[title] => Intel Accelerates Next-Generation Foundry 'Race Race' with 'Hi-NA' EUV Deployment... Samsung Electronics Remains Cautious
[reply_count] => 12
[view_count] => 1389
[user_id] => 446738
[username] => AVAQ Semiconductor
[post_date] => 1784359113
[sticky] => 0
[discussion_state] => visible
[discussion_open] => 1
[discussion_type] => discussion
[first_post_id] => 101839
[first_post_reaction_score] => 0
[first_post_reactions] => []
[last_post_date] => 1784607145
[last_post_id] => 101931
[last_post_user_id] => 5185
[last_post_username] => Fred Chen
[prefix_id] => 0
[tags] => []
[custom_fields] => []
[vote_score] => 0
[vote_count] => 0
[featured] => 0
[type_data] => []
[index_state] => default
)
[_relations:protected] => Array
(
[User] => ThemeHouse\XLink\XF\Entity\User Object
(
[_uniqueEntityId:XF\Mvc\Entity\Entity:private] => 94
[rootClass:protected] => XF\Entity\User
[_useReplaceInto:protected] =>
[_newValues:protected] => Array
(
)
[_values:protected] => Array
(
[user_id] => 446738
[username] => AVAQ Semiconductor
[username_date] => 0
[username_date_visible] => 0
[email] => robertfletcher1582@gmail.com
[custom_title] =>
[language_id] => 1
[style_id] => 0
[style_variation] =>
[timezone] => Asia/Hong_Kong
[visible] => 1
[activity_visible] => 1
[user_group_id] => 2
[secondary_group_ids] =>
[display_style_group_id] => 2
[permission_combination_id] => 8
[message_count] => 22
[question_solution_count] => 0
[conversations_unread] => 0
[register_date] => 1781674746
[last_activity] => 1784619652
[last_summary_email_date] => 1781674746
[trophy_points] => 3
[alerts_unviewed] => 0
[alerts_unread] => 0
[avatar_date] => 1781676427
[avatar_width] => 384
[avatar_height] => 384
[avatar_highdpi] => 1
[avatar_optimized] => 0
[gravatar] =>
[user_state] => valid
[security_lock] =>
[is_moderator] => 0
[is_admin] => 0
[is_banned] => 0
[reaction_score] => 8
[warning_points] => 0
[is_staff] => 0
[secret_key] => DmwEB4PPpwdxZxN1DxjjT9jGMqZv73bK
[privacy_policy_accepted] => 1781674746
[terms_accepted] => 1781674746
[vote_score] => 0
)
[_relations:protected] => Array
(
)
[_previousValues:protected] => Array
(
)
[_options:protected] => Array
(
)
[_deleted:protected] =>
[_readOnly:protected] =>
[_writePending:protected] =>
[_writeRunning:protected] =>
[_errors:protected] => Array
(
)
[_whenSaveable:protected] => Array
(
)
[_cascadeSave:protected] => Array
(
)
[_behaviors:protected] =>
)
[Forum] => XF\Entity\Forum Object
(
[_uniqueEntityId:XF\Mvc\Entity\Entity:private] => 56
[rootClass:protected] => XF\Entity\Forum
[_useReplaceInto:protected] =>
[_newValues:protected] => Array
(
)
[_values:protected] => Array
(
[node_id] => 2
[discussion_count] => 8891
[message_count] => 64897
[last_post_id] => 101978
[last_post_date] => 1784697453
[last_post_user_id] => 447054
[last_post_username] => tim_b
[last_thread_id] => 25553
[last_thread_title] => Intel Layoff, Data Center Group, 2026-July
[last_thread_prefix_id] => 0
[moderate_threads] => 0
[moderate_replies] => 0
[allow_posting] => 1
[count_messages] => 1
[auto_feature] => 0
[find_new] => 1
[allow_index] => allow
[index_criteria] =>
[field_cache] => []
[prefix_cache] => []
[prompt_cache] => []
[default_prefix_id] => 0
[default_sort_order] => last_post_date
[default_sort_direction] => desc
[list_date_limit_days] => 0
[require_prefix] => 0
[allowed_watch_notifications] => all
[min_tags] => 0
[forum_type_id] => discussion
[type_config] => {"allowed_thread_types":["poll"]}
)
[_relations:protected] => Array
(
[Node] => XF\Entity\Node Object
(
[_uniqueEntityId:XF\Mvc\Entity\Entity:private] => 55
[rootClass:protected] => XF\Entity\Node
[_useReplaceInto:protected] =>
[_newValues:protected] => Array
(
)
[_values:protected] => Array
(
[node_id] => 2
[title] => SemiWiki Main Forum ( Ask the Experts! )
[description] => Post your questions to the experts here!
[node_name] =>
[node_type_id] => Forum
[parent_node_id] => 1
[display_order] => 1
[display_in_list] => 1
[lft] => 2
[rgt] => 3
[depth] => 1
[style_id] => 0
[effective_style_id] => 0
[breadcrumb_data] => {"1":{"node_id":1,"title":"Main Category","depth":0,"lft":1,"node_name":null,"node_type_id":"Category","display_in_list":true}}
[navigation_id] =>
[effective_navigation_id] =>
)
[_relations:protected] => Array
(
)
[_previousValues:protected] => Array
(
)
[_options:protected] => Array
(
)
[_deleted:protected] =>
[_readOnly:protected] =>
[_writePending:protected] =>
[_writeRunning:protected] =>
[_errors:protected] => Array
(
)
[_whenSaveable:protected] => Array
(
)
[_cascadeSave:protected] => Array
(
)
[_behaviors:protected] =>
)
)
[_previousValues:protected] => Array
(
)
[_options:protected] => Array
(
)
[_deleted:protected] =>
[_readOnly:protected] =>
[_writePending:protected] =>
[_writeRunning:protected] =>
[_errors:protected] => Array
(
)
[_whenSaveable:protected] => Array
(
)
[_cascadeSave:protected] => Array
(
)
[_behaviors:protected] =>
)
)
[_previousValues:protected] => Array
(
)
[_options:protected] => Array
(
)
[_deleted:protected] =>
[_readOnly:protected] =>
[_writePending:protected] =>
[_writeRunning:protected] =>
[_errors:protected] => Array
(
)
[_whenSaveable:protected] => Array
(
)
[_cascadeSave:protected] => Array
(
)
[_behaviors:protected] =>
)
[25548] => ThemeHouse\XPress\XF\Entity\Thread Object
(
[_uniqueEntityId:XF\Mvc\Entity\Entity:private] => 101
[rootClass:protected] => XF\Entity\Thread
[_useReplaceInto:protected] =>
[_newValues:protected] => Array
(
)
[_values:protected] => Array
(
[thread_id] => 25548
[node_id] => 2
[title] => Foxconn wins estimated $52 billion SpaceX AI server order - Economic Daily
[reply_count] => 8
[view_count] => 732
[user_id] => 36640
[username] => soAsian
[post_date] => 1784512200
[sticky] => 0
[discussion_state] => visible
[discussion_open] => 1
[discussion_type] => discussion
[first_post_id] => 101878
[first_post_reaction_score] => 1
[first_post_reactions] => {"1":1}
[last_post_date] => 1784570992
[last_post_id] => 101913
[last_post_user_id] => 16950
[last_post_username] => benb
[prefix_id] => 0
[tags] => []
[custom_fields] => []
[vote_score] => 0
[vote_count] => 0
[featured] => 0
[type_data] => []
[index_state] => default
)
[_relations:protected] => Array
(
[User] => ThemeHouse\XLink\XF\Entity\User Object
(
[_uniqueEntityId:XF\Mvc\Entity\Entity:private] => 98
[rootClass:protected] => XF\Entity\User
[_useReplaceInto:protected] =>
[_newValues:protected] => Array
(
)
[_values:protected] => Array
(
[user_id] => 36640
[username] => soAsian
[username_date] => 0
[username_date_visible] => 0
[email] => jackmtsai@gmail.com
[custom_title] =>
[language_id] => 1
[style_id] => 0
[style_variation] =>
[timezone] => America/Chicago
[visible] => 1
[activity_visible] => 1
[user_group_id] => 2
[secondary_group_ids] =>
[display_style_group_id] => 2
[permission_combination_id] => 8
[message_count] => 452
[question_solution_count] => 0
[conversations_unread] => 0
[register_date] => 1608139716
[last_activity] => 1784678784
[last_summary_email_date] => 1719670845
[trophy_points] => 63
[alerts_unviewed] => 0
[alerts_unread] => 0
[avatar_date] => 0
[avatar_width] => 0
[avatar_height] => 0
[avatar_highdpi] => 0
[avatar_optimized] => 0
[gravatar] =>
[user_state] => valid
[security_lock] =>
[is_moderator] => 0
[is_admin] => 0
[is_banned] => 0
[reaction_score] => 408
[warning_points] => 0
[is_staff] => 0
[secret_key] => 2oKeCTFkGUpMro5tcmj7WaY9HksB13Kw
[privacy_policy_accepted] => 1608139716
[terms_accepted] => 1608139716
[vote_score] => 0
)
[_relations:protected] => Array
(
)
[_previousValues:protected] => Array
(
)
[_options:protected] => Array
(
)
[_deleted:protected] =>
[_readOnly:protected] =>
[_writePending:protected] =>
[_writeRunning:protected] =>
[_errors:protected] => Array
(
)
[_whenSaveable:protected] => Array
(
)
[_cascadeSave:protected] => Array
(
)
[_behaviors:protected] =>
)
[Forum] => XF\Entity\Forum Object
(
[_uniqueEntityId:XF\Mvc\Entity\Entity:private] => 56
[rootClass:protected] => XF\Entity\Forum
[_useReplaceInto:protected] =>
[_newValues:protected] => Array
(
)
[_values:protected] => Array
(
[node_id] => 2
[discussion_count] => 8891
[message_count] => 64897
[last_post_id] => 101978
[last_post_date] => 1784697453
[last_post_user_id] => 447054
[last_post_username] => tim_b
[last_thread_id] => 25553
[last_thread_title] => Intel Layoff, Data Center Group, 2026-July
[last_thread_prefix_id] => 0
[moderate_threads] => 0
[moderate_replies] => 0
[allow_posting] => 1
[count_messages] => 1
[auto_feature] => 0
[find_new] => 1
[allow_index] => allow
[index_criteria] =>
[field_cache] => []
[prefix_cache] => []
[prompt_cache] => []
[default_prefix_id] => 0
[default_sort_order] => last_post_date
[default_sort_direction] => desc
[list_date_limit_days] => 0
[require_prefix] => 0
[allowed_watch_notifications] => all
[min_tags] => 0
[forum_type_id] => discussion
[type_config] => {"allowed_thread_types":["poll"]}
)
[_relations:protected] => Array
(
[Node] => XF\Entity\Node Object
(
[_uniqueEntityId:XF\Mvc\Entity\Entity:private] => 55
[rootClass:protected] => XF\Entity\Node
[_useReplaceInto:protected] =>
[_newValues:protected] => Array
(
)
[_values:protected] => Array
(
[node_id] => 2
[title] => SemiWiki Main Forum ( Ask the Experts! )
[description] => Post your questions to the experts here!
[node_name] =>
[node_type_id] => Forum
[parent_node_id] => 1
[display_order] => 1
[display_in_list] => 1
[lft] => 2
[rgt] => 3
[depth] => 1
[style_id] => 0
[effective_style_id] => 0
[breadcrumb_data] => {"1":{"node_id":1,"title":"Main Category","depth":0,"lft":1,"node_name":null,"node_type_id":"Category","display_in_list":true}}
[navigation_id] =>
[effective_navigation_id] =>
)
[_relations:protected] => Array
(
)
[_previousValues:protected] => Array
(
)
[_options:protected] => Array
(
)
[_deleted:protected] =>
[_readOnly:protected] =>
[_writePending:protected] =>
[_writeRunning:protected] =>
[_errors:protected] => Array
(
)
[_whenSaveable:protected] => Array
(
)
[_cascadeSave:protected] => Array
(
)
[_behaviors:protected] =>
)
)
[_previousValues:protected] => Array
(
)
[_options:protected] => Array
(
)
[_deleted:protected] =>
[_readOnly:protected] =>
[_writePending:protected] =>
[_writeRunning:protected] =>
[_errors:protected] => Array
(
)
[_whenSaveable:protected] => Array
(
)
[_cascadeSave:protected] => Array
(
)
[_behaviors:protected] =>
)
)
[_previousValues:protected] => Array
(
)
[_options:protected] => Array
(
)
[_deleted:protected] =>
[_readOnly:protected] =>
[_writePending:protected] =>
[_writeRunning:protected] =>
[_errors:protected] => Array
(
)
[_whenSaveable:protected] => Array
(
)
[_cascadeSave:protected] => Array
(
)
[_behaviors:protected] =>
)
[25551] => ThemeHouse\XPress\XF\Entity\Thread Object
(
[_uniqueEntityId:XF\Mvc\Entity\Entity:private] => 105
[rootClass:protected] => XF\Entity\Thread
[_useReplaceInto:protected] =>
[_newValues:protected] => Array
(
)
[_values:protected] => Array
(
[thread_id] => 25551
[node_id] => 2
[title] => What ever happened to IFS Independence?
[reply_count] => 1
[view_count] => 333
[user_id] => 138292
[username] => MKWVentures
[post_date] => 1784568698
[sticky] => 0
[discussion_state] => visible
[discussion_open] => 1
[discussion_type] => discussion
[first_post_id] => 101907
[first_post_reaction_score] => 2
[first_post_reactions] => {"1":2}
[last_post_date] => 1784569517
[last_post_id] => 101910
[last_post_user_id] => 5
[last_post_username] => Daniel Nenni
[prefix_id] => 0
[tags] => []
[custom_fields] => []
[vote_score] => 0
[vote_count] => 0
[featured] => 0
[type_data] => []
[index_state] => default
)
[_relations:protected] => Array
(
[User] => ThemeHouse\XLink\XF\Entity\User Object
(
[_uniqueEntityId:XF\Mvc\Entity\Entity:private] => 102
[rootClass:protected] => XF\Entity\User
[_useReplaceInto:protected] =>
[_newValues:protected] => Array
(
)
[_values:protected] => Array
(
[user_id] => 138292
[username] => MKWVentures
[username_date] => 0
[username_date_visible] => 0
[email] => mark@mkwventures.com
[custom_title] =>
[language_id] => 1
[style_id] => 0
[style_variation] =>
[timezone] => America/Los_Angeles
[visible] => 0
[activity_visible] => 0
[user_group_id] => 4
[secondary_group_ids] =>
[display_style_group_id] => 4
[permission_combination_id] => 92
[message_count] => 1695
[question_solution_count] => 0
[conversations_unread] => 0
[register_date] => 1652456604
[last_activity] => 1784677335
[last_summary_email_date] =>
[trophy_points] => 113
[alerts_unviewed] => 1
[alerts_unread] => 1
[avatar_date] => 0
[avatar_width] => 0
[avatar_height] => 0
[avatar_highdpi] => 0
[avatar_optimized] => 0
[gravatar] =>
[user_state] => valid
[security_lock] =>
[is_moderator] => 0
[is_admin] => 0
[is_banned] => 0
[reaction_score] => 2409
[warning_points] => 0
[is_staff] => 0
[secret_key] => sc_UciGlTphyDi75z_-883RAX5WW8Tvw
[privacy_policy_accepted] => 0
[terms_accepted] => 0
[vote_score] => 0
)
[_relations:protected] => Array
(
)
[_previousValues:protected] => Array
(
)
[_options:protected] => Array
(
)
[_deleted:protected] =>
[_readOnly:protected] =>
[_writePending:protected] =>
[_writeRunning:protected] =>
[_errors:protected] => Array
(
)
[_whenSaveable:protected] => Array
(
)
[_cascadeSave:protected] => Array
(
)
[_behaviors:protected] =>
)
[Forum] => XF\Entity\Forum Object
(
[_uniqueEntityId:XF\Mvc\Entity\Entity:private] => 56
[rootClass:protected] => XF\Entity\Forum
[_useReplaceInto:protected] =>
[_newValues:protected] => Array
(
)
[_values:protected] => Array
(
[node_id] => 2
[discussion_count] => 8891
[message_count] => 64897
[last_post_id] => 101978
[last_post_date] => 1784697453
[last_post_user_id] => 447054
[last_post_username] => tim_b
[last_thread_id] => 25553
[last_thread_title] => Intel Layoff, Data Center Group, 2026-July
[last_thread_prefix_id] => 0
[moderate_threads] => 0
[moderate_replies] => 0
[allow_posting] => 1
[count_messages] => 1
[auto_feature] => 0
[find_new] => 1
[allow_index] => allow
[index_criteria] =>
[field_cache] => []
[prefix_cache] => []
[prompt_cache] => []
[default_prefix_id] => 0
[default_sort_order] => last_post_date
[default_sort_direction] => desc
[list_date_limit_days] => 0
[require_prefix] => 0
[allowed_watch_notifications] => all
[min_tags] => 0
[forum_type_id] => discussion
[type_config] => {"allowed_thread_types":["poll"]}
)
[_relations:protected] => Array
(
[Node] => XF\Entity\Node Object
(
[_uniqueEntityId:XF\Mvc\Entity\Entity:private] => 55
[rootClass:protected] => XF\Entity\Node
[_useReplaceInto:protected] =>
[_newValues:protected] => Array
(
)
[_values:protected] => Array
(
[node_id] => 2
[title] => SemiWiki Main Forum ( Ask the Experts! )
[description] => Post your questions to the experts here!
[node_name] =>
[node_type_id] => Forum
[parent_node_id] => 1
[display_order] => 1
[display_in_list] => 1
[lft] => 2
[rgt] => 3
[depth] => 1
[style_id] => 0
[effective_style_id] => 0
[breadcrumb_data] => {"1":{"node_id":1,"title":"Main Category","depth":0,"lft":1,"node_name":null,"node_type_id":"Category","display_in_list":true}}
[navigation_id] =>
[effective_navigation_id] =>
)
[_relations:protected] => Array
(
)
[_previousValues:protected] => Array
(
)
[_options:protected] => Array
(
)
[_deleted:protected] =>
[_readOnly:protected] =>
[_writePending:protected] =>
[_writeRunning:protected] =>
[_errors:protected] => Array
(
)
[_whenSaveable:protected] => Array
(
)
[_cascadeSave:protected] => Array
(
)
[_behaviors:protected] =>
)
)
[_previousValues:protected] => Array
(
)
[_options:protected] => Array
(
)
[_deleted:protected] =>
[_readOnly:protected] =>
[_writePending:protected] =>
[_writeRunning:protected] =>
[_errors:protected] => Array
(
)
[_whenSaveable:protected] => Array
(
)
[_cascadeSave:protected] => Array
(
)
[_behaviors:protected] =>
)
)
[_previousValues:protected] => Array
(
)
[_options:protected] => Array
(
)
[_deleted:protected] =>
[_readOnly:protected] =>
[_writePending:protected] =>
[_writeRunning:protected] =>
[_errors:protected] => Array
(
)
[_whenSaveable:protected] => Array
(
)
[_cascadeSave:protected] => Array
(
)
[_behaviors:protected] =>
)
[25538] => ThemeHouse\XPress\XF\Entity\Thread Object
(
[_uniqueEntityId:XF\Mvc\Entity\Entity:private] => 109
[rootClass:protected] => XF\Entity\Thread
[_useReplaceInto:protected] =>
[_newValues:protected] => Array
(
)
[_values:protected] => Array
(
[thread_id] => 25538
[node_id] => 2
[title] => Questions on Semiconductor Device Selection and Real-World Application Experience
[reply_count] => 2
[view_count] => 647
[user_id] => 447672
[username] => lro
[post_date] => 1784267045
[sticky] => 0
[discussion_state] => visible
[discussion_open] => 1
[discussion_type] => discussion
[first_post_id] => 101820
[first_post_reaction_score] => 1
[first_post_reactions] => {"1":1}
[last_post_date] => 1784569211
[last_post_id] => 101909
[last_post_user_id] => 1305
[last_post_username] => KevinK
[prefix_id] => 0
[tags] => []
[custom_fields] => []
[vote_score] => 0
[vote_count] => 0
[featured] => 0
[type_data] => []
[index_state] => default
)
[_relations:protected] => Array
(
[User] => ThemeHouse\XLink\XF\Entity\User Object
(
[_uniqueEntityId:XF\Mvc\Entity\Entity:private] => 106
[rootClass:protected] => XF\Entity\User
[_useReplaceInto:protected] =>
[_newValues:protected] => Array
(
)
[_values:protected] => Array
(
[user_id] => 447672
[username] => lro
[username_date] => 0
[username_date_visible] => 0
[email] => thongthiducxphl51837@gmail.com
[custom_title] =>
[language_id] => 1
[style_id] => 0
[style_variation] =>
[timezone] => Asia/Hong_Kong
[visible] => 1
[activity_visible] => 1
[user_group_id] => 2
[secondary_group_ids] =>
[display_style_group_id] => 2
[permission_combination_id] => 8
[message_count] => 2
[question_solution_count] => 0
[conversations_unread] => 0
[register_date] => 1783571008
[last_activity] => 1784519850
[last_summary_email_date] => 1783571008
[trophy_points] => 3
[alerts_unviewed] => 3
[alerts_unread] => 3
[avatar_date] => 0
[avatar_width] => 0
[avatar_height] => 0
[avatar_highdpi] => 0
[avatar_optimized] => 0
[gravatar] =>
[user_state] => valid
[security_lock] =>
[is_moderator] => 0
[is_admin] => 0
[is_banned] => 0
[reaction_score] => 1
[warning_points] => 0
[is_staff] => 0
[secret_key] => N024bDhYJzluuVqpyvKGOJ3vddJs3vE6
[privacy_policy_accepted] => 1783571008
[terms_accepted] => 1783571008
[vote_score] => 0
)
[_relations:protected] => Array
(
)
[_previousValues:protected] => Array
(
)
[_options:protected] => Array
(
)
[_deleted:protected] =>
[_readOnly:protected] =>
[_writePending:protected] =>
[_writeRunning:protected] =>
[_errors:protected] => Array
(
)
[_whenSaveable:protected] => Array
(
)
[_cascadeSave:protected] => Array
(
)
[_behaviors:protected] =>
)
[Forum] => XF\Entity\Forum Object
(
[_uniqueEntityId:XF\Mvc\Entity\Entity:private] => 56
[rootClass:protected] => XF\Entity\Forum
[_useReplaceInto:protected] =>
[_newValues:protected] => Array
(
)
[_values:protected] => Array
(
[node_id] => 2
[discussion_count] => 8891
[message_count] => 64897
[last_post_id] => 101978
[last_post_date] => 1784697453
[last_post_user_id] => 447054
[last_post_username] => tim_b
[last_thread_id] => 25553
[last_thread_title] => Intel Layoff, Data Center Group, 2026-July
[last_thread_prefix_id] => 0
[moderate_threads] => 0
[moderate_replies] => 0
[allow_posting] => 1
[count_messages] => 1
[auto_feature] => 0
[find_new] => 1
[allow_index] => allow
[index_criteria] =>
[field_cache] => []
[prefix_cache] => []
[prompt_cache] => []
[default_prefix_id] => 0
[default_sort_order] => last_post_date
[default_sort_direction] => desc
[list_date_limit_days] => 0
[require_prefix] => 0
[allowed_watch_notifications] => all
[min_tags] => 0
[forum_type_id] => discussion
[type_config] => {"allowed_thread_types":["poll"]}
)
[_relations:protected] => Array
(
[Node] => XF\Entity\Node Object
(
[_uniqueEntityId:XF\Mvc\Entity\Entity:private] => 55
[rootClass:protected] => XF\Entity\Node
[_useReplaceInto:protected] =>
[_newValues:protected] => Array
(
)
[_values:protected] => Array
(
[node_id] => 2
[title] => SemiWiki Main Forum ( Ask the Experts! )
[description] => Post your questions to the experts here!
[node_name] =>
[node_type_id] => Forum
[parent_node_id] => 1
[display_order] => 1
[display_in_list] => 1
[lft] => 2
[rgt] => 3
[depth] => 1
[style_id] => 0
[effective_style_id] => 0
[breadcrumb_data] => {"1":{"node_id":1,"title":"Main Category","depth":0,"lft":1,"node_name":null,"node_type_id":"Category","display_in_list":true}}
[navigation_id] =>
[effective_navigation_id] =>
)
[_relations:protected] => Array
(
)
[_previousValues:protected] => Array
(
)
[_options:protected] => Array
(
)
[_deleted:protected] =>
[_readOnly:protected] =>
[_writePending:protected] =>
[_writeRunning:protected] =>
[_errors:protected] => Array
(
)
[_whenSaveable:protected] => Array
(
)
[_cascadeSave:protected] => Array
(
)
[_behaviors:protected] =>
)
)
[_previousValues:protected] => Array
(
)
[_options:protected] => Array
(
)
[_deleted:protected] =>
[_readOnly:protected] =>
[_writePending:protected] =>
[_writeRunning:protected] =>
[_errors:protected] => Array
(
)
[_whenSaveable:protected] => Array
(
)
[_cascadeSave:protected] => Array
(
)
[_behaviors:protected] =>
)
)
[_previousValues:protected] => Array
(
)
[_options:protected] => Array
(
)
[_deleted:protected] =>
[_readOnly:protected] =>
[_writePending:protected] =>
[_writeRunning:protected] =>
[_errors:protected] => Array
(
)
[_whenSaveable:protected] => Array
(
)
[_cascadeSave:protected] => Array
(
)
[_behaviors:protected] =>
)
[25550] => ThemeHouse\XPress\XF\Entity\Thread Object
(
[_uniqueEntityId:XF\Mvc\Entity\Entity:private] => 113
[rootClass:protected] => XF\Entity\Thread
[_useReplaceInto:protected] =>
[_newValues:protected] => Array
(
)
[_values:protected] => Array
(
[thread_id] => 25550
[node_id] => 2
[title] => [Chip Talk] DRAM Faces Unprecedented Demand... '3D Evolution' Opens a New Chapter
[reply_count] => 1
[view_count] => 230
[user_id] => 5185
[username] => Fred Chen
[post_date] => 1784558494
[sticky] => 0
[discussion_state] => visible
[discussion_open] => 1
[discussion_type] => discussion
[first_post_id] => 101893
[first_post_reaction_score] => 0
[first_post_reactions] => []
[last_post_date] => 1784559187
[last_post_id] => 101895
[last_post_user_id] => 5185
[last_post_username] => Fred Chen
[prefix_id] => 0
[tags] => []
[custom_fields] => []
[vote_score] => 0
[vote_count] => 0
[featured] => 0
[type_data] => []
[index_state] => default
)
[_relations:protected] => Array
(
[User] => ThemeHouse\XLink\XF\Entity\User Object
(
[_uniqueEntityId:XF\Mvc\Entity\Entity:private] => 110
[rootClass:protected] => XF\Entity\User
[_useReplaceInto:protected] =>
[_newValues:protected] => Array
(
)
[_values:protected] => Array
(
[user_id] => 5185
[username] => Fred Chen
[username_date] => 0
[username_date_visible] => 0
[email] => chen.t.fred@gmail.com
[custom_title] =>
[language_id] => 1
[style_id] => 0
[style_variation] =>
[timezone] => America/Los_Angeles
[visible] => 1
[activity_visible] => 1
[user_group_id] => 4
[secondary_group_ids] =>
[display_style_group_id] => 4
[permission_combination_id] => 92
[message_count] => 2767
[question_solution_count] => 0
[conversations_unread] => 0
[register_date] => 1333032401
[last_activity] => 1784698274
[last_summary_email_date] => 1605940563
[trophy_points] => 113
[alerts_unviewed] => 0
[alerts_unread] => 0
[avatar_date] => 0
[avatar_width] => 0
[avatar_height] => 0
[avatar_highdpi] => 0
[avatar_optimized] => 0
[gravatar] =>
[user_state] => valid
[security_lock] =>
[is_moderator] => 0
[is_admin] => 0
[is_banned] => 0
[reaction_score] => 2048
[warning_points] => 0
[is_staff] => 0
[secret_key] => 5m-bZq0HRSi9VA-96QONHJeevdQas5S8
[privacy_policy_accepted] => 0
[terms_accepted] => 0
[vote_score] => 0
)
[_relations:protected] => Array
(
)
[_previousValues:protected] => Array
(
)
[_options:protected] => Array
(
)
[_deleted:protected] =>
[_readOnly:protected] =>
[_writePending:protected] =>
[_writeRunning:protected] =>
[_errors:protected] => Array
(
)
[_whenSaveable:protected] => Array
(
)
[_cascadeSave:protected] => Array
(
)
[_behaviors:protected] =>
)
[Forum] => XF\Entity\Forum Object
(
[_uniqueEntityId:XF\Mvc\Entity\Entity:private] => 56
[rootClass:protected] => XF\Entity\Forum
[_useReplaceInto:protected] =>
[_newValues:protected] => Array
(
)
[_values:protected] => Array
(
[node_id] => 2
[discussion_count] => 8891
[message_count] => 64897
[last_post_id] => 101978
[last_post_date] => 1784697453
[last_post_user_id] => 447054
[last_post_username] => tim_b
[last_thread_id] => 25553
[last_thread_title] => Intel Layoff, Data Center Group, 2026-July
[last_thread_prefix_id] => 0
[moderate_threads] => 0
[moderate_replies] => 0
[allow_posting] => 1
[count_messages] => 1
[auto_feature] => 0
[find_new] => 1
[allow_index] => allow
[index_criteria] =>
[field_cache] => []
[prefix_cache] => []
[prompt_cache] => []
[default_prefix_id] => 0
[default_sort_order] => last_post_date
[default_sort_direction] => desc
[list_date_limit_days] => 0
[require_prefix] => 0
[allowed_watch_notifications] => all
[min_tags] => 0
[forum_type_id] => discussion
[type_config] => {"allowed_thread_types":["poll"]}
)
[_relations:protected] => Array
(
[Node] => XF\Entity\Node Object
(
[_uniqueEntityId:XF\Mvc\Entity\Entity:private] => 55
[rootClass:protected] => XF\Entity\Node
[_useReplaceInto:protected] =>
[_newValues:protected] => Array
(
)
[_values:protected] => Array
(
[node_id] => 2
[title] => SemiWiki Main Forum ( Ask the Experts! )
[description] => Post your questions to the experts here!
[node_name] =>
[node_type_id] => Forum
[parent_node_id] => 1
[display_order] => 1
[display_in_list] => 1
[lft] => 2
[rgt] => 3
[depth] => 1
[style_id] => 0
[effective_style_id] => 0
[breadcrumb_data] => {"1":{"node_id":1,"title":"Main Category","depth":0,"lft":1,"node_name":null,"node_type_id":"Category","display_in_list":true}}
[navigation_id] =>
[effective_navigation_id] =>
)
[_relations:protected] => Array
(
)
[_previousValues:protected] => Array
(
)
[_options:protected] => Array
(
)
[_deleted:protected] =>
[_readOnly:protected] =>
[_writePending:protected] =>
[_writeRunning:protected] =>
[_errors:protected] => Array
(
)
[_whenSaveable:protected] => Array
(
)
[_cascadeSave:protected] => Array
(
)
[_behaviors:protected] =>
)
)
[_previousValues:protected] => Array
(
)
[_options:protected] => Array
(
)
[_deleted:protected] =>
[_readOnly:protected] =>
[_writePending:protected] =>
[_writeRunning:protected] =>
[_errors:protected] => Array
(
)
[_whenSaveable:protected] => Array
(
)
[_cascadeSave:protected] => Array
(
)
[_behaviors:protected] =>
)
)
[_previousValues:protected] => Array
(
)
[_options:protected] => Array
(
)
[_deleted:protected] =>
[_readOnly:protected] =>
[_writePending:protected] =>
[_writeRunning:protected] =>
[_errors:protected] => Array
(
)
[_whenSaveable:protected] => Array
(
)
[_cascadeSave:protected] => Array
(
)
[_behaviors:protected] =>
)
[25547] => ThemeHouse\XPress\XF\Entity\Thread Object
(
[_uniqueEntityId:XF\Mvc\Entity\Entity:private] => 117
[rootClass:protected] => XF\Entity\Thread
[_useReplaceInto:protected] =>
[_newValues:protected] => Array
(
)
[_values:protected] => Array
(
[thread_id] => 25547
[node_id] => 2
[title] => Historical - Export controls on Computers have been around a long time
[reply_count] => 0
[view_count] => 292
[user_id] => 35301
[username] => Xebec
[post_date] => 1784477909
[sticky] => 0
[discussion_state] => visible
[discussion_open] => 1
[discussion_type] => discussion
[first_post_id] => 101869
[first_post_reaction_score] => 2
[first_post_reactions] => {"3":2}
[last_post_date] => 1784477909
[last_post_id] => 101869
[last_post_user_id] => 35301
[last_post_username] => Xebec
[prefix_id] => 0
[tags] => []
[custom_fields] => []
[vote_score] => 0
[vote_count] => 0
[featured] => 0
[type_data] => []
[index_state] => default
)
[_relations:protected] => Array
(
[User] => ThemeHouse\XLink\XF\Entity\User Object
(
[_uniqueEntityId:XF\Mvc\Entity\Entity:private] => 114
[rootClass:protected] => XF\Entity\User
[_useReplaceInto:protected] =>
[_newValues:protected] => Array
(
)
[_values:protected] => Array
(
[user_id] => 35301
[username] => Xebec
[username_date] => 0
[username_date_visible] => 0
[email] => john.heritage@gmail.com
[custom_title] =>
[language_id] => 1
[style_id] => 0
[style_variation] =>
[timezone] => America/New_York
[visible] => 1
[activity_visible] => 1
[user_group_id] => 2
[secondary_group_ids] =>
[display_style_group_id] => 2
[permission_combination_id] => 8
[message_count] => 1893
[question_solution_count] => 0
[conversations_unread] => 0
[register_date] => 1598710106
[last_activity] => 1784683491
[last_summary_email_date] => 1631629203
[trophy_points] => 113
[alerts_unviewed] => 2
[alerts_unread] => 3
[avatar_date] => 1760746858
[avatar_width] => 480
[avatar_height] => 384
[avatar_highdpi] => 1
[avatar_optimized] => 0
[gravatar] =>
[user_state] => valid
[security_lock] =>
[is_moderator] => 0
[is_admin] => 0
[is_banned] => 0
[reaction_score] => 2297
[warning_points] => 0
[is_staff] => 0
[secret_key] => Y7XyJgQMBi7ZiDtuAyqNGDrBQQsi8JB4
[privacy_policy_accepted] => 1598710106
[terms_accepted] => 1598710106
[vote_score] => 0
)
[_relations:protected] => Array
(
)
[_previousValues:protected] => Array
(
)
[_options:protected] => Array
(
)
[_deleted:protected] =>
[_readOnly:protected] =>
[_writePending:protected] =>
[_writeRunning:protected] =>
[_errors:protected] => Array
(
)
[_whenSaveable:protected] => Array
(
)
[_cascadeSave:protected] => Array
(
)
[_behaviors:protected] =>
)
[Forum] => XF\Entity\Forum Object
(
[_uniqueEntityId:XF\Mvc\Entity\Entity:private] => 56
[rootClass:protected] => XF\Entity\Forum
[_useReplaceInto:protected] =>
[_newValues:protected] => Array
(
)
[_values:protected] => Array
(
[node_id] => 2
[discussion_count] => 8891
[message_count] => 64897
[last_post_id] => 101978
[last_post_date] => 1784697453
[last_post_user_id] => 447054
[last_post_username] => tim_b
[last_thread_id] => 25553
[last_thread_title] => Intel Layoff, Data Center Group, 2026-July
[last_thread_prefix_id] => 0
[moderate_threads] => 0
[moderate_replies] => 0
[allow_posting] => 1
[count_messages] => 1
[auto_feature] => 0
[find_new] => 1
[allow_index] => allow
[index_criteria] =>
[field_cache] => []
[prefix_cache] => []
[prompt_cache] => []
[default_prefix_id] => 0
[default_sort_order] => last_post_date
[default_sort_direction] => desc
[list_date_limit_days] => 0
[require_prefix] => 0
[allowed_watch_notifications] => all
[min_tags] => 0
[forum_type_id] => discussion
[type_config] => {"allowed_thread_types":["poll"]}
)
[_relations:protected] => Array
(
[Node] => XF\Entity\Node Object
(
[_uniqueEntityId:XF\Mvc\Entity\Entity:private] => 55
[rootClass:protected] => XF\Entity\Node
[_useReplaceInto:protected] =>
[_newValues:protected] => Array
(
)
[_values:protected] => Array
(
[node_id] => 2
[title] => SemiWiki Main Forum ( Ask the Experts! )
[description] => Post your questions to the experts here!
[node_name] =>
[node_type_id] => Forum
[parent_node_id] => 1
[display_order] => 1
[display_in_list] => 1
[lft] => 2
[rgt] => 3
[depth] => 1
[style_id] => 0
[effective_style_id] => 0
[breadcrumb_data] => {"1":{"node_id":1,"title":"Main Category","depth":0,"lft":1,"node_name":null,"node_type_id":"Category","display_in_list":true}}
[navigation_id] =>
[effective_navigation_id] =>
)
[_relations:protected] => Array
(
)
[_previousValues:protected] => Array
(
)
[_options:protected] => Array
(
)
[_deleted:protected] =>
[_readOnly:protected] =>
[_writePending:protected] =>
[_writeRunning:protected] =>
[_errors:protected] => Array
(
)
[_whenSaveable:protected] => Array
(
)
[_cascadeSave:protected] => Array
(
)
[_behaviors:protected] =>
)
)
[_previousValues:protected] => Array
(
)
[_options:protected] => Array
(
)
[_deleted:protected] =>
[_readOnly:protected] =>
[_writePending:protected] =>
[_writeRunning:protected] =>
[_errors:protected] => Array
(
)
[_whenSaveable:protected] => Array
(
)
[_cascadeSave:protected] => Array
(
)
[_behaviors:protected] =>
)
)
[_previousValues:protected] => Array
(
)
[_options:protected] => Array
(
)
[_deleted:protected] =>
[_readOnly:protected] =>
[_writePending:protected] =>
[_writeRunning:protected] =>
[_errors:protected] => Array
(
)
[_whenSaveable:protected] => Array
(
)
[_cascadeSave:protected] => Array
(
)
[_behaviors:protected] =>
)
[25543] => ThemeHouse\XPress\XF\Entity\Thread Object
(
[_uniqueEntityId:XF\Mvc\Entity\Entity:private] => 121
[rootClass:protected] => XF\Entity\Thread
[_useReplaceInto:protected] =>
[_newValues:protected] => Array
(
)
[_values:protected] => Array
(
[thread_id] => 25543
[node_id] => 2
[title] => 507 Hectares, 12 Fabs: Inside TSMC's Largest Taiwan Expansion Yet
[reply_count] => 8
[view_count] => 1076
[user_id] => 398583
[username] => karin623
[post_date] => 1784289061
[sticky] => 0
[discussion_state] => visible
[discussion_open] => 1
[discussion_type] => discussion
[first_post_id] => 101826
[first_post_reaction_score] => 6
[first_post_reactions] => {"1":6,"4":1}
[last_post_date] => 1784441530
[last_post_id] => 101861
[last_post_user_id] => 36448
[last_post_username] => Paul2
[prefix_id] => 0
[tags] => []
[custom_fields] => []
[vote_score] => 0
[vote_count] => 0
[featured] => 0
[type_data] => []
[index_state] => default
)
[_relations:protected] => Array
(
[User] => ThemeHouse\XLink\XF\Entity\User Object
(
[_uniqueEntityId:XF\Mvc\Entity\Entity:private] => 118
[rootClass:protected] => XF\Entity\User
[_useReplaceInto:protected] =>
[_newValues:protected] => Array
(
)
[_values:protected] => Array
(
[user_id] => 398583
[username] => karin623
[username_date] => 0
[username_date_visible] => 0
[email] => karin623@gmail.com
[custom_title] =>
[language_id] => 1
[style_id] => 0
[style_variation] =>
[timezone] => Asia/Hong_Kong
[visible] => 1
[activity_visible] => 1
[user_group_id] => 2
[secondary_group_ids] =>
[display_style_group_id] => 2
[permission_combination_id] => 8
[message_count] => 55
[question_solution_count] => 0
[conversations_unread] => 0
[register_date] => 1748753435
[last_activity] => 1784289062
[last_summary_email_date] => 1771856462
[trophy_points] => 18
[alerts_unviewed] => 13
[alerts_unread] => 13
[avatar_date] => 0
[avatar_width] => 0
[avatar_height] => 0
[avatar_highdpi] => 0
[avatar_optimized] => 0
[gravatar] =>
[user_state] => valid
[security_lock] =>
[is_moderator] => 0
[is_admin] => 0
[is_banned] => 0
[reaction_score] => 80
[warning_points] => 0
[is_staff] => 0
[secret_key] => PBnrLVmUtkEL7YUKL8Ij_6L3tfKYRzDQ
[privacy_policy_accepted] => 1748753435
[terms_accepted] => 1748753435
[vote_score] => 0
)
[_relations:protected] => Array
(
)
[_previousValues:protected] => Array
(
)
[_options:protected] => Array
(
)
[_deleted:protected] =>
[_readOnly:protected] =>
[_writePending:protected] =>
[_writeRunning:protected] =>
[_errors:protected] => Array
(
)
[_whenSaveable:protected] => Array
(
)
[_cascadeSave:protected] => Array
(
)
[_behaviors:protected] =>
)
[Forum] => XF\Entity\Forum Object
(
[_uniqueEntityId:XF\Mvc\Entity\Entity:private] => 56
[rootClass:protected] => XF\Entity\Forum
[_useReplaceInto:protected] =>
[_newValues:protected] => Array
(
)
[_values:protected] => Array
(
[node_id] => 2
[discussion_count] => 8891
[message_count] => 64897
[last_post_id] => 101978
[last_post_date] => 1784697453
[last_post_user_id] => 447054
[last_post_username] => tim_b
[last_thread_id] => 25553
[last_thread_title] => Intel Layoff, Data Center Group, 2026-July
[last_thread_prefix_id] => 0
[moderate_threads] => 0
[moderate_replies] => 0
[allow_posting] => 1
[count_messages] => 1
[auto_feature] => 0
[find_new] => 1
[allow_index] => allow
[index_criteria] =>
[field_cache] => []
[prefix_cache] => []
[prompt_cache] => []
[default_prefix_id] => 0
[default_sort_order] => last_post_date
[default_sort_direction] => desc
[list_date_limit_days] => 0
[require_prefix] => 0
[allowed_watch_notifications] => all
[min_tags] => 0
[forum_type_id] => discussion
[type_config] => {"allowed_thread_types":["poll"]}
)
[_relations:protected] => Array
(
[Node] => XF\Entity\Node Object
(
[_uniqueEntityId:XF\Mvc\Entity\Entity:private] => 55
[rootClass:protected] => XF\Entity\Node
[_useReplaceInto:protected] =>
[_newValues:protected] => Array
(
)
[_values:protected] => Array
(
[node_id] => 2
[title] => SemiWiki Main Forum ( Ask the Experts! )
[description] => Post your questions to the experts here!
[node_name] =>
[node_type_id] => Forum
[parent_node_id] => 1
[display_order] => 1
[display_in_list] => 1
[lft] => 2
[rgt] => 3
[depth] => 1
[style_id] => 0
[effective_style_id] => 0
[breadcrumb_data] => {"1":{"node_id":1,"title":"Main Category","depth":0,"lft":1,"node_name":null,"node_type_id":"Category","display_in_list":true}}
[navigation_id] =>
[effective_navigation_id] =>
)
[_relations:protected] => Array
(
)
[_previousValues:protected] => Array
(
)
[_options:protected] => Array
(
)
[_deleted:protected] =>
[_readOnly:protected] =>
[_writePending:protected] =>
[_writeRunning:protected] =>
[_errors:protected] => Array
(
)
[_whenSaveable:protected] => Array
(
)
[_cascadeSave:protected] => Array
(
)
[_behaviors:protected] =>
)
)
[_previousValues:protected] => Array
(
)
[_options:protected] => Array
(
)
[_deleted:protected] =>
[_readOnly:protected] =>
[_writePending:protected] =>
[_writeRunning:protected] =>
[_errors:protected] => Array
(
)
[_whenSaveable:protected] => Array
(
)
[_cascadeSave:protected] => Array
(
)
[_behaviors:protected] =>
)
)
[_previousValues:protected] => Array
(
)
[_options:protected] => Array
(
)
[_deleted:protected] =>
[_readOnly:protected] =>
[_writePending:protected] =>
[_writeRunning:protected] =>
[_errors:protected] => Array
(
)
[_whenSaveable:protected] => Array
(
)
[_cascadeSave:protected] => Array
(
)
[_behaviors:protected] =>
)
[25520] => ThemeHouse\XPress\XF\Entity\Thread Object
(
[_uniqueEntityId:XF\Mvc\Entity\Entity:private] => 125
[rootClass:protected] => XF\Entity\Thread
[_useReplaceInto:protected] =>
[_newValues:protected] => Array
(
)
[_values:protected] => Array
(
[thread_id] => 25520
[node_id] => 2
[title] => High NA EUV reaches new readiness milestone with first high-volume Logic product
[reply_count] => 23
[view_count] => 2027
[user_id] => 19450
[username] => user nl
[post_date] => 1784107318
[sticky] => 0
[discussion_state] => visible
[discussion_open] => 1
[discussion_type] => discussion
[first_post_id] => 101730
[first_post_reaction_score] => 4
[first_post_reactions] => {"1":3,"3":1}
[last_post_date] => 1784351289
[last_post_id] => 101838
[last_post_user_id] => 5185
[last_post_username] => Fred Chen
[prefix_id] => 0
[tags] => []
[custom_fields] => []
[vote_score] => 0
[vote_count] => 0
[featured] => 0
[type_data] => []
[index_state] => default
)
[_relations:protected] => Array
(
[User] => ThemeHouse\XLink\XF\Entity\User Object
(
[_uniqueEntityId:XF\Mvc\Entity\Entity:private] => 86
[rootClass:protected] => XF\Entity\User
[_useReplaceInto:protected] =>
[_newValues:protected] => Array
(
)
[_values:protected] => Array
(
[user_id] => 19450
[username] => user nl
[username_date] => 0
[username_date_visible] => 0
[email] => mauricehmjanssen@gmail.com
[custom_title] =>
[language_id] => 1
[style_id] => 1
[style_variation] =>
[timezone] => Europe/Amsterdam
[visible] => 1
[activity_visible] => 1
[user_group_id] => 2
[secondary_group_ids] =>
[display_style_group_id] => 2
[permission_combination_id] => 8
[message_count] => 616
[question_solution_count] => 0
[conversations_unread] => 0
[register_date] => 1424291496
[last_activity] => 1784663941
[last_summary_email_date] =>
[trophy_points] => 63
[alerts_unviewed] => 1
[alerts_unread] => 1
[avatar_date] => 1726169369
[avatar_width] => 384
[avatar_height] => 384
[avatar_highdpi] => 1
[avatar_optimized] => 0
[gravatar] =>
[user_state] => valid
[security_lock] =>
[is_moderator] => 0
[is_admin] => 0
[is_banned] => 0
[reaction_score] => 473
[warning_points] => 0
[is_staff] => 0
[secret_key] => V-1lb5_AW69yhzqA5ok9b64U0fMjJiqf
[privacy_policy_accepted] => 0
[terms_accepted] => 0
[vote_score] => 0
)
[_relations:protected] => Array
(
)
[_previousValues:protected] => Array
(
)
[_options:protected] => Array
(
)
[_deleted:protected] =>
[_readOnly:protected] =>
[_writePending:protected] =>
[_writeRunning:protected] =>
[_errors:protected] => Array
(
)
[_whenSaveable:protected] => Array
(
)
[_cascadeSave:protected] => Array
(
)
[_behaviors:protected] =>
)
[Forum] => XF\Entity\Forum Object
(
[_uniqueEntityId:XF\Mvc\Entity\Entity:private] => 56
[rootClass:protected] => XF\Entity\Forum
[_useReplaceInto:protected] =>
[_newValues:protected] => Array
(
)
[_values:protected] => Array
(
[node_id] => 2
[discussion_count] => 8891
[message_count] => 64897
[last_post_id] => 101978
[last_post_date] => 1784697453
[last_post_user_id] => 447054
[last_post_username] => tim_b
[last_thread_id] => 25553
[last_thread_title] => Intel Layoff, Data Center Group, 2026-July
[last_thread_prefix_id] => 0
[moderate_threads] => 0
[moderate_replies] => 0
[allow_posting] => 1
[count_messages] => 1
[auto_feature] => 0
[find_new] => 1
[allow_index] => allow
[index_criteria] =>
[field_cache] => []
[prefix_cache] => []
[prompt_cache] => []
[default_prefix_id] => 0
[default_sort_order] => last_post_date
[default_sort_direction] => desc
[list_date_limit_days] => 0
[require_prefix] => 0
[allowed_watch_notifications] => all
[min_tags] => 0
[forum_type_id] => discussion
[type_config] => {"allowed_thread_types":["poll"]}
)
[_relations:protected] => Array
(
[Node] => XF\Entity\Node Object
(
[_uniqueEntityId:XF\Mvc\Entity\Entity:private] => 55
[rootClass:protected] => XF\Entity\Node
[_useReplaceInto:protected] =>
[_newValues:protected] => Array
(
)
[_values:protected] => Array
(
[node_id] => 2
[title] => SemiWiki Main Forum ( Ask the Experts! )
[description] => Post your questions to the experts here!
[node_name] =>
[node_type_id] => Forum
[parent_node_id] => 1
[display_order] => 1
[display_in_list] => 1
[lft] => 2
[rgt] => 3
[depth] => 1
[style_id] => 0
[effective_style_id] => 0
[breadcrumb_data] => {"1":{"node_id":1,"title":"Main Category","depth":0,"lft":1,"node_name":null,"node_type_id":"Category","display_in_list":true}}
[navigation_id] =>
[effective_navigation_id] =>
)
[_relations:protected] => Array
(
)
[_previousValues:protected] => Array
(
)
[_options:protected] => Array
(
)
[_deleted:protected] =>
[_readOnly:protected] =>
[_writePending:protected] =>
[_writeRunning:protected] =>
[_errors:protected] => Array
(
)
[_whenSaveable:protected] => Array
(
)
[_cascadeSave:protected] => Array
(
)
[_behaviors:protected] =>
)
)
[_previousValues:protected] => Array
(
)
[_options:protected] => Array
(
)
[_deleted:protected] =>
[_readOnly:protected] =>
[_writePending:protected] =>
[_writeRunning:protected] =>
[_errors:protected] => Array
(
)
[_whenSaveable:protected] => Array
(
)
[_cascadeSave:protected] => Array
(
)
[_behaviors:protected] =>
)
)
[_previousValues:protected] => Array
(
)
[_options:protected] => Array
(
)
[_deleted:protected] =>
[_readOnly:protected] =>
[_writePending:protected] =>
[_writeRunning:protected] =>
[_errors:protected] => Array
(
)
[_whenSaveable:protected] => Array
(
)
[_cascadeSave:protected] => Array
(
)
[_behaviors:protected] =>
)
[25476] => ThemeHouse\XPress\XF\Entity\Thread Object
(
[_uniqueEntityId:XF\Mvc\Entity\Entity:private] => 129
[rootClass:protected] => XF\Entity\Thread
[_useReplaceInto:protected] =>
[_newValues:protected] => Array
(
)
[_values:protected] => Array
(
[thread_id] => 25476
[node_id] => 2
[title] => Socionext plans to tape out a compute chiplet on TSMC A14 in 2026-Sep
[reply_count] => 1
[view_count] => 749
[user_id] => 90385
[username] => NY_Sam2
[post_date] => 1783534502
[sticky] => 0
[discussion_state] => visible
[discussion_open] => 1
[discussion_type] => discussion
[first_post_id] => 101556
[first_post_reaction_score] => 1
[first_post_reactions] => {"1":1}
[last_post_date] => 1784320185
[last_post_id] => 101833
[last_post_user_id] => 90385
[last_post_username] => NY_Sam2
[prefix_id] => 0
[tags] => []
[custom_fields] => []
[vote_score] => 0
[vote_count] => 0
[featured] => 0
[type_data] => []
[index_state] => default
)
[_relations:protected] => Array
(
[User] => ThemeHouse\XLink\XF\Entity\User Object
(
[_uniqueEntityId:XF\Mvc\Entity\Entity:private] => 126
[rootClass:protected] => XF\Entity\User
[_useReplaceInto:protected] =>
[_newValues:protected] => Array
(
)
[_values:protected] => Array
(
[user_id] => 90385
[username] => NY_Sam2
[username_date] => 0
[username_date_visible] => 0
[email] => petekennedy1989@gmail.com
[custom_title] =>
[language_id] => 1
[style_id] => 0
[style_variation] =>
[timezone] => America/New_York
[visible] => 1
[activity_visible] => 1
[user_group_id] => 2
[secondary_group_ids] =>
[display_style_group_id] => 2
[permission_combination_id] => 8
[message_count] => 64
[question_solution_count] => 0
[conversations_unread] => 0
[register_date] => 1642621712
[last_activity] => 1784580877
[last_summary_email_date] => 1781274002
[trophy_points] => 18
[alerts_unviewed] => 20
[alerts_unread] => 20
[avatar_date] => 0
[avatar_width] => 0
[avatar_height] => 0
[avatar_highdpi] => 0
[avatar_optimized] => 0
[gravatar] =>
[user_state] => valid
[security_lock] =>
[is_moderator] => 0
[is_admin] => 0
[is_banned] => 0
[reaction_score] => 95
[warning_points] => 0
[is_staff] => 0
[secret_key] => egi-LmWHpsbQRZ7Y0Lk56hMyhUsrDhDE
[privacy_policy_accepted] => 1642621712
[terms_accepted] => 1642621712
[vote_score] => 0
)
[_relations:protected] => Array
(
)
[_previousValues:protected] => Array
(
)
[_options:protected] => Array
(
)
[_deleted:protected] =>
[_readOnly:protected] =>
[_writePending:protected] =>
[_writeRunning:protected] =>
[_errors:protected] => Array
(
)
[_whenSaveable:protected] => Array
(
)
[_cascadeSave:protected] => Array
(
)
[_behaviors:protected] =>
)
[Forum] => XF\Entity\Forum Object
(
[_uniqueEntityId:XF\Mvc\Entity\Entity:private] => 56
[rootClass:protected] => XF\Entity\Forum
[_useReplaceInto:protected] =>
[_newValues:protected] => Array
(
)
[_values:protected] => Array
(
[node_id] => 2
[discussion_count] => 8891
[message_count] => 64897
[last_post_id] => 101978
[last_post_date] => 1784697453
[last_post_user_id] => 447054
[last_post_username] => tim_b
[last_thread_id] => 25553
[last_thread_title] => Intel Layoff, Data Center Group, 2026-July
[last_thread_prefix_id] => 0
[moderate_threads] => 0
[moderate_replies] => 0
[allow_posting] => 1
[count_messages] => 1
[auto_feature] => 0
[find_new] => 1
[allow_index] => allow
[index_criteria] =>
[field_cache] => []
[prefix_cache] => []
[prompt_cache] => []
[default_prefix_id] => 0
[default_sort_order] => last_post_date
[default_sort_direction] => desc
[list_date_limit_days] => 0
[require_prefix] => 0
[allowed_watch_notifications] => all
[min_tags] => 0
[forum_type_id] => discussion
[type_config] => {"allowed_thread_types":["poll"]}
)
[_relations:protected] => Array
(
[Node] => XF\Entity\Node Object
(
[_uniqueEntityId:XF\Mvc\Entity\Entity:private] => 55
[rootClass:protected] => XF\Entity\Node
[_useReplaceInto:protected] =>
[_newValues:protected] => Array
(
)
[_values:protected] => Array
(
[node_id] => 2
[title] => SemiWiki Main Forum ( Ask the Experts! )
[description] => Post your questions to the experts here!
[node_name] =>
[node_type_id] => Forum
[parent_node_id] => 1
[display_order] => 1
[display_in_list] => 1
[lft] => 2
[rgt] => 3
[depth] => 1
[style_id] => 0
[effective_style_id] => 0
[breadcrumb_data] => {"1":{"node_id":1,"title":"Main Category","depth":0,"lft":1,"node_name":null,"node_type_id":"Category","display_in_list":true}}
[navigation_id] =>
[effective_navigation_id] =>
)
[_relations:protected] => Array
(
)
[_previousValues:protected] => Array
(
)
[_options:protected] => Array
(
)
[_deleted:protected] =>
[_readOnly:protected] =>
[_writePending:protected] =>
[_writeRunning:protected] =>
[_errors:protected] => Array
(
)
[_whenSaveable:protected] => Array
(
)
[_cascadeSave:protected] => Array
(
)
[_behaviors:protected] =>
)
)
[_previousValues:protected] => Array
(
)
[_options:protected] => Array
(
)
[_deleted:protected] =>
[_readOnly:protected] =>
[_writePending:protected] =>
[_writeRunning:protected] =>
[_errors:protected] => Array
(
)
[_whenSaveable:protected] => Array
(
)
[_cascadeSave:protected] => Array
(
)
[_behaviors:protected] =>
)
)
[_previousValues:protected] => Array
(
)
[_options:protected] => Array
(
)
[_deleted:protected] =>
[_readOnly:protected] =>
[_writePending:protected] =>
[_writeRunning:protected] =>
[_errors:protected] => Array
(
)
[_whenSaveable:protected] => Array
(
)
[_cascadeSave:protected] => Array
(
)
[_behaviors:protected] =>
)
[25524] => ThemeHouse\XPress\XF\Entity\Thread Object
(
[_uniqueEntityId:XF\Mvc\Entity\Entity:private] => 133
[rootClass:protected] => XF\Entity\Thread
[_useReplaceInto:protected] =>
[_newValues:protected] => Array
(
)
[_values:protected] => Array
(
[thread_id] => 25524
[node_id] => 2
[title] => Former Intel CEO on What Went Wrong, What's Next + Lovable CEO on the Real Promise of Vibe Coding
[reply_count] => 17
[view_count] => 1533
[user_id] => 5
[username] => Daniel Nenni
[post_date] => 1784158589
[sticky] => 0
[discussion_state] => visible
[discussion_open] => 1
[discussion_type] => discussion
[first_post_id] => 101765
[first_post_reaction_score] => 1
[first_post_reactions] => {"1":1}
[last_post_date] => 1784316315
[last_post_id] => 101831
[last_post_user_id] => 19450
[last_post_username] => user nl
[prefix_id] => 0
[tags] => []
[custom_fields] => []
[vote_score] => 0
[vote_count] => 0
[featured] => 0
[type_data] => []
[index_state] => default
)
[_relations:protected] => Array
(
[User] => ThemeHouse\XLink\XF\Entity\User Object
(
[_uniqueEntityId:XF\Mvc\Entity\Entity:private] => 54
[rootClass:protected] => XF\Entity\User
[_useReplaceInto:protected] =>
[_newValues:protected] => Array
(
)
[_values:protected] => Array
(
[user_id] => 5
[username] => Daniel Nenni
[username_date] => 0
[username_date_visible] => 0
[email] => dnenni@semiwiki.com
[custom_title] => Founder
[language_id] => 1
[style_id] => 0
[style_variation] =>
[timezone] => America/Los_Angeles
[visible] => 1
[activity_visible] => 1
[user_group_id] => 3
[secondary_group_ids] => 4,5,132
[display_style_group_id] => 3
[permission_combination_id] => 88
[message_count] => 15855
[question_solution_count] => 0
[conversations_unread] => 0
[register_date] => 1280720820
[last_activity] => 1784695634
[last_summary_email_date] => 1605968657
[trophy_points] => 113
[alerts_unviewed] => 103
[alerts_unread] => 103
[avatar_date] => 1663211649
[avatar_width] => 110
[avatar_height] => 107
[avatar_highdpi] => 0
[avatar_optimized] => 0
[gravatar] =>
[user_state] => valid
[security_lock] =>
[is_moderator] => 1
[is_admin] => 1
[is_banned] => 0
[reaction_score] => 9702
[warning_points] => 0
[is_staff] => 1
[secret_key] => 0HwyUVVHCwJotUUVEpvqAclfYJdGNPpw
[privacy_policy_accepted] => 0
[terms_accepted] => 0
[vote_score] => 0
)
[_relations:protected] => Array
(
)
[_previousValues:protected] => Array
(
)
[_options:protected] => Array
(
)
[_deleted:protected] =>
[_readOnly:protected] =>
[_writePending:protected] =>
[_writeRunning:protected] =>
[_errors:protected] => Array
(
)
[_whenSaveable:protected] => Array
(
)
[_cascadeSave:protected] => Array
(
)
[_behaviors:protected] =>
)
[Forum] => XF\Entity\Forum Object
(
[_uniqueEntityId:XF\Mvc\Entity\Entity:private] => 56
[rootClass:protected] => XF\Entity\Forum
[_useReplaceInto:protected] =>
[_newValues:protected] => Array
(
)
[_values:protected] => Array
(
[node_id] => 2
[discussion_count] => 8891
[message_count] => 64897
[last_post_id] => 101978
[last_post_date] => 1784697453
[last_post_user_id] => 447054
[last_post_username] => tim_b
[last_thread_id] => 25553
[last_thread_title] => Intel Layoff, Data Center Group, 2026-July
[last_thread_prefix_id] => 0
[moderate_threads] => 0
[moderate_replies] => 0
[allow_posting] => 1
[count_messages] => 1
[auto_feature] => 0
[find_new] => 1
[allow_index] => allow
[index_criteria] =>
[field_cache] => []
[prefix_cache] => []
[prompt_cache] => []
[default_prefix_id] => 0
[default_sort_order] => last_post_date
[default_sort_direction] => desc
[list_date_limit_days] => 0
[require_prefix] => 0
[allowed_watch_notifications] => all
[min_tags] => 0
[forum_type_id] => discussion
[type_config] => {"allowed_thread_types":["poll"]}
)
[_relations:protected] => Array
(
[Node] => XF\Entity\Node Object
(
[_uniqueEntityId:XF\Mvc\Entity\Entity:private] => 55
[rootClass:protected] => XF\Entity\Node
[_useReplaceInto:protected] =>
[_newValues:protected] => Array
(
)
[_values:protected] => Array
(
[node_id] => 2
[title] => SemiWiki Main Forum ( Ask the Experts! )
[description] => Post your questions to the experts here!
[node_name] =>
[node_type_id] => Forum
[parent_node_id] => 1
[display_order] => 1
[display_in_list] => 1
[lft] => 2
[rgt] => 3
[depth] => 1
[style_id] => 0
[effective_style_id] => 0
[breadcrumb_data] => {"1":{"node_id":1,"title":"Main Category","depth":0,"lft":1,"node_name":null,"node_type_id":"Category","display_in_list":true}}
[navigation_id] =>
[effective_navigation_id] =>
)
[_relations:protected] => Array
(
)
[_previousValues:protected] => Array
(
)
[_options:protected] => Array
(
)
[_deleted:protected] =>
[_readOnly:protected] =>
[_writePending:protected] =>
[_writeRunning:protected] =>
[_errors:protected] => Array
(
)
[_whenSaveable:protected] => Array
(
)
[_cascadeSave:protected] => Array
(
)
[_behaviors:protected] =>
)
)
[_previousValues:protected] => Array
(
)
[_options:protected] => Array
(
)
[_deleted:protected] =>
[_readOnly:protected] =>
[_writePending:protected] =>
[_writeRunning:protected] =>
[_errors:protected] => Array
(
)
[_whenSaveable:protected] => Array
(
)
[_cascadeSave:protected] => Array
(
)
[_behaviors:protected] =>
)
)
[_previousValues:protected] => Array
(
)
[_options:protected] => Array
(
)
[_deleted:protected] =>
[_readOnly:protected] =>
[_writePending:protected] =>
[_writeRunning:protected] =>
[_errors:protected] => Array
(
)
[_whenSaveable:protected] => Array
(
)
[_cascadeSave:protected] => Array
(
)
[_behaviors:protected] =>
)
)
[populated:protected] => 1
)
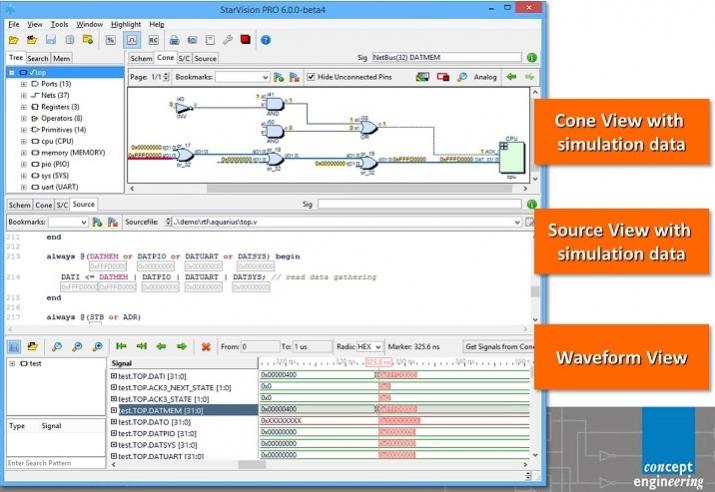


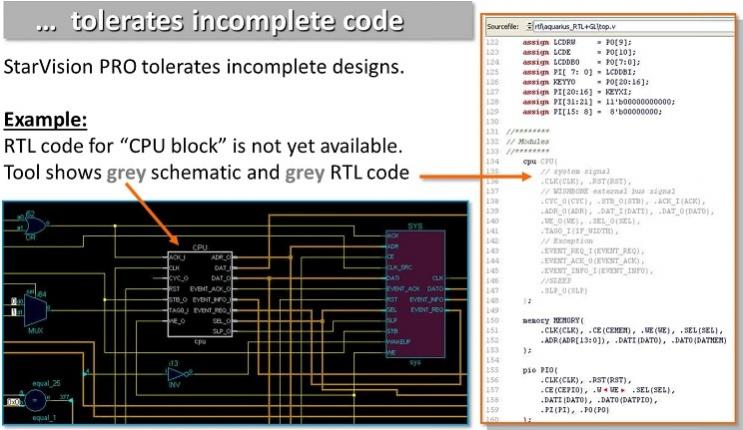
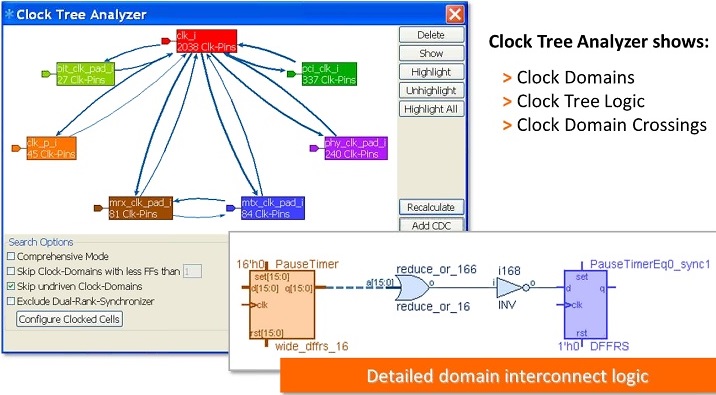
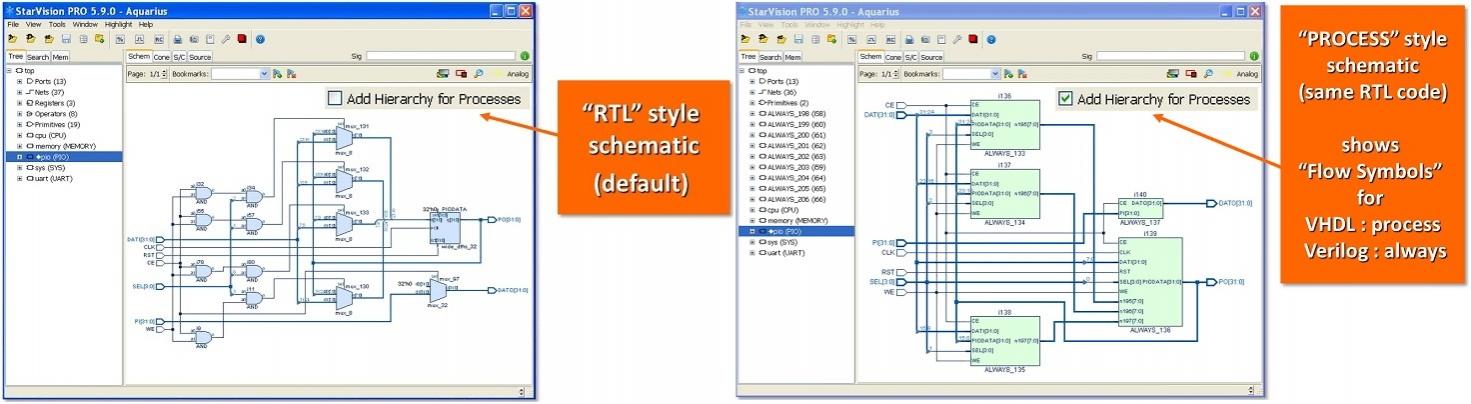
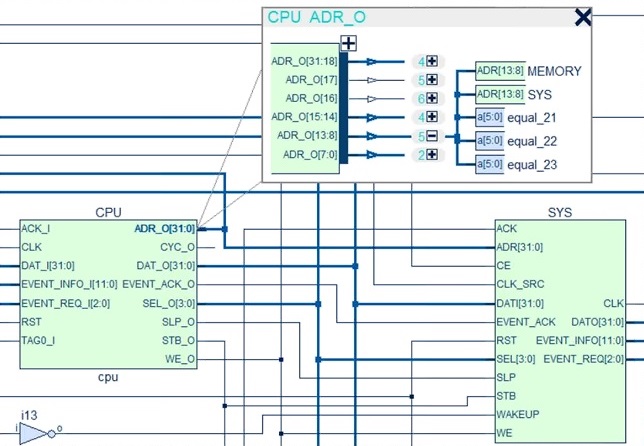
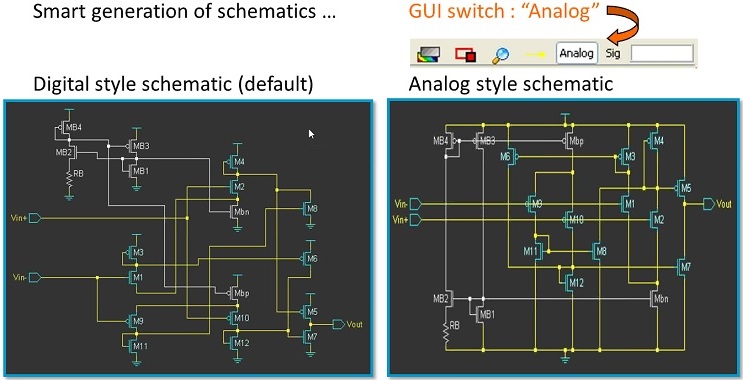


Comments
There are no comments yet.
You must register or log in to view/post comments.