
Recently Seeking Alpha published an article “Taiwan Semiconductor Manufacturing Company Losing Its Process Leadership To Intel” and Dan Nenni (SemiWiki founder) asked me to take a look at the article and do my own analysis. This is a subject I have followed and published on for many years.
Before I dig into specific process density comparisons between companies, I wanted to clear up some misunderstandings about Gate All Around (GAA) and Complimentary FET (CFET) in the Seeking Alpha article.
Gate All Around (GAA)
Just as the industry switched from planar transistors to FinFETs, it has been known for some time that a transition from FinFETs to something else will eventually be required to enable continued shrinks. A FinFET has a gate on three sides providing improved electrostatic control of the devices channel compared to a planar transistor that has a gate on only one side. Improved electrostatic control provides lower channel leakage and enables shorter gate lengths. FinFETs also provide a 3D transistor structure with more effective channel width per unit area than planar transistors therefore providing better drive current per unit area.
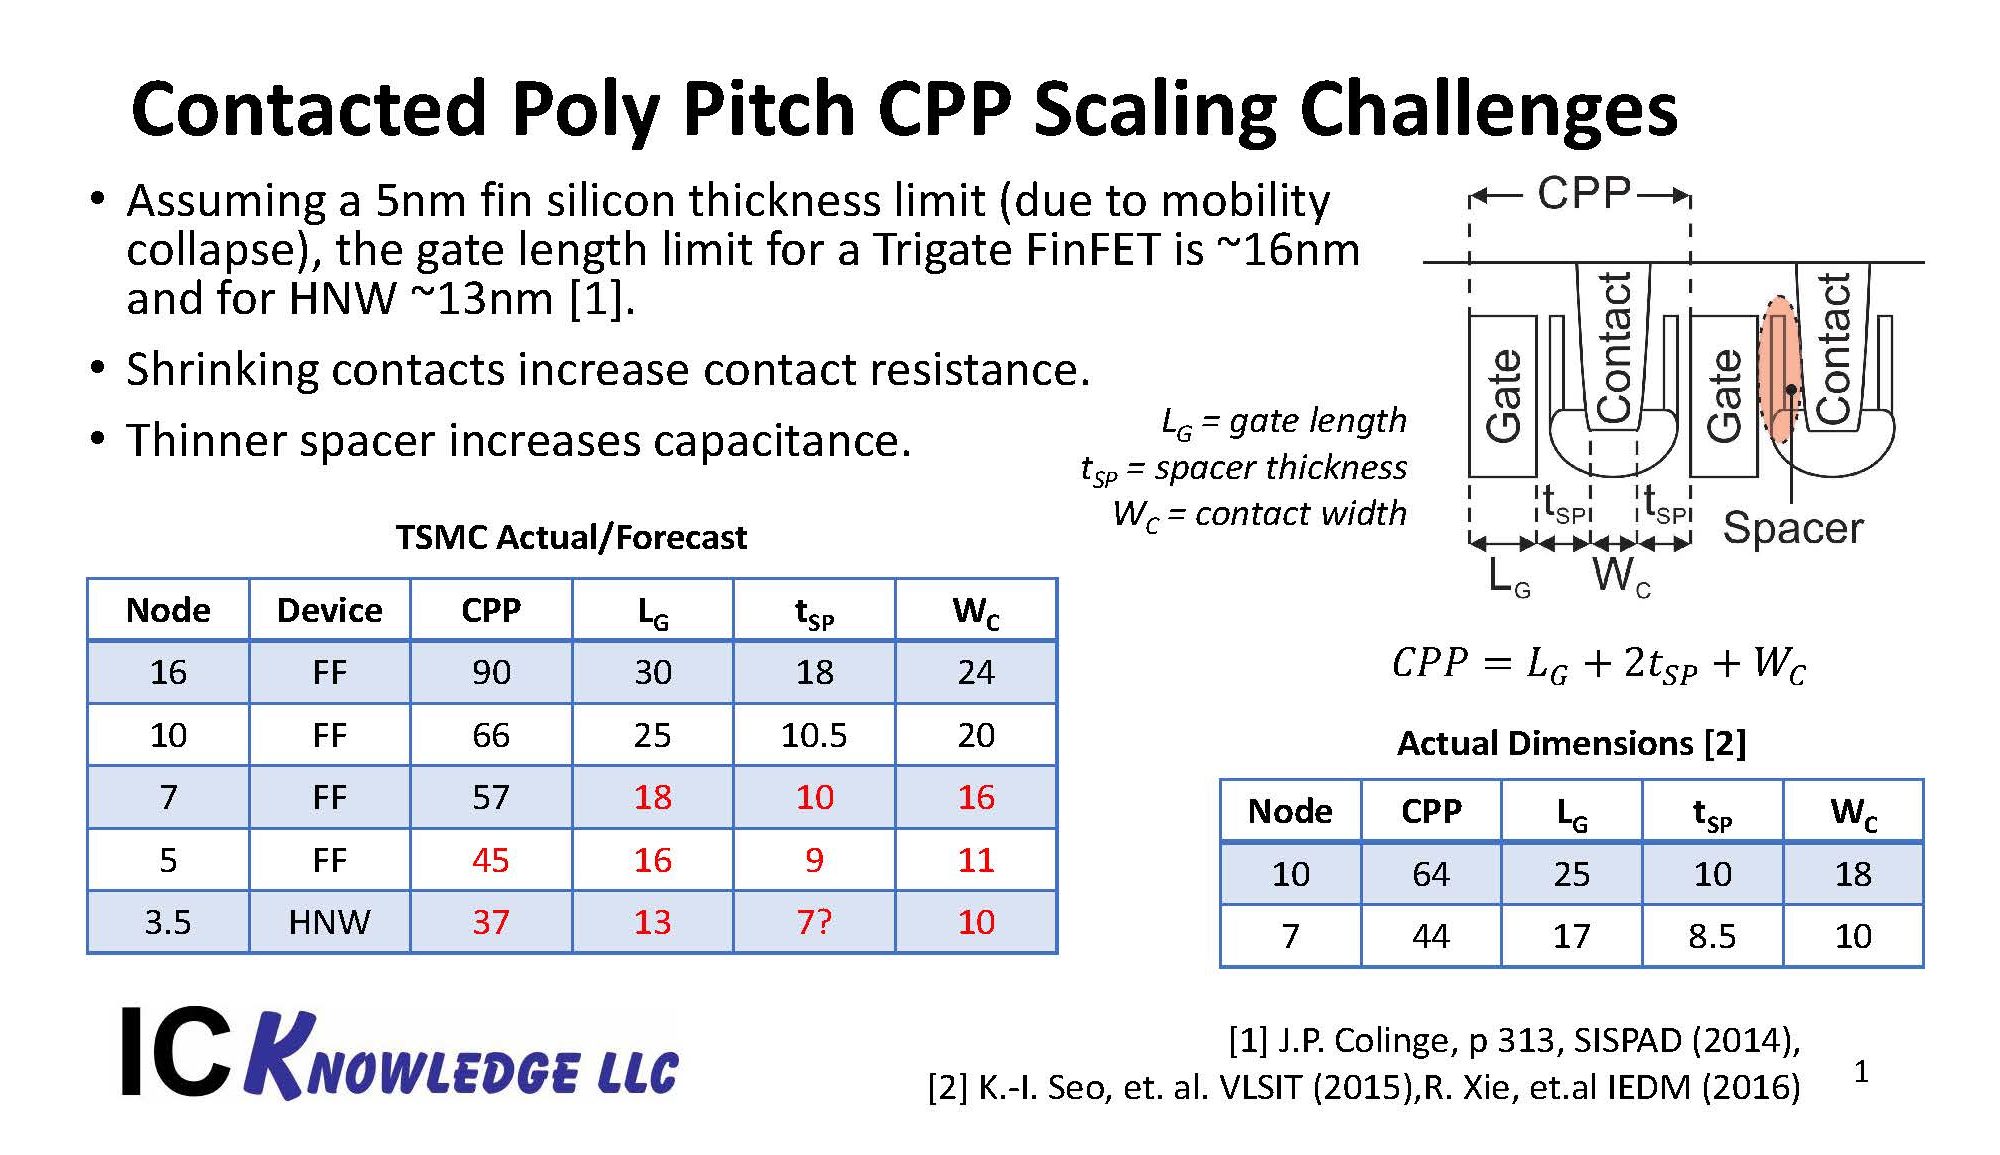
It is well established that a type of GAA device – horizontal nanosheets (HNS) are the next step after FinFETs. If the nanosheets are very narrow you get nanowires and significantly improved electrostatics. The approximate limit of gate length for a FinFET is 16nm and for a horizontal nano wire (HNW) is 13nm, see figure 1. Shorter gate lengths are a component of shrinking Contacted Poly Pitch (CPP) and driving greater density.

Figure 1. Contacted Poly Pitch CPP Scaling Challenges.
Please note that in Figure 1, the 3.5nm TSMC HNW is just an example of how dimensions might stack up, we know they are doing FinFETs at 3nm.
The problem with a HNW is that the effective channel width is lower than it is for a FinFET in the same area. The development of HNS overcame this problem and can offer up to 1.26x the drive current of FinFETs in the same area although they sacrifice some electrostatic control to do it, see figure 2.

Figure 2. Logic Gate All Around (GAA).
Another advantage of HNS is the process is essentially a FinFET process with a few changes. This is not meant to understate the difficulty of the transition, the HNS specific steps are critical steps and the geometry of a HNS will make creating multiple threshold voltages difficult, but it is a logical evolution of FinFET technology. Designers are used to FinFETs with 4 and 5 threshold voltages available to maximize the power – performance trade off, going back to one or two threshold voltages would be a problem, this is still an area of intense HNS development and needs to be solved for wide adoption.
At the “3nm” node Samsung has announced a GAA HNS they call a Multibridge, TSMC on the other hand is continuing with FinFETs. Both technologies are viable options at 3nm and the real question should be who delivers the better process.
Complementary FETs (CFET)
In the Seeking Alpha article there is a comment about a CFET offering 6x the density of a 3 fin FinFET cell, that isn’t how it works and in fact the comparison doesn’t even make sense.
Logic designs are made up of standard cells, the height of a standard cell is given by metal 2 pitch (M2P) multiplied by the number of tracks. A recent trend is Design Technology Co Optimization (DTCO) were in order to maximize shrinks the number of tracks has been reduced at the same time as M2P. In a 7.5 track cell, it is typical to have 3 fins per transistor but as we have transition to 6 track cells available at 7nm from TSMC and 5nm from Samsung, the fins per transistor is reduced to 2 due to spacing constraints. In order to maintain drive-current the fins are typically taller and optimized in other ways. As the industry moves to 5 track cells, the fins per transistor will be further reduced to 1.

Figure 3. Standard Cell layouts
CFETs are currently being developed as a possible path to continue to scale beyond HNS. In a CFET an nFET and pFET are stacked on top of each other as HNS of different conductivity types. In theory CFETs can scale over time by simply stacking more and more layers and may even allow lithography requirements to be relaxed but there is a long list of technical challenges to overcome to realize even a 2 deck CFET. Also, due to interconnect requirements going from a HNS to a 2 Deck CFET is approximately a 1.4x to 1.6x density increase, not 2x as might be expected. For the same process node, a 2 deck CFET would likely offer a less that 2x density advantage over an optimized FinFET, not 6x as claimed in the Seeking Alpha article.
2019 Status
In 2019 the leading logic processes in production were Intel’s 10nm process, Samsung’s 7nm process and TSMC’s 7nm optical process (7FF). Figure 5 compares the three processes.

Figure 4. 2019 Processes.
In figure 4, M2P is the metal 2 pitch as previously described, tracks are the number of tracks and cell height is M2P x Tracks. CPP is the contacted poly pitch and SDB/DDB is whether the process has a single diffusion break or double diffusion break. The width of a standard cell is some number of CPPs depending on the cell type and then DDB adds additional space versus a SDB at the cell edge. The transistor density is a weighted average of transistor density based on a mix of NAND cells and Scanned Flip Flop cells in a 60%/40% weighting. In my opinion this is the best metric for comparing process density, it isn’t perfect, but it takes designs out of the equation. A lot of people look at an Intel Microprocessor designed for maximum performance and compare the transistor density to something like an Apple Cell Phone Process with a completely different design goal and that simply doesn’t provide a process to process comparison under the same conditions.
It should be noted here that Samsung has a 6nm process and TSMC has a 7FFP that both increase the transistor density to around 120MTx/mm2, In the interest of clarity I am focusing on the major nodes.
2020 Status
At the end of 2019, Samsung and TSMC both began risk production of 5nm processes and both processes are in production in 2020.
5nm is where TSMC really stakes out a density lead, TSMC’s 5nm process has a reported 1.84x density improvement versus 7nm whereas Samsung’s 5nm process is only a 1.33x density improvement. Figure 5 compares Intel’s 10nm process to Samsung and TSMC’s 5nm processes since 10nm is still Intel’s densest process in 2020.

Figure 5. 2020 Processes.
The values for Samsung in figure 5 are all numbers that Samsung has confirmed. The TSMC M2P is an incredible 28nm, a number we have heard rumored in the industry. The rest of the numbers are our estimates to hit the density improvement TSMC has disclosed.
Clearly TSMC has the process density lead at the end of 2020.
2021/2022
Now the situation gets fuzzier, Intel’s 7nm process is due to start ramping in 2021 with a 2.0x shrink. Samsung and TSMC are both due to begin 3nm risk starts in 2021. Assuming Intel hits their date, they may briefly have a production density advantage but Intel’s 14nm and 10nm process have both been several years late. With COVID 19 impacting the semiconductor industry in general and the US in particular, a 2021 production date for Intel may be even less likely.
Figure 6 compares 2021/2022 processes assuming that within plus or minus a quarter or two all three processes will be available, I believe this is a fair assumption. Intel has said their density will be 2.0x 10nm, TSMC on their 2020-Q1 conference call said 3nm will be 70% denser than 5nm so presumably 1.7x, Samsung has said 3nm reduce the die size by 35% relative to 5nm and that equates to a approximately 1.54x denisty.
In order to make Intel’s numbers work I am assuming an aggressive 26nm M2P with 6 tracks, an aggressive 47nm CPP for a FinFET and SDB.
For Samsung they have disclosed to SemiWiki a 32nm M2P for 4nm and I am assuming they maintain that for 3nm with a 6-track cell. For CPP with the change to a GAA HNS, they can achieve 40nm and SDB.
In the case of TSMC they are shrinking 1.7x off of a 5nm process that is a 1.84x shrink from 7nm and they are bumping against some physical limits. With them staying with a FinFET I don’t expect the CPP to be below 45nm for performance reasons and even with SDB they will have to have a very aggressive cell height reduction. By implementing a buried power rail (BPR) they can get to a 5-track cell, BPR is a new and difficult technology and then an M2P of 22nm is required. Frankly such a small M2P raises issues with lithography and line resistance and BPR is also aggressive so I think this process will be incredibly challenging but TSMC has an excellent track record of execution.
Figure 6 summarizes the 2021/2022 process picture.

Figure 6. 2021/2022 Processes.
Some key observations from figure 6.
- The individual numbers in figure 6 are our estimates and may need to be revised as we get more information, but the overall process densities match what the companies have said and should be correct.
- In spite of being the first to move to HNS, Samsung’s 3nm is the least dense of the three processes. The early move to HNS may make it easier for Samsung to shrink in the future but for their 3nm node isn’t providing the density advantage that you might expect from HNS.
- Yes Intel is doing a 2.0x shrink and TSMC only a 1.7x shrink, but TSMC is doing a 1.84x shrink from 7nm to 5nm and then a 1.7x shrink from 5nm to 3nm in roughly the same time frame that Intel is doing a 2.0x shrink from 10nm to 7nm. A 1.7x shrink on top of a 1.84x shrink is a huge accomplishment, not a disappointment.
What’s Next
Beyond 2021/2022 I expect Intel and TSMC to both adopt HNS and Samsung to produce a second generation HNS. This will likely be followed by CFETs around 2024/2025 from all three companies. All of these confirmed numbers and projections come from the IC Knowledge – Strategic Cost and Price Model. The Strategic Cost and Price Model is not only a company specific roadmap of logic and memory technologies into the mid to late 2020s, it is also a cost and price model that produces detailed cost projections as well as material and equipment requirements.
Interested readers can see more detail on the Strategic Cost and Price Model here.
Conclusion
TSMC took the process density lead this year with their 5nm process. Depending on the exact timing of Intel’s 7nm process versus TSMC 3nm Intel may briefly regain a process density lead but TSMC will quickly pass them with their 3nm process with over 300 million transistors per millimeter squared!
Also Read:
SPIE 2020 – ASML EUV and Inspection Update
SPIE 2020 – Applied Materials Material-Enabled Patterning
LithoVision – Economics in the 3D Era
Share this post via:


Comments
10 Replies to “Can TSMC Maintain Their Process Technology Lead”
You must register or log in to view/post comments.