Threads
XF\Mvc\Entity\ArrayCollection Object
(
[entities:protected] => Array
(
[24495] => ThemeHouse\XPress\XF\Entity\Thread Object
(
[_uniqueEntityId:XF\Mvc\Entity\Entity:private] => 57
[rootClass:protected] => XF\Entity\Thread
[_useReplaceInto:protected] =>
[_newValues:protected] => Array
(
)
[_values:protected] => Array
(
[thread_id] => 24495
[node_id] => 2
[title] => TSMC CEO flags 3-nanometre chip production in Japan, investment reported at $17 billion
[reply_count] => 23
[view_count] => 824
[user_id] => 5
[username] => Daniel Nenni
[post_date] => 1770268039
[sticky] => 0
[discussion_state] => visible
[discussion_open] => 1
[discussion_type] => discussion
[first_post_id] => 97202
[first_post_reaction_score] => 1
[first_post_reactions] => {"1":1}
[last_post_date] => 1770407775
[last_post_id] => 97282
[last_post_user_id] => 333446
[last_post_username] => dkr1986
[prefix_id] => 0
[tags] => []
[custom_fields] => []
[vote_score] => 0
[vote_count] => 0
[featured] => 0
[type_data] => []
[index_state] => default
)
[_relations:protected] => Array
(
[User] => ThemeHouse\XLink\XF\Entity\User Object
(
[_uniqueEntityId:XF\Mvc\Entity\Entity:private] => 54
[rootClass:protected] => XF\Entity\User
[_useReplaceInto:protected] =>
[_newValues:protected] => Array
(
)
[_values:protected] => Array
(
[user_id] => 5
[username] => Daniel Nenni
[username_date] => 0
[username_date_visible] => 0
[email] => dnenni@semiwiki.com
[custom_title] => Admin
[language_id] => 1
[style_id] => 0
[style_variation] =>
[timezone] => America/Los_Angeles
[visible] => 1
[activity_visible] => 1
[user_group_id] => 3
[secondary_group_ids] => 4,5,132
[display_style_group_id] => 3
[permission_combination_id] => 88
[message_count] => 15220
[question_solution_count] => 0
[conversations_unread] => 0
[register_date] => 1280720820
[last_activity] => 1770393156
[last_summary_email_date] => 1605968657
[trophy_points] => 113
[alerts_unviewed] => 143
[alerts_unread] => 143
[avatar_date] => 1663211649
[avatar_width] => 110
[avatar_height] => 107
[avatar_highdpi] => 0
[avatar_optimized] => 0
[gravatar] =>
[user_state] => valid
[security_lock] =>
[is_moderator] => 1
[is_admin] => 1
[is_banned] => 0
[reaction_score] => 9085
[warning_points] => 0
[is_staff] => 1
[secret_key] => 0HwyUVVHCwJotUUVEpvqAclfYJdGNPpw
[privacy_policy_accepted] => 0
[terms_accepted] => 0
[vote_score] => 0
)
[_relations:protected] => Array
(
)
[_previousValues:protected] => Array
(
)
[_options:protected] => Array
(
)
[_deleted:protected] =>
[_readOnly:protected] =>
[_writePending:protected] =>
[_writeRunning:protected] =>
[_errors:protected] => Array
(
)
[_whenSaveable:protected] => Array
(
)
[_cascadeSave:protected] => Array
(
)
[_behaviors:protected] =>
)
[Forum] => XF\Entity\Forum Object
(
[_uniqueEntityId:XF\Mvc\Entity\Entity:private] => 56
[rootClass:protected] => XF\Entity\Forum
[_useReplaceInto:protected] =>
[_newValues:protected] => Array
(
)
[_values:protected] => Array
(
[node_id] => 2
[discussion_count] => 8303
[message_count] => 60745
[last_post_id] => 97282
[last_post_date] => 1770407775
[last_post_user_id] => 333446
[last_post_username] => dkr1986
[last_thread_id] => 24495
[last_thread_title] => TSMC CEO flags 3-nanometre chip production in Japan, investment reported at $17 billion
[last_thread_prefix_id] => 0
[moderate_threads] => 0
[moderate_replies] => 0
[allow_posting] => 1
[count_messages] => 1
[auto_feature] => 0
[find_new] => 1
[allow_index] => allow
[index_criteria] =>
[field_cache] => []
[prefix_cache] => []
[prompt_cache] => []
[default_prefix_id] => 0
[default_sort_order] => last_post_date
[default_sort_direction] => desc
[list_date_limit_days] => 0
[require_prefix] => 0
[allowed_watch_notifications] => all
[min_tags] => 0
[forum_type_id] => discussion
[type_config] => {"allowed_thread_types":["poll"]}
)
[_relations:protected] => Array
(
[Node] => XF\Entity\Node Object
(
[_uniqueEntityId:XF\Mvc\Entity\Entity:private] => 55
[rootClass:protected] => XF\Entity\Node
[_useReplaceInto:protected] =>
[_newValues:protected] => Array
(
)
[_values:protected] => Array
(
[node_id] => 2
[title] => SemiWiki Main Forum ( Ask the Experts! )
[description] => Post your questions to the experts here!
[node_name] =>
[node_type_id] => Forum
[parent_node_id] => 1
[display_order] => 1
[display_in_list] => 1
[lft] => 2
[rgt] => 3
[depth] => 1
[style_id] => 0
[effective_style_id] => 0
[breadcrumb_data] => {"1":{"node_id":1,"title":"Main Category","depth":0,"lft":1,"node_name":null,"node_type_id":"Category","display_in_list":true}}
[navigation_id] =>
[effective_navigation_id] =>
)
[_relations:protected] => Array
(
)
[_previousValues:protected] => Array
(
)
[_options:protected] => Array
(
)
[_deleted:protected] =>
[_readOnly:protected] =>
[_writePending:protected] =>
[_writeRunning:protected] =>
[_errors:protected] => Array
(
)
[_whenSaveable:protected] => Array
(
)
[_cascadeSave:protected] => Array
(
)
[_behaviors:protected] =>
)
)
[_previousValues:protected] => Array
(
)
[_options:protected] => Array
(
)
[_deleted:protected] =>
[_readOnly:protected] =>
[_writePending:protected] =>
[_writeRunning:protected] =>
[_errors:protected] => Array
(
)
[_whenSaveable:protected] => Array
(
)
[_cascadeSave:protected] => Array
(
)
[_behaviors:protected] =>
)
[24501] => ThemeHouse\XPress\XF\Entity\Thread Object
(
[_uniqueEntityId:XF\Mvc\Entity\Entity:private] => 61
[rootClass:protected] => XF\Entity\Thread
[_useReplaceInto:protected] =>
[_newValues:protected] => Array
(
)
[_values:protected] => Array
(
[thread_id] => 24501
[node_id] => 2
[title] => What percentage of the data center market will be AI/ML
[reply_count] => 3
[view_count] => 163
[user_id] => 10499
[username] => Arthur Hanson
[post_date] => 1770323412
[sticky] => 0
[discussion_state] => visible
[discussion_open] => 1
[discussion_type] => discussion
[first_post_id] => 97245
[first_post_reaction_score] => 0
[first_post_reactions] => []
[last_post_date] => 1770403158
[last_post_id] => 97280
[last_post_user_id] => 1305
[last_post_username] => KevinK
[prefix_id] => 0
[tags] => []
[custom_fields] => []
[vote_score] => 0
[vote_count] => 0
[featured] => 0
[type_data] => []
[index_state] => default
)
[_relations:protected] => Array
(
[User] => ThemeHouse\XLink\XF\Entity\User Object
(
[_uniqueEntityId:XF\Mvc\Entity\Entity:private] => 58
[rootClass:protected] => XF\Entity\User
[_useReplaceInto:protected] =>
[_newValues:protected] => Array
(
)
[_values:protected] => Array
(
[user_id] => 10499
[username] => Arthur Hanson
[username_date] => 0
[username_date_visible] => 0
[email] => a-j-hanson@att.net
[custom_title] =>
[language_id] => 1
[style_id] => 1
[style_variation] =>
[timezone] => America/Los_Angeles
[visible] => 1
[activity_visible] => 1
[user_group_id] => 2
[secondary_group_ids] =>
[display_style_group_id] => 2
[permission_combination_id] => 8
[message_count] => 3365
[question_solution_count] => 0
[conversations_unread] => 0
[register_date] => 1366028460
[last_activity] => 1770399202
[last_summary_email_date] => 1606051785
[trophy_points] => 83
[alerts_unviewed] => 6
[alerts_unread] => 6
[avatar_date] => 0
[avatar_width] => 0
[avatar_height] => 0
[avatar_highdpi] => 0
[avatar_optimized] => 0
[gravatar] =>
[user_state] => valid
[security_lock] =>
[is_moderator] => 0
[is_admin] => 0
[is_banned] => 0
[reaction_score] => 469
[warning_points] => 0
[is_staff] => 0
[secret_key] => ta_8_Pj20m6PDO6RnrGK-VnSP_vyhP_m
[privacy_policy_accepted] => 0
[terms_accepted] => 0
[vote_score] => 0
)
[_relations:protected] => Array
(
)
[_previousValues:protected] => Array
(
)
[_options:protected] => Array
(
)
[_deleted:protected] =>
[_readOnly:protected] =>
[_writePending:protected] =>
[_writeRunning:protected] =>
[_errors:protected] => Array
(
)
[_whenSaveable:protected] => Array
(
)
[_cascadeSave:protected] => Array
(
)
[_behaviors:protected] =>
)
[Forum] => XF\Entity\Forum Object
(
[_uniqueEntityId:XF\Mvc\Entity\Entity:private] => 56
[rootClass:protected] => XF\Entity\Forum
[_useReplaceInto:protected] =>
[_newValues:protected] => Array
(
)
[_values:protected] => Array
(
[node_id] => 2
[discussion_count] => 8303
[message_count] => 60745
[last_post_id] => 97282
[last_post_date] => 1770407775
[last_post_user_id] => 333446
[last_post_username] => dkr1986
[last_thread_id] => 24495
[last_thread_title] => TSMC CEO flags 3-nanometre chip production in Japan, investment reported at $17 billion
[last_thread_prefix_id] => 0
[moderate_threads] => 0
[moderate_replies] => 0
[allow_posting] => 1
[count_messages] => 1
[auto_feature] => 0
[find_new] => 1
[allow_index] => allow
[index_criteria] =>
[field_cache] => []
[prefix_cache] => []
[prompt_cache] => []
[default_prefix_id] => 0
[default_sort_order] => last_post_date
[default_sort_direction] => desc
[list_date_limit_days] => 0
[require_prefix] => 0
[allowed_watch_notifications] => all
[min_tags] => 0
[forum_type_id] => discussion
[type_config] => {"allowed_thread_types":["poll"]}
)
[_relations:protected] => Array
(
[Node] => XF\Entity\Node Object
(
[_uniqueEntityId:XF\Mvc\Entity\Entity:private] => 55
[rootClass:protected] => XF\Entity\Node
[_useReplaceInto:protected] =>
[_newValues:protected] => Array
(
)
[_values:protected] => Array
(
[node_id] => 2
[title] => SemiWiki Main Forum ( Ask the Experts! )
[description] => Post your questions to the experts here!
[node_name] =>
[node_type_id] => Forum
[parent_node_id] => 1
[display_order] => 1
[display_in_list] => 1
[lft] => 2
[rgt] => 3
[depth] => 1
[style_id] => 0
[effective_style_id] => 0
[breadcrumb_data] => {"1":{"node_id":1,"title":"Main Category","depth":0,"lft":1,"node_name":null,"node_type_id":"Category","display_in_list":true}}
[navigation_id] =>
[effective_navigation_id] =>
)
[_relations:protected] => Array
(
)
[_previousValues:protected] => Array
(
)
[_options:protected] => Array
(
)
[_deleted:protected] =>
[_readOnly:protected] =>
[_writePending:protected] =>
[_writeRunning:protected] =>
[_errors:protected] => Array
(
)
[_whenSaveable:protected] => Array
(
)
[_cascadeSave:protected] => Array
(
)
[_behaviors:protected] =>
)
)
[_previousValues:protected] => Array
(
)
[_options:protected] => Array
(
)
[_deleted:protected] =>
[_readOnly:protected] =>
[_writePending:protected] =>
[_writeRunning:protected] =>
[_errors:protected] => Array
(
)
[_whenSaveable:protected] => Array
(
)
[_cascadeSave:protected] => Array
(
)
[_behaviors:protected] =>
)
)
[_previousValues:protected] => Array
(
)
[_options:protected] => Array
(
)
[_deleted:protected] =>
[_readOnly:protected] =>
[_writePending:protected] =>
[_writeRunning:protected] =>
[_errors:protected] => Array
(
)
[_whenSaveable:protected] => Array
(
)
[_cascadeSave:protected] => Array
(
)
[_behaviors:protected] =>
)
[24504] => ThemeHouse\XPress\XF\Entity\Thread Object
(
[_uniqueEntityId:XF\Mvc\Entity\Entity:private] => 65
[rootClass:protected] => XF\Entity\Thread
[_useReplaceInto:protected] =>
[_newValues:protected] => Array
(
)
[_values:protected] => Array
(
[thread_id] => 24504
[node_id] => 2
[title] => Semiconductor Industry Association: annual sales projected to reach roughly $1 trillion worldwide in 2026
[reply_count] => 5
[view_count] => 125
[user_id] => 19450
[username] => user nl
[post_date] => 1770383805
[sticky] => 0
[discussion_state] => visible
[discussion_open] => 1
[discussion_type] => discussion
[first_post_id] => 97269
[first_post_reaction_score] => 1
[first_post_reactions] => {"1":1}
[last_post_date] => 1770401424
[last_post_id] => 97278
[last_post_user_id] => 19450
[last_post_username] => user nl
[prefix_id] => 0
[tags] => []
[custom_fields] => []
[vote_score] => 0
[vote_count] => 0
[featured] => 0
[type_data] => []
[index_state] => default
)
[_relations:protected] => Array
(
[User] => ThemeHouse\XLink\XF\Entity\User Object
(
[_uniqueEntityId:XF\Mvc\Entity\Entity:private] => 62
[rootClass:protected] => XF\Entity\User
[_useReplaceInto:protected] =>
[_newValues:protected] => Array
(
)
[_values:protected] => Array
(
[user_id] => 19450
[username] => user nl
[username_date] => 0
[username_date_visible] => 0
[email] => mauricehmjanssen@gmail.com
[custom_title] =>
[language_id] => 1
[style_id] => 0
[style_variation] =>
[timezone] => Europe/Amsterdam
[visible] => 1
[activity_visible] => 1
[user_group_id] => 2
[secondary_group_ids] =>
[display_style_group_id] => 2
[permission_combination_id] => 8
[message_count] => 424
[question_solution_count] => 0
[conversations_unread] => 0
[register_date] => 1424291496
[last_activity] => 1770405289
[last_summary_email_date] =>
[trophy_points] => 63
[alerts_unviewed] => 0
[alerts_unread] => 0
[avatar_date] => 1726169369
[avatar_width] => 384
[avatar_height] => 384
[avatar_highdpi] => 1
[avatar_optimized] => 0
[gravatar] =>
[user_state] => valid
[security_lock] =>
[is_moderator] => 0
[is_admin] => 0
[is_banned] => 0
[reaction_score] => 319
[warning_points] => 0
[is_staff] => 0
[secret_key] => V-1lb5_AW69yhzqA5ok9b64U0fMjJiqf
[privacy_policy_accepted] => 0
[terms_accepted] => 0
[vote_score] => 0
)
[_relations:protected] => Array
(
)
[_previousValues:protected] => Array
(
)
[_options:protected] => Array
(
)
[_deleted:protected] =>
[_readOnly:protected] =>
[_writePending:protected] =>
[_writeRunning:protected] =>
[_errors:protected] => Array
(
)
[_whenSaveable:protected] => Array
(
)
[_cascadeSave:protected] => Array
(
)
[_behaviors:protected] =>
)
[Forum] => XF\Entity\Forum Object
(
[_uniqueEntityId:XF\Mvc\Entity\Entity:private] => 56
[rootClass:protected] => XF\Entity\Forum
[_useReplaceInto:protected] =>
[_newValues:protected] => Array
(
)
[_values:protected] => Array
(
[node_id] => 2
[discussion_count] => 8303
[message_count] => 60745
[last_post_id] => 97282
[last_post_date] => 1770407775
[last_post_user_id] => 333446
[last_post_username] => dkr1986
[last_thread_id] => 24495
[last_thread_title] => TSMC CEO flags 3-nanometre chip production in Japan, investment reported at $17 billion
[last_thread_prefix_id] => 0
[moderate_threads] => 0
[moderate_replies] => 0
[allow_posting] => 1
[count_messages] => 1
[auto_feature] => 0
[find_new] => 1
[allow_index] => allow
[index_criteria] =>
[field_cache] => []
[prefix_cache] => []
[prompt_cache] => []
[default_prefix_id] => 0
[default_sort_order] => last_post_date
[default_sort_direction] => desc
[list_date_limit_days] => 0
[require_prefix] => 0
[allowed_watch_notifications] => all
[min_tags] => 0
[forum_type_id] => discussion
[type_config] => {"allowed_thread_types":["poll"]}
)
[_relations:protected] => Array
(
[Node] => XF\Entity\Node Object
(
[_uniqueEntityId:XF\Mvc\Entity\Entity:private] => 55
[rootClass:protected] => XF\Entity\Node
[_useReplaceInto:protected] =>
[_newValues:protected] => Array
(
)
[_values:protected] => Array
(
[node_id] => 2
[title] => SemiWiki Main Forum ( Ask the Experts! )
[description] => Post your questions to the experts here!
[node_name] =>
[node_type_id] => Forum
[parent_node_id] => 1
[display_order] => 1
[display_in_list] => 1
[lft] => 2
[rgt] => 3
[depth] => 1
[style_id] => 0
[effective_style_id] => 0
[breadcrumb_data] => {"1":{"node_id":1,"title":"Main Category","depth":0,"lft":1,"node_name":null,"node_type_id":"Category","display_in_list":true}}
[navigation_id] =>
[effective_navigation_id] =>
)
[_relations:protected] => Array
(
)
[_previousValues:protected] => Array
(
)
[_options:protected] => Array
(
)
[_deleted:protected] =>
[_readOnly:protected] =>
[_writePending:protected] =>
[_writeRunning:protected] =>
[_errors:protected] => Array
(
)
[_whenSaveable:protected] => Array
(
)
[_cascadeSave:protected] => Array
(
)
[_behaviors:protected] =>
)
)
[_previousValues:protected] => Array
(
)
[_options:protected] => Array
(
)
[_deleted:protected] =>
[_readOnly:protected] =>
[_writePending:protected] =>
[_writeRunning:protected] =>
[_errors:protected] => Array
(
)
[_whenSaveable:protected] => Array
(
)
[_cascadeSave:protected] => Array
(
)
[_behaviors:protected] =>
)
)
[_previousValues:protected] => Array
(
)
[_options:protected] => Array
(
)
[_deleted:protected] =>
[_readOnly:protected] =>
[_writePending:protected] =>
[_writeRunning:protected] =>
[_errors:protected] => Array
(
)
[_whenSaveable:protected] => Array
(
)
[_cascadeSave:protected] => Array
(
)
[_behaviors:protected] =>
)
[24498] => ThemeHouse\XPress\XF\Entity\Thread Object
(
[_uniqueEntityId:XF\Mvc\Entity\Entity:private] => 69
[rootClass:protected] => XF\Entity\Thread
[_useReplaceInto:protected] =>
[_newValues:protected] => Array
(
)
[_values:protected] => Array
(
[thread_id] => 24498
[node_id] => 2
[title] => Google passes TSMC relative capex in 2026
[reply_count] => 10
[view_count] => 475
[user_id] => 19450
[username] => user nl
[post_date] => 1770290492
[sticky] => 0
[discussion_state] => visible
[discussion_open] => 1
[discussion_type] => discussion
[first_post_id] => 97215
[first_post_reaction_score] => 2
[first_post_reactions] => {"1":2}
[last_post_date] => 1770394128
[last_post_id] => 97276
[last_post_user_id] => 138292
[last_post_username] => MKWVentures
[prefix_id] => 0
[tags] => []
[custom_fields] => []
[vote_score] => 0
[vote_count] => 0
[featured] => 0
[type_data] => []
[index_state] => default
)
[_relations:protected] => Array
(
[User] => ThemeHouse\XLink\XF\Entity\User Object
(
[_uniqueEntityId:XF\Mvc\Entity\Entity:private] => 62
[rootClass:protected] => XF\Entity\User
[_useReplaceInto:protected] =>
[_newValues:protected] => Array
(
)
[_values:protected] => Array
(
[user_id] => 19450
[username] => user nl
[username_date] => 0
[username_date_visible] => 0
[email] => mauricehmjanssen@gmail.com
[custom_title] =>
[language_id] => 1
[style_id] => 0
[style_variation] =>
[timezone] => Europe/Amsterdam
[visible] => 1
[activity_visible] => 1
[user_group_id] => 2
[secondary_group_ids] =>
[display_style_group_id] => 2
[permission_combination_id] => 8
[message_count] => 424
[question_solution_count] => 0
[conversations_unread] => 0
[register_date] => 1424291496
[last_activity] => 1770405289
[last_summary_email_date] =>
[trophy_points] => 63
[alerts_unviewed] => 0
[alerts_unread] => 0
[avatar_date] => 1726169369
[avatar_width] => 384
[avatar_height] => 384
[avatar_highdpi] => 1
[avatar_optimized] => 0
[gravatar] =>
[user_state] => valid
[security_lock] =>
[is_moderator] => 0
[is_admin] => 0
[is_banned] => 0
[reaction_score] => 319
[warning_points] => 0
[is_staff] => 0
[secret_key] => V-1lb5_AW69yhzqA5ok9b64U0fMjJiqf
[privacy_policy_accepted] => 0
[terms_accepted] => 0
[vote_score] => 0
)
[_relations:protected] => Array
(
)
[_previousValues:protected] => Array
(
)
[_options:protected] => Array
(
)
[_deleted:protected] =>
[_readOnly:protected] =>
[_writePending:protected] =>
[_writeRunning:protected] =>
[_errors:protected] => Array
(
)
[_whenSaveable:protected] => Array
(
)
[_cascadeSave:protected] => Array
(
)
[_behaviors:protected] =>
)
[Forum] => XF\Entity\Forum Object
(
[_uniqueEntityId:XF\Mvc\Entity\Entity:private] => 56
[rootClass:protected] => XF\Entity\Forum
[_useReplaceInto:protected] =>
[_newValues:protected] => Array
(
)
[_values:protected] => Array
(
[node_id] => 2
[discussion_count] => 8303
[message_count] => 60745
[last_post_id] => 97282
[last_post_date] => 1770407775
[last_post_user_id] => 333446
[last_post_username] => dkr1986
[last_thread_id] => 24495
[last_thread_title] => TSMC CEO flags 3-nanometre chip production in Japan, investment reported at $17 billion
[last_thread_prefix_id] => 0
[moderate_threads] => 0
[moderate_replies] => 0
[allow_posting] => 1
[count_messages] => 1
[auto_feature] => 0
[find_new] => 1
[allow_index] => allow
[index_criteria] =>
[field_cache] => []
[prefix_cache] => []
[prompt_cache] => []
[default_prefix_id] => 0
[default_sort_order] => last_post_date
[default_sort_direction] => desc
[list_date_limit_days] => 0
[require_prefix] => 0
[allowed_watch_notifications] => all
[min_tags] => 0
[forum_type_id] => discussion
[type_config] => {"allowed_thread_types":["poll"]}
)
[_relations:protected] => Array
(
[Node] => XF\Entity\Node Object
(
[_uniqueEntityId:XF\Mvc\Entity\Entity:private] => 55
[rootClass:protected] => XF\Entity\Node
[_useReplaceInto:protected] =>
[_newValues:protected] => Array
(
)
[_values:protected] => Array
(
[node_id] => 2
[title] => SemiWiki Main Forum ( Ask the Experts! )
[description] => Post your questions to the experts here!
[node_name] =>
[node_type_id] => Forum
[parent_node_id] => 1
[display_order] => 1
[display_in_list] => 1
[lft] => 2
[rgt] => 3
[depth] => 1
[style_id] => 0
[effective_style_id] => 0
[breadcrumb_data] => {"1":{"node_id":1,"title":"Main Category","depth":0,"lft":1,"node_name":null,"node_type_id":"Category","display_in_list":true}}
[navigation_id] =>
[effective_navigation_id] =>
)
[_relations:protected] => Array
(
)
[_previousValues:protected] => Array
(
)
[_options:protected] => Array
(
)
[_deleted:protected] =>
[_readOnly:protected] =>
[_writePending:protected] =>
[_writeRunning:protected] =>
[_errors:protected] => Array
(
)
[_whenSaveable:protected] => Array
(
)
[_cascadeSave:protected] => Array
(
)
[_behaviors:protected] =>
)
)
[_previousValues:protected] => Array
(
)
[_options:protected] => Array
(
)
[_deleted:protected] =>
[_readOnly:protected] =>
[_writePending:protected] =>
[_writeRunning:protected] =>
[_errors:protected] => Array
(
)
[_whenSaveable:protected] => Array
(
)
[_cascadeSave:protected] => Array
(
)
[_behaviors:protected] =>
)
)
[_previousValues:protected] => Array
(
)
[_options:protected] => Array
(
)
[_deleted:protected] =>
[_readOnly:protected] =>
[_writePending:protected] =>
[_writeRunning:protected] =>
[_errors:protected] => Array
(
)
[_whenSaveable:protected] => Array
(
)
[_cascadeSave:protected] => Array
(
)
[_behaviors:protected] =>
)
[24478] => ThemeHouse\XPress\XF\Entity\Thread Object
(
[_uniqueEntityId:XF\Mvc\Entity\Entity:private] => 73
[rootClass:protected] => XF\Entity\Thread
[_useReplaceInto:protected] =>
[_newValues:protected] => Array
(
)
[_values:protected] => Array
(
[thread_id] => 24478
[node_id] => 2
[title] => Softbank Corp, Intel announce memory chips collaboration
[reply_count] => 22
[view_count] => 1305
[user_id] => 5
[username] => Daniel Nenni
[post_date] => 1770154658
[sticky] => 0
[discussion_state] => visible
[discussion_open] => 1
[discussion_type] => discussion
[first_post_id] => 97127
[first_post_reaction_score] => 1
[first_post_reactions] => {"1":1,"5":1}
[last_post_date] => 1770386850
[last_post_id] => 97271
[last_post_user_id] => 90182
[last_post_username] => siliconbruh999
[prefix_id] => 0
[tags] => []
[custom_fields] => []
[vote_score] => 0
[vote_count] => 0
[featured] => 0
[type_data] => []
[index_state] => default
)
[_relations:protected] => Array
(
[User] => ThemeHouse\XLink\XF\Entity\User Object
(
[_uniqueEntityId:XF\Mvc\Entity\Entity:private] => 54
[rootClass:protected] => XF\Entity\User
[_useReplaceInto:protected] =>
[_newValues:protected] => Array
(
)
[_values:protected] => Array
(
[user_id] => 5
[username] => Daniel Nenni
[username_date] => 0
[username_date_visible] => 0
[email] => dnenni@semiwiki.com
[custom_title] => Admin
[language_id] => 1
[style_id] => 0
[style_variation] =>
[timezone] => America/Los_Angeles
[visible] => 1
[activity_visible] => 1
[user_group_id] => 3
[secondary_group_ids] => 4,5,132
[display_style_group_id] => 3
[permission_combination_id] => 88
[message_count] => 15220
[question_solution_count] => 0
[conversations_unread] => 0
[register_date] => 1280720820
[last_activity] => 1770393156
[last_summary_email_date] => 1605968657
[trophy_points] => 113
[alerts_unviewed] => 143
[alerts_unread] => 143
[avatar_date] => 1663211649
[avatar_width] => 110
[avatar_height] => 107
[avatar_highdpi] => 0
[avatar_optimized] => 0
[gravatar] =>
[user_state] => valid
[security_lock] =>
[is_moderator] => 1
[is_admin] => 1
[is_banned] => 0
[reaction_score] => 9085
[warning_points] => 0
[is_staff] => 1
[secret_key] => 0HwyUVVHCwJotUUVEpvqAclfYJdGNPpw
[privacy_policy_accepted] => 0
[terms_accepted] => 0
[vote_score] => 0
)
[_relations:protected] => Array
(
)
[_previousValues:protected] => Array
(
)
[_options:protected] => Array
(
)
[_deleted:protected] =>
[_readOnly:protected] =>
[_writePending:protected] =>
[_writeRunning:protected] =>
[_errors:protected] => Array
(
)
[_whenSaveable:protected] => Array
(
)
[_cascadeSave:protected] => Array
(
)
[_behaviors:protected] =>
)
[Forum] => XF\Entity\Forum Object
(
[_uniqueEntityId:XF\Mvc\Entity\Entity:private] => 56
[rootClass:protected] => XF\Entity\Forum
[_useReplaceInto:protected] =>
[_newValues:protected] => Array
(
)
[_values:protected] => Array
(
[node_id] => 2
[discussion_count] => 8303
[message_count] => 60745
[last_post_id] => 97282
[last_post_date] => 1770407775
[last_post_user_id] => 333446
[last_post_username] => dkr1986
[last_thread_id] => 24495
[last_thread_title] => TSMC CEO flags 3-nanometre chip production in Japan, investment reported at $17 billion
[last_thread_prefix_id] => 0
[moderate_threads] => 0
[moderate_replies] => 0
[allow_posting] => 1
[count_messages] => 1
[auto_feature] => 0
[find_new] => 1
[allow_index] => allow
[index_criteria] =>
[field_cache] => []
[prefix_cache] => []
[prompt_cache] => []
[default_prefix_id] => 0
[default_sort_order] => last_post_date
[default_sort_direction] => desc
[list_date_limit_days] => 0
[require_prefix] => 0
[allowed_watch_notifications] => all
[min_tags] => 0
[forum_type_id] => discussion
[type_config] => {"allowed_thread_types":["poll"]}
)
[_relations:protected] => Array
(
[Node] => XF\Entity\Node Object
(
[_uniqueEntityId:XF\Mvc\Entity\Entity:private] => 55
[rootClass:protected] => XF\Entity\Node
[_useReplaceInto:protected] =>
[_newValues:protected] => Array
(
)
[_values:protected] => Array
(
[node_id] => 2
[title] => SemiWiki Main Forum ( Ask the Experts! )
[description] => Post your questions to the experts here!
[node_name] =>
[node_type_id] => Forum
[parent_node_id] => 1
[display_order] => 1
[display_in_list] => 1
[lft] => 2
[rgt] => 3
[depth] => 1
[style_id] => 0
[effective_style_id] => 0
[breadcrumb_data] => {"1":{"node_id":1,"title":"Main Category","depth":0,"lft":1,"node_name":null,"node_type_id":"Category","display_in_list":true}}
[navigation_id] =>
[effective_navigation_id] =>
)
[_relations:protected] => Array
(
)
[_previousValues:protected] => Array
(
)
[_options:protected] => Array
(
)
[_deleted:protected] =>
[_readOnly:protected] =>
[_writePending:protected] =>
[_writeRunning:protected] =>
[_errors:protected] => Array
(
)
[_whenSaveable:protected] => Array
(
)
[_cascadeSave:protected] => Array
(
)
[_behaviors:protected] =>
)
)
[_previousValues:protected] => Array
(
)
[_options:protected] => Array
(
)
[_deleted:protected] =>
[_readOnly:protected] =>
[_writePending:protected] =>
[_writeRunning:protected] =>
[_errors:protected] => Array
(
)
[_whenSaveable:protected] => Array
(
)
[_cascadeSave:protected] => Array
(
)
[_behaviors:protected] =>
)
)
[_previousValues:protected] => Array
(
)
[_options:protected] => Array
(
)
[_deleted:protected] =>
[_readOnly:protected] =>
[_writePending:protected] =>
[_writeRunning:protected] =>
[_errors:protected] => Array
(
)
[_whenSaveable:protected] => Array
(
)
[_cascadeSave:protected] => Array
(
)
[_behaviors:protected] =>
)
[24503] => ThemeHouse\XPress\XF\Entity\Thread Object
(
[_uniqueEntityId:XF\Mvc\Entity\Entity:private] => 77
[rootClass:protected] => XF\Entity\Thread
[_useReplaceInto:protected] =>
[_newValues:protected] => Array
(
)
[_values:protected] => Array
(
[thread_id] => 24503
[node_id] => 2
[title] => Leading PC manufacturers considering using Chinese memory chips, report claims — HP and Dell qualifying CXMT DRAM
[reply_count] => 0
[view_count] => 83
[user_id] => 5185
[username] => Fred Chen
[post_date] => 1770380406
[sticky] => 0
[discussion_state] => visible
[discussion_open] => 1
[discussion_type] => discussion
[first_post_id] => 97268
[first_post_reaction_score] => 0
[first_post_reactions] => []
[last_post_date] => 1770380406
[last_post_id] => 97268
[last_post_user_id] => 5185
[last_post_username] => Fred Chen
[prefix_id] => 0
[tags] => []
[custom_fields] => []
[vote_score] => 0
[vote_count] => 0
[featured] => 0
[type_data] => []
[index_state] => default
)
[_relations:protected] => Array
(
[User] => ThemeHouse\XLink\XF\Entity\User Object
(
[_uniqueEntityId:XF\Mvc\Entity\Entity:private] => 74
[rootClass:protected] => XF\Entity\User
[_useReplaceInto:protected] =>
[_newValues:protected] => Array
(
)
[_values:protected] => Array
(
[user_id] => 5185
[username] => Fred Chen
[username_date] => 0
[username_date_visible] => 0
[email] => chen.t.fred@gmail.com
[custom_title] =>
[language_id] => 1
[style_id] => 0
[style_variation] =>
[timezone] => America/Los_Angeles
[visible] => 1
[activity_visible] => 1
[user_group_id] => 4
[secondary_group_ids] =>
[display_style_group_id] => 4
[permission_combination_id] => 92
[message_count] => 2519
[question_solution_count] => 0
[conversations_unread] => 0
[register_date] => 1333032401
[last_activity] => 1770380409
[last_summary_email_date] => 1605940563
[trophy_points] => 113
[alerts_unviewed] => 2
[alerts_unread] => 2
[avatar_date] => 0
[avatar_width] => 0
[avatar_height] => 0
[avatar_highdpi] => 0
[avatar_optimized] => 0
[gravatar] =>
[user_state] => valid
[security_lock] =>
[is_moderator] => 0
[is_admin] => 0
[is_banned] => 0
[reaction_score] => 1825
[warning_points] => 0
[is_staff] => 0
[secret_key] => 5m-bZq0HRSi9VA-96QONHJeevdQas5S8
[privacy_policy_accepted] => 0
[terms_accepted] => 0
[vote_score] => 0
)
[_relations:protected] => Array
(
)
[_previousValues:protected] => Array
(
)
[_options:protected] => Array
(
)
[_deleted:protected] =>
[_readOnly:protected] =>
[_writePending:protected] =>
[_writeRunning:protected] =>
[_errors:protected] => Array
(
)
[_whenSaveable:protected] => Array
(
)
[_cascadeSave:protected] => Array
(
)
[_behaviors:protected] =>
)
[Forum] => XF\Entity\Forum Object
(
[_uniqueEntityId:XF\Mvc\Entity\Entity:private] => 56
[rootClass:protected] => XF\Entity\Forum
[_useReplaceInto:protected] =>
[_newValues:protected] => Array
(
)
[_values:protected] => Array
(
[node_id] => 2
[discussion_count] => 8303
[message_count] => 60745
[last_post_id] => 97282
[last_post_date] => 1770407775
[last_post_user_id] => 333446
[last_post_username] => dkr1986
[last_thread_id] => 24495
[last_thread_title] => TSMC CEO flags 3-nanometre chip production in Japan, investment reported at $17 billion
[last_thread_prefix_id] => 0
[moderate_threads] => 0
[moderate_replies] => 0
[allow_posting] => 1
[count_messages] => 1
[auto_feature] => 0
[find_new] => 1
[allow_index] => allow
[index_criteria] =>
[field_cache] => []
[prefix_cache] => []
[prompt_cache] => []
[default_prefix_id] => 0
[default_sort_order] => last_post_date
[default_sort_direction] => desc
[list_date_limit_days] => 0
[require_prefix] => 0
[allowed_watch_notifications] => all
[min_tags] => 0
[forum_type_id] => discussion
[type_config] => {"allowed_thread_types":["poll"]}
)
[_relations:protected] => Array
(
[Node] => XF\Entity\Node Object
(
[_uniqueEntityId:XF\Mvc\Entity\Entity:private] => 55
[rootClass:protected] => XF\Entity\Node
[_useReplaceInto:protected] =>
[_newValues:protected] => Array
(
)
[_values:protected] => Array
(
[node_id] => 2
[title] => SemiWiki Main Forum ( Ask the Experts! )
[description] => Post your questions to the experts here!
[node_name] =>
[node_type_id] => Forum
[parent_node_id] => 1
[display_order] => 1
[display_in_list] => 1
[lft] => 2
[rgt] => 3
[depth] => 1
[style_id] => 0
[effective_style_id] => 0
[breadcrumb_data] => {"1":{"node_id":1,"title":"Main Category","depth":0,"lft":1,"node_name":null,"node_type_id":"Category","display_in_list":true}}
[navigation_id] =>
[effective_navigation_id] =>
)
[_relations:protected] => Array
(
)
[_previousValues:protected] => Array
(
)
[_options:protected] => Array
(
)
[_deleted:protected] =>
[_readOnly:protected] =>
[_writePending:protected] =>
[_writeRunning:protected] =>
[_errors:protected] => Array
(
)
[_whenSaveable:protected] => Array
(
)
[_cascadeSave:protected] => Array
(
)
[_behaviors:protected] =>
)
)
[_previousValues:protected] => Array
(
)
[_options:protected] => Array
(
)
[_deleted:protected] =>
[_readOnly:protected] =>
[_writePending:protected] =>
[_writeRunning:protected] =>
[_errors:protected] => Array
(
)
[_whenSaveable:protected] => Array
(
)
[_cascadeSave:protected] => Array
(
)
[_behaviors:protected] =>
)
)
[_previousValues:protected] => Array
(
)
[_options:protected] => Array
(
)
[_deleted:protected] =>
[_readOnly:protected] =>
[_writePending:protected] =>
[_writeRunning:protected] =>
[_errors:protected] => Array
(
)
[_whenSaveable:protected] => Array
(
)
[_cascadeSave:protected] => Array
(
)
[_behaviors:protected] =>
)
[24502] => ThemeHouse\XPress\XF\Entity\Thread Object
(
[_uniqueEntityId:XF\Mvc\Entity\Entity:private] => 81
[rootClass:protected] => XF\Entity\Thread
[_useReplaceInto:protected] =>
[_newValues:protected] => Array
(
)
[_values:protected] => Array
(
[thread_id] => 24502
[node_id] => 2
[title] => Winners and Losers by SemiAnalysis: Claude Code is the Inflection Point
[reply_count] => 1
[view_count] => 134
[user_id] => 19450
[username] => user nl
[post_date] => 1770372570
[sticky] => 0
[discussion_state] => visible
[discussion_open] => 1
[discussion_type] => discussion
[first_post_id] => 97265
[first_post_reaction_score] => 1
[first_post_reactions] => {"1":1}
[last_post_date] => 1770374407
[last_post_id] => 97266
[last_post_user_id] => 326461
[last_post_username] => Yunus
[prefix_id] => 0
[tags] => []
[custom_fields] => []
[vote_score] => 0
[vote_count] => 0
[featured] => 0
[type_data] => []
[index_state] => default
)
[_relations:protected] => Array
(
[User] => ThemeHouse\XLink\XF\Entity\User Object
(
[_uniqueEntityId:XF\Mvc\Entity\Entity:private] => 62
[rootClass:protected] => XF\Entity\User
[_useReplaceInto:protected] =>
[_newValues:protected] => Array
(
)
[_values:protected] => Array
(
[user_id] => 19450
[username] => user nl
[username_date] => 0
[username_date_visible] => 0
[email] => mauricehmjanssen@gmail.com
[custom_title] =>
[language_id] => 1
[style_id] => 0
[style_variation] =>
[timezone] => Europe/Amsterdam
[visible] => 1
[activity_visible] => 1
[user_group_id] => 2
[secondary_group_ids] =>
[display_style_group_id] => 2
[permission_combination_id] => 8
[message_count] => 424
[question_solution_count] => 0
[conversations_unread] => 0
[register_date] => 1424291496
[last_activity] => 1770405289
[last_summary_email_date] =>
[trophy_points] => 63
[alerts_unviewed] => 0
[alerts_unread] => 0
[avatar_date] => 1726169369
[avatar_width] => 384
[avatar_height] => 384
[avatar_highdpi] => 1
[avatar_optimized] => 0
[gravatar] =>
[user_state] => valid
[security_lock] =>
[is_moderator] => 0
[is_admin] => 0
[is_banned] => 0
[reaction_score] => 319
[warning_points] => 0
[is_staff] => 0
[secret_key] => V-1lb5_AW69yhzqA5ok9b64U0fMjJiqf
[privacy_policy_accepted] => 0
[terms_accepted] => 0
[vote_score] => 0
)
[_relations:protected] => Array
(
)
[_previousValues:protected] => Array
(
)
[_options:protected] => Array
(
)
[_deleted:protected] =>
[_readOnly:protected] =>
[_writePending:protected] =>
[_writeRunning:protected] =>
[_errors:protected] => Array
(
)
[_whenSaveable:protected] => Array
(
)
[_cascadeSave:protected] => Array
(
)
[_behaviors:protected] =>
)
[Forum] => XF\Entity\Forum Object
(
[_uniqueEntityId:XF\Mvc\Entity\Entity:private] => 56
[rootClass:protected] => XF\Entity\Forum
[_useReplaceInto:protected] =>
[_newValues:protected] => Array
(
)
[_values:protected] => Array
(
[node_id] => 2
[discussion_count] => 8303
[message_count] => 60745
[last_post_id] => 97282
[last_post_date] => 1770407775
[last_post_user_id] => 333446
[last_post_username] => dkr1986
[last_thread_id] => 24495
[last_thread_title] => TSMC CEO flags 3-nanometre chip production in Japan, investment reported at $17 billion
[last_thread_prefix_id] => 0
[moderate_threads] => 0
[moderate_replies] => 0
[allow_posting] => 1
[count_messages] => 1
[auto_feature] => 0
[find_new] => 1
[allow_index] => allow
[index_criteria] =>
[field_cache] => []
[prefix_cache] => []
[prompt_cache] => []
[default_prefix_id] => 0
[default_sort_order] => last_post_date
[default_sort_direction] => desc
[list_date_limit_days] => 0
[require_prefix] => 0
[allowed_watch_notifications] => all
[min_tags] => 0
[forum_type_id] => discussion
[type_config] => {"allowed_thread_types":["poll"]}
)
[_relations:protected] => Array
(
[Node] => XF\Entity\Node Object
(
[_uniqueEntityId:XF\Mvc\Entity\Entity:private] => 55
[rootClass:protected] => XF\Entity\Node
[_useReplaceInto:protected] =>
[_newValues:protected] => Array
(
)
[_values:protected] => Array
(
[node_id] => 2
[title] => SemiWiki Main Forum ( Ask the Experts! )
[description] => Post your questions to the experts here!
[node_name] =>
[node_type_id] => Forum
[parent_node_id] => 1
[display_order] => 1
[display_in_list] => 1
[lft] => 2
[rgt] => 3
[depth] => 1
[style_id] => 0
[effective_style_id] => 0
[breadcrumb_data] => {"1":{"node_id":1,"title":"Main Category","depth":0,"lft":1,"node_name":null,"node_type_id":"Category","display_in_list":true}}
[navigation_id] =>
[effective_navigation_id] =>
)
[_relations:protected] => Array
(
)
[_previousValues:protected] => Array
(
)
[_options:protected] => Array
(
)
[_deleted:protected] =>
[_readOnly:protected] =>
[_writePending:protected] =>
[_writeRunning:protected] =>
[_errors:protected] => Array
(
)
[_whenSaveable:protected] => Array
(
)
[_cascadeSave:protected] => Array
(
)
[_behaviors:protected] =>
)
)
[_previousValues:protected] => Array
(
)
[_options:protected] => Array
(
)
[_deleted:protected] =>
[_readOnly:protected] =>
[_writePending:protected] =>
[_writeRunning:protected] =>
[_errors:protected] => Array
(
)
[_whenSaveable:protected] => Array
(
)
[_cascadeSave:protected] => Array
(
)
[_behaviors:protected] =>
)
)
[_previousValues:protected] => Array
(
)
[_options:protected] => Array
(
)
[_deleted:protected] =>
[_readOnly:protected] =>
[_writePending:protected] =>
[_writeRunning:protected] =>
[_errors:protected] => Array
(
)
[_whenSaveable:protected] => Array
(
)
[_cascadeSave:protected] => Array
(
)
[_behaviors:protected] =>
)
[24458] => ThemeHouse\XPress\XF\Entity\Thread Object
(
[_uniqueEntityId:XF\Mvc\Entity\Entity:private] => 85
[rootClass:protected] => XF\Entity\Thread
[_useReplaceInto:protected] =>
[_newValues:protected] => Array
(
)
[_values:protected] => Array
(
[thread_id] => 24458
[node_id] => 2
[title] => Intel’s 18A rumors meet a thermal brick wall says SemiWiki
[reply_count] => 18
[view_count] => 2071
[user_id] => 5
[username] => Daniel Nenni
[post_date] => 1770072892
[sticky] => 0
[discussion_state] => visible
[discussion_open] => 1
[discussion_type] => discussion
[first_post_id] => 97081
[first_post_reaction_score] => 8
[first_post_reactions] => {"3":6,"1":2}
[last_post_date] => 1770372197
[last_post_id] => 97264
[last_post_user_id] => 6522
[last_post_username] => IanD
[prefix_id] => 0
[tags] => []
[custom_fields] => []
[vote_score] => 0
[vote_count] => 0
[featured] => 0
[type_data] => []
[index_state] => default
)
[_relations:protected] => Array
(
[User] => ThemeHouse\XLink\XF\Entity\User Object
(
[_uniqueEntityId:XF\Mvc\Entity\Entity:private] => 54
[rootClass:protected] => XF\Entity\User
[_useReplaceInto:protected] =>
[_newValues:protected] => Array
(
)
[_values:protected] => Array
(
[user_id] => 5
[username] => Daniel Nenni
[username_date] => 0
[username_date_visible] => 0
[email] => dnenni@semiwiki.com
[custom_title] => Admin
[language_id] => 1
[style_id] => 0
[style_variation] =>
[timezone] => America/Los_Angeles
[visible] => 1
[activity_visible] => 1
[user_group_id] => 3
[secondary_group_ids] => 4,5,132
[display_style_group_id] => 3
[permission_combination_id] => 88
[message_count] => 15220
[question_solution_count] => 0
[conversations_unread] => 0
[register_date] => 1280720820
[last_activity] => 1770393156
[last_summary_email_date] => 1605968657
[trophy_points] => 113
[alerts_unviewed] => 143
[alerts_unread] => 143
[avatar_date] => 1663211649
[avatar_width] => 110
[avatar_height] => 107
[avatar_highdpi] => 0
[avatar_optimized] => 0
[gravatar] =>
[user_state] => valid
[security_lock] =>
[is_moderator] => 1
[is_admin] => 1
[is_banned] => 0
[reaction_score] => 9085
[warning_points] => 0
[is_staff] => 1
[secret_key] => 0HwyUVVHCwJotUUVEpvqAclfYJdGNPpw
[privacy_policy_accepted] => 0
[terms_accepted] => 0
[vote_score] => 0
)
[_relations:protected] => Array
(
)
[_previousValues:protected] => Array
(
)
[_options:protected] => Array
(
)
[_deleted:protected] =>
[_readOnly:protected] =>
[_writePending:protected] =>
[_writeRunning:protected] =>
[_errors:protected] => Array
(
)
[_whenSaveable:protected] => Array
(
)
[_cascadeSave:protected] => Array
(
)
[_behaviors:protected] =>
)
[Forum] => XF\Entity\Forum Object
(
[_uniqueEntityId:XF\Mvc\Entity\Entity:private] => 56
[rootClass:protected] => XF\Entity\Forum
[_useReplaceInto:protected] =>
[_newValues:protected] => Array
(
)
[_values:protected] => Array
(
[node_id] => 2
[discussion_count] => 8303
[message_count] => 60745
[last_post_id] => 97282
[last_post_date] => 1770407775
[last_post_user_id] => 333446
[last_post_username] => dkr1986
[last_thread_id] => 24495
[last_thread_title] => TSMC CEO flags 3-nanometre chip production in Japan, investment reported at $17 billion
[last_thread_prefix_id] => 0
[moderate_threads] => 0
[moderate_replies] => 0
[allow_posting] => 1
[count_messages] => 1
[auto_feature] => 0
[find_new] => 1
[allow_index] => allow
[index_criteria] =>
[field_cache] => []
[prefix_cache] => []
[prompt_cache] => []
[default_prefix_id] => 0
[default_sort_order] => last_post_date
[default_sort_direction] => desc
[list_date_limit_days] => 0
[require_prefix] => 0
[allowed_watch_notifications] => all
[min_tags] => 0
[forum_type_id] => discussion
[type_config] => {"allowed_thread_types":["poll"]}
)
[_relations:protected] => Array
(
[Node] => XF\Entity\Node Object
(
[_uniqueEntityId:XF\Mvc\Entity\Entity:private] => 55
[rootClass:protected] => XF\Entity\Node
[_useReplaceInto:protected] =>
[_newValues:protected] => Array
(
)
[_values:protected] => Array
(
[node_id] => 2
[title] => SemiWiki Main Forum ( Ask the Experts! )
[description] => Post your questions to the experts here!
[node_name] =>
[node_type_id] => Forum
[parent_node_id] => 1
[display_order] => 1
[display_in_list] => 1
[lft] => 2
[rgt] => 3
[depth] => 1
[style_id] => 0
[effective_style_id] => 0
[breadcrumb_data] => {"1":{"node_id":1,"title":"Main Category","depth":0,"lft":1,"node_name":null,"node_type_id":"Category","display_in_list":true}}
[navigation_id] =>
[effective_navigation_id] =>
)
[_relations:protected] => Array
(
)
[_previousValues:protected] => Array
(
)
[_options:protected] => Array
(
)
[_deleted:protected] =>
[_readOnly:protected] =>
[_writePending:protected] =>
[_writeRunning:protected] =>
[_errors:protected] => Array
(
)
[_whenSaveable:protected] => Array
(
)
[_cascadeSave:protected] => Array
(
)
[_behaviors:protected] =>
)
)
[_previousValues:protected] => Array
(
)
[_options:protected] => Array
(
)
[_deleted:protected] =>
[_readOnly:protected] =>
[_writePending:protected] =>
[_writeRunning:protected] =>
[_errors:protected] => Array
(
)
[_whenSaveable:protected] => Array
(
)
[_cascadeSave:protected] => Array
(
)
[_behaviors:protected] =>
)
)
[_previousValues:protected] => Array
(
)
[_options:protected] => Array
(
)
[_deleted:protected] =>
[_readOnly:protected] =>
[_writePending:protected] =>
[_writeRunning:protected] =>
[_errors:protected] => Array
(
)
[_whenSaveable:protected] => Array
(
)
[_cascadeSave:protected] => Array
(
)
[_behaviors:protected] =>
)
[24500] => ThemeHouse\XPress\XF\Entity\Thread Object
(
[_uniqueEntityId:XF\Mvc\Entity\Entity:private] => 89
[rootClass:protected] => XF\Entity\Thread
[_useReplaceInto:protected] =>
[_newValues:protected] => Array
(
)
[_values:protected] => Array
(
[thread_id] => 24500
[node_id] => 2
[title] => Memory Prices Surge Up to 90% From Q4 2025
[reply_count] => 1
[view_count] => 243
[user_id] => 5
[username] => Daniel Nenni
[post_date] => 1770319144
[sticky] => 0
[discussion_state] => visible
[discussion_open] => 1
[discussion_type] => discussion
[first_post_id] => 97242
[first_post_reaction_score] => 2
[first_post_reactions] => {"1":2,"4":1}
[last_post_date] => 1770344190
[last_post_id] => 97254
[last_post_user_id] => 35301
[last_post_username] => Xebec
[prefix_id] => 0
[tags] => []
[custom_fields] => []
[vote_score] => 0
[vote_count] => 0
[featured] => 0
[type_data] => []
[index_state] => default
)
[_relations:protected] => Array
(
[User] => ThemeHouse\XLink\XF\Entity\User Object
(
[_uniqueEntityId:XF\Mvc\Entity\Entity:private] => 54
[rootClass:protected] => XF\Entity\User
[_useReplaceInto:protected] =>
[_newValues:protected] => Array
(
)
[_values:protected] => Array
(
[user_id] => 5
[username] => Daniel Nenni
[username_date] => 0
[username_date_visible] => 0
[email] => dnenni@semiwiki.com
[custom_title] => Admin
[language_id] => 1
[style_id] => 0
[style_variation] =>
[timezone] => America/Los_Angeles
[visible] => 1
[activity_visible] => 1
[user_group_id] => 3
[secondary_group_ids] => 4,5,132
[display_style_group_id] => 3
[permission_combination_id] => 88
[message_count] => 15220
[question_solution_count] => 0
[conversations_unread] => 0
[register_date] => 1280720820
[last_activity] => 1770393156
[last_summary_email_date] => 1605968657
[trophy_points] => 113
[alerts_unviewed] => 143
[alerts_unread] => 143
[avatar_date] => 1663211649
[avatar_width] => 110
[avatar_height] => 107
[avatar_highdpi] => 0
[avatar_optimized] => 0
[gravatar] =>
[user_state] => valid
[security_lock] =>
[is_moderator] => 1
[is_admin] => 1
[is_banned] => 0
[reaction_score] => 9085
[warning_points] => 0
[is_staff] => 1
[secret_key] => 0HwyUVVHCwJotUUVEpvqAclfYJdGNPpw
[privacy_policy_accepted] => 0
[terms_accepted] => 0
[vote_score] => 0
)
[_relations:protected] => Array
(
)
[_previousValues:protected] => Array
(
)
[_options:protected] => Array
(
)
[_deleted:protected] =>
[_readOnly:protected] =>
[_writePending:protected] =>
[_writeRunning:protected] =>
[_errors:protected] => Array
(
)
[_whenSaveable:protected] => Array
(
)
[_cascadeSave:protected] => Array
(
)
[_behaviors:protected] =>
)
[Forum] => XF\Entity\Forum Object
(
[_uniqueEntityId:XF\Mvc\Entity\Entity:private] => 56
[rootClass:protected] => XF\Entity\Forum
[_useReplaceInto:protected] =>
[_newValues:protected] => Array
(
)
[_values:protected] => Array
(
[node_id] => 2
[discussion_count] => 8303
[message_count] => 60745
[last_post_id] => 97282
[last_post_date] => 1770407775
[last_post_user_id] => 333446
[last_post_username] => dkr1986
[last_thread_id] => 24495
[last_thread_title] => TSMC CEO flags 3-nanometre chip production in Japan, investment reported at $17 billion
[last_thread_prefix_id] => 0
[moderate_threads] => 0
[moderate_replies] => 0
[allow_posting] => 1
[count_messages] => 1
[auto_feature] => 0
[find_new] => 1
[allow_index] => allow
[index_criteria] =>
[field_cache] => []
[prefix_cache] => []
[prompt_cache] => []
[default_prefix_id] => 0
[default_sort_order] => last_post_date
[default_sort_direction] => desc
[list_date_limit_days] => 0
[require_prefix] => 0
[allowed_watch_notifications] => all
[min_tags] => 0
[forum_type_id] => discussion
[type_config] => {"allowed_thread_types":["poll"]}
)
[_relations:protected] => Array
(
[Node] => XF\Entity\Node Object
(
[_uniqueEntityId:XF\Mvc\Entity\Entity:private] => 55
[rootClass:protected] => XF\Entity\Node
[_useReplaceInto:protected] =>
[_newValues:protected] => Array
(
)
[_values:protected] => Array
(
[node_id] => 2
[title] => SemiWiki Main Forum ( Ask the Experts! )
[description] => Post your questions to the experts here!
[node_name] =>
[node_type_id] => Forum
[parent_node_id] => 1
[display_order] => 1
[display_in_list] => 1
[lft] => 2
[rgt] => 3
[depth] => 1
[style_id] => 0
[effective_style_id] => 0
[breadcrumb_data] => {"1":{"node_id":1,"title":"Main Category","depth":0,"lft":1,"node_name":null,"node_type_id":"Category","display_in_list":true}}
[navigation_id] =>
[effective_navigation_id] =>
)
[_relations:protected] => Array
(
)
[_previousValues:protected] => Array
(
)
[_options:protected] => Array
(
)
[_deleted:protected] =>
[_readOnly:protected] =>
[_writePending:protected] =>
[_writeRunning:protected] =>
[_errors:protected] => Array
(
)
[_whenSaveable:protected] => Array
(
)
[_cascadeSave:protected] => Array
(
)
[_behaviors:protected] =>
)
)
[_previousValues:protected] => Array
(
)
[_options:protected] => Array
(
)
[_deleted:protected] =>
[_readOnly:protected] =>
[_writePending:protected] =>
[_writeRunning:protected] =>
[_errors:protected] => Array
(
)
[_whenSaveable:protected] => Array
(
)
[_cascadeSave:protected] => Array
(
)
[_behaviors:protected] =>
)
)
[_previousValues:protected] => Array
(
)
[_options:protected] => Array
(
)
[_deleted:protected] =>
[_readOnly:protected] =>
[_writePending:protected] =>
[_writeRunning:protected] =>
[_errors:protected] => Array
(
)
[_whenSaveable:protected] => Array
(
)
[_cascadeSave:protected] => Array
(
)
[_behaviors:protected] =>
)
[24492] => ThemeHouse\XPress\XF\Entity\Thread Object
(
[_uniqueEntityId:XF\Mvc\Entity\Entity:private] => 93
[rootClass:protected] => XF\Entity\Thread
[_useReplaceInto:protected] =>
[_newValues:protected] => Array
(
)
[_values:protected] => Array
(
[thread_id] => 24492
[node_id] => 2
[title] => AWS CEO Matt Garman said today there is so much demand they have NEVER retired an Nvidia A100 GPU
[reply_count] => 2
[view_count] => 354
[user_id] => 36640
[username] => soAsian
[post_date] => 1770257665
[sticky] => 0
[discussion_state] => visible
[discussion_open] => 1
[discussion_type] => discussion
[first_post_id] => 97192
[first_post_reaction_score] => 3
[first_post_reactions] => {"1":3,"4":1}
[last_post_date] => 1770336847
[last_post_id] => 97250
[last_post_user_id] => 5
[last_post_username] => Daniel Nenni
[prefix_id] => 0
[tags] => []
[custom_fields] => []
[vote_score] => 0
[vote_count] => 0
[featured] => 0
[type_data] => []
[index_state] => default
)
[_relations:protected] => Array
(
[User] => ThemeHouse\XLink\XF\Entity\User Object
(
[_uniqueEntityId:XF\Mvc\Entity\Entity:private] => 90
[rootClass:protected] => XF\Entity\User
[_useReplaceInto:protected] =>
[_newValues:protected] => Array
(
)
[_values:protected] => Array
(
[user_id] => 36640
[username] => soAsian
[username_date] => 0
[username_date_visible] => 0
[email] => jackmtsai@gmail.com
[custom_title] =>
[language_id] => 1
[style_id] => 0
[style_variation] =>
[timezone] => America/Chicago
[visible] => 1
[activity_visible] => 1
[user_group_id] => 2
[secondary_group_ids] =>
[display_style_group_id] => 2
[permission_combination_id] => 8
[message_count] => 394
[question_solution_count] => 0
[conversations_unread] => 0
[register_date] => 1608139716
[last_activity] => 1770408559
[last_summary_email_date] => 1719670845
[trophy_points] => 63
[alerts_unviewed] => 0
[alerts_unread] => 0
[avatar_date] => 0
[avatar_width] => 0
[avatar_height] => 0
[avatar_highdpi] => 0
[avatar_optimized] => 0
[gravatar] =>
[user_state] => valid
[security_lock] =>
[is_moderator] => 0
[is_admin] => 0
[is_banned] => 0
[reaction_score] => 357
[warning_points] => 0
[is_staff] => 0
[secret_key] => 2oKeCTFkGUpMro5tcmj7WaY9HksB13Kw
[privacy_policy_accepted] => 1608139716
[terms_accepted] => 1608139716
[vote_score] => 0
)
[_relations:protected] => Array
(
)
[_previousValues:protected] => Array
(
)
[_options:protected] => Array
(
)
[_deleted:protected] =>
[_readOnly:protected] =>
[_writePending:protected] =>
[_writeRunning:protected] =>
[_errors:protected] => Array
(
)
[_whenSaveable:protected] => Array
(
)
[_cascadeSave:protected] => Array
(
)
[_behaviors:protected] =>
)
[Forum] => XF\Entity\Forum Object
(
[_uniqueEntityId:XF\Mvc\Entity\Entity:private] => 56
[rootClass:protected] => XF\Entity\Forum
[_useReplaceInto:protected] =>
[_newValues:protected] => Array
(
)
[_values:protected] => Array
(
[node_id] => 2
[discussion_count] => 8303
[message_count] => 60745
[last_post_id] => 97282
[last_post_date] => 1770407775
[last_post_user_id] => 333446
[last_post_username] => dkr1986
[last_thread_id] => 24495
[last_thread_title] => TSMC CEO flags 3-nanometre chip production in Japan, investment reported at $17 billion
[last_thread_prefix_id] => 0
[moderate_threads] => 0
[moderate_replies] => 0
[allow_posting] => 1
[count_messages] => 1
[auto_feature] => 0
[find_new] => 1
[allow_index] => allow
[index_criteria] =>
[field_cache] => []
[prefix_cache] => []
[prompt_cache] => []
[default_prefix_id] => 0
[default_sort_order] => last_post_date
[default_sort_direction] => desc
[list_date_limit_days] => 0
[require_prefix] => 0
[allowed_watch_notifications] => all
[min_tags] => 0
[forum_type_id] => discussion
[type_config] => {"allowed_thread_types":["poll"]}
)
[_relations:protected] => Array
(
[Node] => XF\Entity\Node Object
(
[_uniqueEntityId:XF\Mvc\Entity\Entity:private] => 55
[rootClass:protected] => XF\Entity\Node
[_useReplaceInto:protected] =>
[_newValues:protected] => Array
(
)
[_values:protected] => Array
(
[node_id] => 2
[title] => SemiWiki Main Forum ( Ask the Experts! )
[description] => Post your questions to the experts here!
[node_name] =>
[node_type_id] => Forum
[parent_node_id] => 1
[display_order] => 1
[display_in_list] => 1
[lft] => 2
[rgt] => 3
[depth] => 1
[style_id] => 0
[effective_style_id] => 0
[breadcrumb_data] => {"1":{"node_id":1,"title":"Main Category","depth":0,"lft":1,"node_name":null,"node_type_id":"Category","display_in_list":true}}
[navigation_id] =>
[effective_navigation_id] =>
)
[_relations:protected] => Array
(
)
[_previousValues:protected] => Array
(
)
[_options:protected] => Array
(
)
[_deleted:protected] =>
[_readOnly:protected] =>
[_writePending:protected] =>
[_writeRunning:protected] =>
[_errors:protected] => Array
(
)
[_whenSaveable:protected] => Array
(
)
[_cascadeSave:protected] => Array
(
)
[_behaviors:protected] =>
)
)
[_previousValues:protected] => Array
(
)
[_options:protected] => Array
(
)
[_deleted:protected] =>
[_readOnly:protected] =>
[_writePending:protected] =>
[_writeRunning:protected] =>
[_errors:protected] => Array
(
)
[_whenSaveable:protected] => Array
(
)
[_cascadeSave:protected] => Array
(
)
[_behaviors:protected] =>
)
)
[_previousValues:protected] => Array
(
)
[_options:protected] => Array
(
)
[_deleted:protected] =>
[_readOnly:protected] =>
[_writePending:protected] =>
[_writeRunning:protected] =>
[_errors:protected] => Array
(
)
[_whenSaveable:protected] => Array
(
)
[_cascadeSave:protected] => Array
(
)
[_behaviors:protected] =>
)
[24493] => ThemeHouse\XPress\XF\Entity\Thread Object
(
[_uniqueEntityId:XF\Mvc\Entity\Entity:private] => 97
[rootClass:protected] => XF\Entity\Thread
[_useReplaceInto:protected] =>
[_newValues:protected] => Array
(
)
[_values:protected] => Array
(
[thread_id] => 24493
[node_id] => 2
[title] => Cerebras Systems Raises $1 Billion Series H
[reply_count] => 3
[view_count] => 262
[user_id] => 5
[username] => Daniel Nenni
[post_date] => 1770263765
[sticky] => 0
[discussion_state] => visible
[discussion_open] => 1
[discussion_type] => discussion
[first_post_id] => 97195
[first_post_reaction_score] => 2
[first_post_reactions] => {"1":2}
[last_post_date] => 1770312956
[last_post_id] => 97230
[last_post_user_id] => 1305
[last_post_username] => KevinK
[prefix_id] => 0
[tags] => []
[custom_fields] => []
[vote_score] => 0
[vote_count] => 0
[featured] => 0
[type_data] => []
[index_state] => default
)
[_relations:protected] => Array
(
[User] => ThemeHouse\XLink\XF\Entity\User Object
(
[_uniqueEntityId:XF\Mvc\Entity\Entity:private] => 54
[rootClass:protected] => XF\Entity\User
[_useReplaceInto:protected] =>
[_newValues:protected] => Array
(
)
[_values:protected] => Array
(
[user_id] => 5
[username] => Daniel Nenni
[username_date] => 0
[username_date_visible] => 0
[email] => dnenni@semiwiki.com
[custom_title] => Admin
[language_id] => 1
[style_id] => 0
[style_variation] =>
[timezone] => America/Los_Angeles
[visible] => 1
[activity_visible] => 1
[user_group_id] => 3
[secondary_group_ids] => 4,5,132
[display_style_group_id] => 3
[permission_combination_id] => 88
[message_count] => 15220
[question_solution_count] => 0
[conversations_unread] => 0
[register_date] => 1280720820
[last_activity] => 1770393156
[last_summary_email_date] => 1605968657
[trophy_points] => 113
[alerts_unviewed] => 143
[alerts_unread] => 143
[avatar_date] => 1663211649
[avatar_width] => 110
[avatar_height] => 107
[avatar_highdpi] => 0
[avatar_optimized] => 0
[gravatar] =>
[user_state] => valid
[security_lock] =>
[is_moderator] => 1
[is_admin] => 1
[is_banned] => 0
[reaction_score] => 9085
[warning_points] => 0
[is_staff] => 1
[secret_key] => 0HwyUVVHCwJotUUVEpvqAclfYJdGNPpw
[privacy_policy_accepted] => 0
[terms_accepted] => 0
[vote_score] => 0
)
[_relations:protected] => Array
(
)
[_previousValues:protected] => Array
(
)
[_options:protected] => Array
(
)
[_deleted:protected] =>
[_readOnly:protected] =>
[_writePending:protected] =>
[_writeRunning:protected] =>
[_errors:protected] => Array
(
)
[_whenSaveable:protected] => Array
(
)
[_cascadeSave:protected] => Array
(
)
[_behaviors:protected] =>
)
[Forum] => XF\Entity\Forum Object
(
[_uniqueEntityId:XF\Mvc\Entity\Entity:private] => 56
[rootClass:protected] => XF\Entity\Forum
[_useReplaceInto:protected] =>
[_newValues:protected] => Array
(
)
[_values:protected] => Array
(
[node_id] => 2
[discussion_count] => 8303
[message_count] => 60745
[last_post_id] => 97282
[last_post_date] => 1770407775
[last_post_user_id] => 333446
[last_post_username] => dkr1986
[last_thread_id] => 24495
[last_thread_title] => TSMC CEO flags 3-nanometre chip production in Japan, investment reported at $17 billion
[last_thread_prefix_id] => 0
[moderate_threads] => 0
[moderate_replies] => 0
[allow_posting] => 1
[count_messages] => 1
[auto_feature] => 0
[find_new] => 1
[allow_index] => allow
[index_criteria] =>
[field_cache] => []
[prefix_cache] => []
[prompt_cache] => []
[default_prefix_id] => 0
[default_sort_order] => last_post_date
[default_sort_direction] => desc
[list_date_limit_days] => 0
[require_prefix] => 0
[allowed_watch_notifications] => all
[min_tags] => 0
[forum_type_id] => discussion
[type_config] => {"allowed_thread_types":["poll"]}
)
[_relations:protected] => Array
(
[Node] => XF\Entity\Node Object
(
[_uniqueEntityId:XF\Mvc\Entity\Entity:private] => 55
[rootClass:protected] => XF\Entity\Node
[_useReplaceInto:protected] =>
[_newValues:protected] => Array
(
)
[_values:protected] => Array
(
[node_id] => 2
[title] => SemiWiki Main Forum ( Ask the Experts! )
[description] => Post your questions to the experts here!
[node_name] =>
[node_type_id] => Forum
[parent_node_id] => 1
[display_order] => 1
[display_in_list] => 1
[lft] => 2
[rgt] => 3
[depth] => 1
[style_id] => 0
[effective_style_id] => 0
[breadcrumb_data] => {"1":{"node_id":1,"title":"Main Category","depth":0,"lft":1,"node_name":null,"node_type_id":"Category","display_in_list":true}}
[navigation_id] =>
[effective_navigation_id] =>
)
[_relations:protected] => Array
(
)
[_previousValues:protected] => Array
(
)
[_options:protected] => Array
(
)
[_deleted:protected] =>
[_readOnly:protected] =>
[_writePending:protected] =>
[_writeRunning:protected] =>
[_errors:protected] => Array
(
)
[_whenSaveable:protected] => Array
(
)
[_cascadeSave:protected] => Array
(
)
[_behaviors:protected] =>
)
)
[_previousValues:protected] => Array
(
)
[_options:protected] => Array
(
)
[_deleted:protected] =>
[_readOnly:protected] =>
[_writePending:protected] =>
[_writeRunning:protected] =>
[_errors:protected] => Array
(
)
[_whenSaveable:protected] => Array
(
)
[_cascadeSave:protected] => Array
(
)
[_behaviors:protected] =>
)
)
[_previousValues:protected] => Array
(
)
[_options:protected] => Array
(
)
[_deleted:protected] =>
[_readOnly:protected] =>
[_writePending:protected] =>
[_writeRunning:protected] =>
[_errors:protected] => Array
(
)
[_whenSaveable:protected] => Array
(
)
[_cascadeSave:protected] => Array
(
)
[_behaviors:protected] =>
)
[24499] => ThemeHouse\XPress\XF\Entity\Thread Object
(
[_uniqueEntityId:XF\Mvc\Entity\Entity:private] => 101
[rootClass:protected] => XF\Entity\Thread
[_useReplaceInto:protected] =>
[_newValues:protected] => Array
(
)
[_values:protected] => Array
(
[thread_id] => 24499
[node_id] => 2
[title] => More Than Tariffs: The Political Economy Behind TSMC’s U.S. Expansion
[reply_count] => 0
[view_count] => 126
[user_id] => 398583
[username] => karin623
[post_date] => 1770307975
[sticky] => 0
[discussion_state] => visible
[discussion_open] => 1
[discussion_type] => discussion
[first_post_id] => 97224
[first_post_reaction_score] => 3
[first_post_reactions] => {"1":3}
[last_post_date] => 1770307975
[last_post_id] => 97224
[last_post_user_id] => 398583
[last_post_username] => karin623
[prefix_id] => 0
[tags] => []
[custom_fields] => []
[vote_score] => 0
[vote_count] => 0
[featured] => 0
[type_data] => []
[index_state] => default
)
[_relations:protected] => Array
(
[User] => ThemeHouse\XLink\XF\Entity\User Object
(
[_uniqueEntityId:XF\Mvc\Entity\Entity:private] => 98
[rootClass:protected] => XF\Entity\User
[_useReplaceInto:protected] =>
[_newValues:protected] => Array
(
)
[_values:protected] => Array
(
[user_id] => 398583
[username] => karin623
[username_date] => 0
[username_date_visible] => 0
[email] => karin623@gmail.com
[custom_title] =>
[language_id] => 1
[style_id] => 0
[style_variation] =>
[timezone] => Asia/Hong_Kong
[visible] => 1
[activity_visible] => 1
[user_group_id] => 2
[secondary_group_ids] =>
[display_style_group_id] => 2
[permission_combination_id] => 8
[message_count] => 34
[question_solution_count] => 0
[conversations_unread] => 0
[register_date] => 1748753435
[last_activity] => 1770307976
[last_summary_email_date] => 1756909222
[trophy_points] => 18
[alerts_unviewed] => 21
[alerts_unread] => 21
[avatar_date] => 0
[avatar_width] => 0
[avatar_height] => 0
[avatar_highdpi] => 0
[avatar_optimized] => 0
[gravatar] =>
[user_state] => valid
[security_lock] =>
[is_moderator] => 0
[is_admin] => 0
[is_banned] => 0
[reaction_score] => 58
[warning_points] => 0
[is_staff] => 0
[secret_key] => PBnrLVmUtkEL7YUKL8Ij_6L3tfKYRzDQ
[privacy_policy_accepted] => 1748753435
[terms_accepted] => 1748753435
[vote_score] => 0
)
[_relations:protected] => Array
(
)
[_previousValues:protected] => Array
(
)
[_options:protected] => Array
(
)
[_deleted:protected] =>
[_readOnly:protected] =>
[_writePending:protected] =>
[_writeRunning:protected] =>
[_errors:protected] => Array
(
)
[_whenSaveable:protected] => Array
(
)
[_cascadeSave:protected] => Array
(
)
[_behaviors:protected] =>
)
[Forum] => XF\Entity\Forum Object
(
[_uniqueEntityId:XF\Mvc\Entity\Entity:private] => 56
[rootClass:protected] => XF\Entity\Forum
[_useReplaceInto:protected] =>
[_newValues:protected] => Array
(
)
[_values:protected] => Array
(
[node_id] => 2
[discussion_count] => 8303
[message_count] => 60745
[last_post_id] => 97282
[last_post_date] => 1770407775
[last_post_user_id] => 333446
[last_post_username] => dkr1986
[last_thread_id] => 24495
[last_thread_title] => TSMC CEO flags 3-nanometre chip production in Japan, investment reported at $17 billion
[last_thread_prefix_id] => 0
[moderate_threads] => 0
[moderate_replies] => 0
[allow_posting] => 1
[count_messages] => 1
[auto_feature] => 0
[find_new] => 1
[allow_index] => allow
[index_criteria] =>
[field_cache] => []
[prefix_cache] => []
[prompt_cache] => []
[default_prefix_id] => 0
[default_sort_order] => last_post_date
[default_sort_direction] => desc
[list_date_limit_days] => 0
[require_prefix] => 0
[allowed_watch_notifications] => all
[min_tags] => 0
[forum_type_id] => discussion
[type_config] => {"allowed_thread_types":["poll"]}
)
[_relations:protected] => Array
(
[Node] => XF\Entity\Node Object
(
[_uniqueEntityId:XF\Mvc\Entity\Entity:private] => 55
[rootClass:protected] => XF\Entity\Node
[_useReplaceInto:protected] =>
[_newValues:protected] => Array
(
)
[_values:protected] => Array
(
[node_id] => 2
[title] => SemiWiki Main Forum ( Ask the Experts! )
[description] => Post your questions to the experts here!
[node_name] =>
[node_type_id] => Forum
[parent_node_id] => 1
[display_order] => 1
[display_in_list] => 1
[lft] => 2
[rgt] => 3
[depth] => 1
[style_id] => 0
[effective_style_id] => 0
[breadcrumb_data] => {"1":{"node_id":1,"title":"Main Category","depth":0,"lft":1,"node_name":null,"node_type_id":"Category","display_in_list":true}}
[navigation_id] =>
[effective_navigation_id] =>
)
[_relations:protected] => Array
(
)
[_previousValues:protected] => Array
(
)
[_options:protected] => Array
(
)
[_deleted:protected] =>
[_readOnly:protected] =>
[_writePending:protected] =>
[_writeRunning:protected] =>
[_errors:protected] => Array
(
)
[_whenSaveable:protected] => Array
(
)
[_cascadeSave:protected] => Array
(
)
[_behaviors:protected] =>
)
)
[_previousValues:protected] => Array
(
)
[_options:protected] => Array
(
)
[_deleted:protected] =>
[_readOnly:protected] =>
[_writePending:protected] =>
[_writeRunning:protected] =>
[_errors:protected] => Array
(
)
[_whenSaveable:protected] => Array
(
)
[_cascadeSave:protected] => Array
(
)
[_behaviors:protected] =>
)
)
[_previousValues:protected] => Array
(
)
[_options:protected] => Array
(
)
[_deleted:protected] =>
[_readOnly:protected] =>
[_writePending:protected] =>
[_writeRunning:protected] =>
[_errors:protected] => Array
(
)
[_whenSaveable:protected] => Array
(
)
[_cascadeSave:protected] => Array
(
)
[_behaviors:protected] =>
)
[24476] => ThemeHouse\XPress\XF\Entity\Thread Object
(
[_uniqueEntityId:XF\Mvc\Entity\Entity:private] => 105
[rootClass:protected] => XF\Entity\Thread
[_useReplaceInto:protected] =>
[_newValues:protected] => Array
(
)
[_values:protected] => Array
(
[thread_id] => 24476
[node_id] => 2
[title] => Bottlenecks in DRAM and HBM: Tailwind for China's Memory Industry
[reply_count] => 9
[view_count] => 970
[user_id] => 5185
[username] => Fred Chen
[post_date] => 1770092047
[sticky] => 0
[discussion_state] => visible
[discussion_open] => 1
[discussion_type] => discussion
[first_post_id] => 97107
[first_post_reaction_score] => 1
[first_post_reactions] => {"1":1}
[last_post_date] => 1770301908
[last_post_id] => 97219
[last_post_user_id] => 442008
[last_post_username] => RogerWilliams
[prefix_id] => 0
[tags] => []
[custom_fields] => []
[vote_score] => 0
[vote_count] => 0
[featured] => 0
[type_data] => []
[index_state] => default
)
[_relations:protected] => Array
(
[User] => ThemeHouse\XLink\XF\Entity\User Object
(
[_uniqueEntityId:XF\Mvc\Entity\Entity:private] => 74
[rootClass:protected] => XF\Entity\User
[_useReplaceInto:protected] =>
[_newValues:protected] => Array
(
)
[_values:protected] => Array
(
[user_id] => 5185
[username] => Fred Chen
[username_date] => 0
[username_date_visible] => 0
[email] => chen.t.fred@gmail.com
[custom_title] =>
[language_id] => 1
[style_id] => 0
[style_variation] =>
[timezone] => America/Los_Angeles
[visible] => 1
[activity_visible] => 1
[user_group_id] => 4
[secondary_group_ids] =>
[display_style_group_id] => 4
[permission_combination_id] => 92
[message_count] => 2519
[question_solution_count] => 0
[conversations_unread] => 0
[register_date] => 1333032401
[last_activity] => 1770380409
[last_summary_email_date] => 1605940563
[trophy_points] => 113
[alerts_unviewed] => 2
[alerts_unread] => 2
[avatar_date] => 0
[avatar_width] => 0
[avatar_height] => 0
[avatar_highdpi] => 0
[avatar_optimized] => 0
[gravatar] =>
[user_state] => valid
[security_lock] =>
[is_moderator] => 0
[is_admin] => 0
[is_banned] => 0
[reaction_score] => 1825
[warning_points] => 0
[is_staff] => 0
[secret_key] => 5m-bZq0HRSi9VA-96QONHJeevdQas5S8
[privacy_policy_accepted] => 0
[terms_accepted] => 0
[vote_score] => 0
)
[_relations:protected] => Array
(
)
[_previousValues:protected] => Array
(
)
[_options:protected] => Array
(
)
[_deleted:protected] =>
[_readOnly:protected] =>
[_writePending:protected] =>
[_writeRunning:protected] =>
[_errors:protected] => Array
(
)
[_whenSaveable:protected] => Array
(
)
[_cascadeSave:protected] => Array
(
)
[_behaviors:protected] =>
)
[Forum] => XF\Entity\Forum Object
(
[_uniqueEntityId:XF\Mvc\Entity\Entity:private] => 56
[rootClass:protected] => XF\Entity\Forum
[_useReplaceInto:protected] =>
[_newValues:protected] => Array
(
)
[_values:protected] => Array
(
[node_id] => 2
[discussion_count] => 8303
[message_count] => 60745
[last_post_id] => 97282
[last_post_date] => 1770407775
[last_post_user_id] => 333446
[last_post_username] => dkr1986
[last_thread_id] => 24495
[last_thread_title] => TSMC CEO flags 3-nanometre chip production in Japan, investment reported at $17 billion
[last_thread_prefix_id] => 0
[moderate_threads] => 0
[moderate_replies] => 0
[allow_posting] => 1
[count_messages] => 1
[auto_feature] => 0
[find_new] => 1
[allow_index] => allow
[index_criteria] =>
[field_cache] => []
[prefix_cache] => []
[prompt_cache] => []
[default_prefix_id] => 0
[default_sort_order] => last_post_date
[default_sort_direction] => desc
[list_date_limit_days] => 0
[require_prefix] => 0
[allowed_watch_notifications] => all
[min_tags] => 0
[forum_type_id] => discussion
[type_config] => {"allowed_thread_types":["poll"]}
)
[_relations:protected] => Array
(
[Node] => XF\Entity\Node Object
(
[_uniqueEntityId:XF\Mvc\Entity\Entity:private] => 55
[rootClass:protected] => XF\Entity\Node
[_useReplaceInto:protected] =>
[_newValues:protected] => Array
(
)
[_values:protected] => Array
(
[node_id] => 2
[title] => SemiWiki Main Forum ( Ask the Experts! )
[description] => Post your questions to the experts here!
[node_name] =>
[node_type_id] => Forum
[parent_node_id] => 1
[display_order] => 1
[display_in_list] => 1
[lft] => 2
[rgt] => 3
[depth] => 1
[style_id] => 0
[effective_style_id] => 0
[breadcrumb_data] => {"1":{"node_id":1,"title":"Main Category","depth":0,"lft":1,"node_name":null,"node_type_id":"Category","display_in_list":true}}
[navigation_id] =>
[effective_navigation_id] =>
)
[_relations:protected] => Array
(
)
[_previousValues:protected] => Array
(
)
[_options:protected] => Array
(
)
[_deleted:protected] =>
[_readOnly:protected] =>
[_writePending:protected] =>
[_writeRunning:protected] =>
[_errors:protected] => Array
(
)
[_whenSaveable:protected] => Array
(
)
[_cascadeSave:protected] => Array
(
)
[_behaviors:protected] =>
)
)
[_previousValues:protected] => Array
(
)
[_options:protected] => Array
(
)
[_deleted:protected] =>
[_readOnly:protected] =>
[_writePending:protected] =>
[_writeRunning:protected] =>
[_errors:protected] => Array
(
)
[_whenSaveable:protected] => Array
(
)
[_cascadeSave:protected] => Array
(
)
[_behaviors:protected] =>
)
)
[_previousValues:protected] => Array
(
)
[_options:protected] => Array
(
)
[_deleted:protected] =>
[_readOnly:protected] =>
[_writePending:protected] =>
[_writeRunning:protected] =>
[_errors:protected] => Array
(
)
[_whenSaveable:protected] => Array
(
)
[_cascadeSave:protected] => Array
(
)
[_behaviors:protected] =>
)
[24482] => ThemeHouse\XPress\XF\Entity\Thread Object
(
[_uniqueEntityId:XF\Mvc\Entity\Entity:private] => 109
[rootClass:protected] => XF\Entity\Thread
[_useReplaceInto:protected] =>
[_newValues:protected] => Array
(
)
[_values:protected] => Array
(
[thread_id] => 24482
[node_id] => 2
[title] => Intel 14A risk production in 2028, HVM in 2029: Lip-Bu Tan at CISCO AI Summit 3 Feb 2026
[reply_count] => 12
[view_count] => 1031
[user_id] => 19450
[username] => user nl
[post_date] => 1770199009
[sticky] => 0
[discussion_state] => visible
[discussion_open] => 1
[discussion_type] => discussion
[first_post_id] => 97143
[first_post_reaction_score] => 1
[first_post_reactions] => {"1":1}
[last_post_date] => 1770286167
[last_post_id] => 97212
[last_post_user_id] => 6522
[last_post_username] => IanD
[prefix_id] => 0
[tags] => []
[custom_fields] => []
[vote_score] => 0
[vote_count] => 0
[featured] => 0
[type_data] => []
[index_state] => default
)
[_relations:protected] => Array
(
[User] => ThemeHouse\XLink\XF\Entity\User Object
(
[_uniqueEntityId:XF\Mvc\Entity\Entity:private] => 62
[rootClass:protected] => XF\Entity\User
[_useReplaceInto:protected] =>
[_newValues:protected] => Array
(
)
[_values:protected] => Array
(
[user_id] => 19450
[username] => user nl
[username_date] => 0
[username_date_visible] => 0
[email] => mauricehmjanssen@gmail.com
[custom_title] =>
[language_id] => 1
[style_id] => 0
[style_variation] =>
[timezone] => Europe/Amsterdam
[visible] => 1
[activity_visible] => 1
[user_group_id] => 2
[secondary_group_ids] =>
[display_style_group_id] => 2
[permission_combination_id] => 8
[message_count] => 424
[question_solution_count] => 0
[conversations_unread] => 0
[register_date] => 1424291496
[last_activity] => 1770405289
[last_summary_email_date] =>
[trophy_points] => 63
[alerts_unviewed] => 0
[alerts_unread] => 0
[avatar_date] => 1726169369
[avatar_width] => 384
[avatar_height] => 384
[avatar_highdpi] => 1
[avatar_optimized] => 0
[gravatar] =>
[user_state] => valid
[security_lock] =>
[is_moderator] => 0
[is_admin] => 0
[is_banned] => 0
[reaction_score] => 319
[warning_points] => 0
[is_staff] => 0
[secret_key] => V-1lb5_AW69yhzqA5ok9b64U0fMjJiqf
[privacy_policy_accepted] => 0
[terms_accepted] => 0
[vote_score] => 0
)
[_relations:protected] => Array
(
)
[_previousValues:protected] => Array
(
)
[_options:protected] => Array
(
)
[_deleted:protected] =>
[_readOnly:protected] =>
[_writePending:protected] =>
[_writeRunning:protected] =>
[_errors:protected] => Array
(
)
[_whenSaveable:protected] => Array
(
)
[_cascadeSave:protected] => Array
(
)
[_behaviors:protected] =>
)
[Forum] => XF\Entity\Forum Object
(
[_uniqueEntityId:XF\Mvc\Entity\Entity:private] => 56
[rootClass:protected] => XF\Entity\Forum
[_useReplaceInto:protected] =>
[_newValues:protected] => Array
(
)
[_values:protected] => Array
(
[node_id] => 2
[discussion_count] => 8303
[message_count] => 60745
[last_post_id] => 97282
[last_post_date] => 1770407775
[last_post_user_id] => 333446
[last_post_username] => dkr1986
[last_thread_id] => 24495
[last_thread_title] => TSMC CEO flags 3-nanometre chip production in Japan, investment reported at $17 billion
[last_thread_prefix_id] => 0
[moderate_threads] => 0
[moderate_replies] => 0
[allow_posting] => 1
[count_messages] => 1
[auto_feature] => 0
[find_new] => 1
[allow_index] => allow
[index_criteria] =>
[field_cache] => []
[prefix_cache] => []
[prompt_cache] => []
[default_prefix_id] => 0
[default_sort_order] => last_post_date
[default_sort_direction] => desc
[list_date_limit_days] => 0
[require_prefix] => 0
[allowed_watch_notifications] => all
[min_tags] => 0
[forum_type_id] => discussion
[type_config] => {"allowed_thread_types":["poll"]}
)
[_relations:protected] => Array
(
[Node] => XF\Entity\Node Object
(
[_uniqueEntityId:XF\Mvc\Entity\Entity:private] => 55
[rootClass:protected] => XF\Entity\Node
[_useReplaceInto:protected] =>
[_newValues:protected] => Array
(
)
[_values:protected] => Array
(
[node_id] => 2
[title] => SemiWiki Main Forum ( Ask the Experts! )
[description] => Post your questions to the experts here!
[node_name] =>
[node_type_id] => Forum
[parent_node_id] => 1
[display_order] => 1
[display_in_list] => 1
[lft] => 2
[rgt] => 3
[depth] => 1
[style_id] => 0
[effective_style_id] => 0
[breadcrumb_data] => {"1":{"node_id":1,"title":"Main Category","depth":0,"lft":1,"node_name":null,"node_type_id":"Category","display_in_list":true}}
[navigation_id] =>
[effective_navigation_id] =>
)
[_relations:protected] => Array
(
)
[_previousValues:protected] => Array
(
)
[_options:protected] => Array
(
)
[_deleted:protected] =>
[_readOnly:protected] =>
[_writePending:protected] =>
[_writeRunning:protected] =>
[_errors:protected] => Array
(
)
[_whenSaveable:protected] => Array
(
)
[_cascadeSave:protected] => Array
(
)
[_behaviors:protected] =>
)
)
[_previousValues:protected] => Array
(
)
[_options:protected] => Array
(
)
[_deleted:protected] =>
[_readOnly:protected] =>
[_writePending:protected] =>
[_writeRunning:protected] =>
[_errors:protected] => Array
(
)
[_whenSaveable:protected] => Array
(
)
[_cascadeSave:protected] => Array
(
)
[_behaviors:protected] =>
)
)
[_previousValues:protected] => Array
(
)
[_options:protected] => Array
(
)
[_deleted:protected] =>
[_readOnly:protected] =>
[_writePending:protected] =>
[_writeRunning:protected] =>
[_errors:protected] => Array
(
)
[_whenSaveable:protected] => Array
(
)
[_cascadeSave:protected] => Array
(
)
[_behaviors:protected] =>
)
[24411] => ThemeHouse\XPress\XF\Entity\Thread Object
(
[_uniqueEntityId:XF\Mvc\Entity\Entity:private] => 113
[rootClass:protected] => XF\Entity\Thread
[_useReplaceInto:protected] =>
[_newValues:protected] => Array
(
)
[_values:protected] => Array
(
[thread_id] => 24411
[node_id] => 2
[title] => Intel Foundry is way behind TSMC, but the goal is #2 by 2030
[reply_count] => 73
[view_count] => 12247
[user_id] => 90385
[username] => NY_Sam2
[post_date] => 1769271589
[sticky] => 0
[discussion_state] => visible
[discussion_open] => 1
[discussion_type] => discussion
[first_post_id] => 96783
[first_post_reaction_score] => 4
[first_post_reactions] => {"1":4}
[last_post_date] => 1770283533
[last_post_id] => 97209
[last_post_user_id] => 19450
[last_post_username] => user nl
[prefix_id] => 0
[tags] => []
[custom_fields] => []
[vote_score] => 0
[vote_count] => 0
[featured] => 0
[type_data] => []
[index_state] => default
)
[_relations:protected] => Array
(
[User] => ThemeHouse\XLink\XF\Entity\User Object
(
[_uniqueEntityId:XF\Mvc\Entity\Entity:private] => 110
[rootClass:protected] => XF\Entity\User
[_useReplaceInto:protected] =>
[_newValues:protected] => Array
(
)
[_values:protected] => Array
(
[user_id] => 90385
[username] => NY_Sam2
[username_date] => 0
[username_date_visible] => 0
[email] => petekennedy1989@gmail.com
[custom_title] =>
[language_id] => 1
[style_id] => 0
[style_variation] =>
[timezone] => America/New_York
[visible] => 1
[activity_visible] => 1
[user_group_id] => 2
[secondary_group_ids] =>
[display_style_group_id] => 2
[permission_combination_id] => 8
[message_count] => 16
[question_solution_count] => 0
[conversations_unread] => 0
[register_date] => 1642621712
[last_activity] => 1770267020
[last_summary_email_date] => 1767709207
[trophy_points] => 3
[alerts_unviewed] => 28
[alerts_unread] => 28
[avatar_date] => 0
[avatar_width] => 0
[avatar_height] => 0
[avatar_highdpi] => 0
[avatar_optimized] => 0
[gravatar] =>
[user_state] => valid
[security_lock] =>
[is_moderator] => 0
[is_admin] => 0
[is_banned] => 0
[reaction_score] => 26
[warning_points] => 0
[is_staff] => 0
[secret_key] => egi-LmWHpsbQRZ7Y0Lk56hMyhUsrDhDE
[privacy_policy_accepted] => 1642621712
[terms_accepted] => 1642621712
[vote_score] => 0
)
[_relations:protected] => Array
(
)
[_previousValues:protected] => Array
(
)
[_options:protected] => Array
(
)
[_deleted:protected] =>
[_readOnly:protected] =>
[_writePending:protected] =>
[_writeRunning:protected] =>
[_errors:protected] => Array
(
)
[_whenSaveable:protected] => Array
(
)
[_cascadeSave:protected] => Array
(
)
[_behaviors:protected] =>
)
[Forum] => XF\Entity\Forum Object
(
[_uniqueEntityId:XF\Mvc\Entity\Entity:private] => 56
[rootClass:protected] => XF\Entity\Forum
[_useReplaceInto:protected] =>
[_newValues:protected] => Array
(
)
[_values:protected] => Array
(
[node_id] => 2
[discussion_count] => 8303
[message_count] => 60745
[last_post_id] => 97282
[last_post_date] => 1770407775
[last_post_user_id] => 333446
[last_post_username] => dkr1986
[last_thread_id] => 24495
[last_thread_title] => TSMC CEO flags 3-nanometre chip production in Japan, investment reported at $17 billion
[last_thread_prefix_id] => 0
[moderate_threads] => 0
[moderate_replies] => 0
[allow_posting] => 1
[count_messages] => 1
[auto_feature] => 0
[find_new] => 1
[allow_index] => allow
[index_criteria] =>
[field_cache] => []
[prefix_cache] => []
[prompt_cache] => []
[default_prefix_id] => 0
[default_sort_order] => last_post_date
[default_sort_direction] => desc
[list_date_limit_days] => 0
[require_prefix] => 0
[allowed_watch_notifications] => all
[min_tags] => 0
[forum_type_id] => discussion
[type_config] => {"allowed_thread_types":["poll"]}
)
[_relations:protected] => Array
(
[Node] => XF\Entity\Node Object
(
[_uniqueEntityId:XF\Mvc\Entity\Entity:private] => 55
[rootClass:protected] => XF\Entity\Node
[_useReplaceInto:protected] =>
[_newValues:protected] => Array
(
)
[_values:protected] => Array
(
[node_id] => 2
[title] => SemiWiki Main Forum ( Ask the Experts! )
[description] => Post your questions to the experts here!
[node_name] =>
[node_type_id] => Forum
[parent_node_id] => 1
[display_order] => 1
[display_in_list] => 1
[lft] => 2
[rgt] => 3
[depth] => 1
[style_id] => 0
[effective_style_id] => 0
[breadcrumb_data] => {"1":{"node_id":1,"title":"Main Category","depth":0,"lft":1,"node_name":null,"node_type_id":"Category","display_in_list":true}}
[navigation_id] =>
[effective_navigation_id] =>
)
[_relations:protected] => Array
(
)
[_previousValues:protected] => Array
(
)
[_options:protected] => Array
(
)
[_deleted:protected] =>
[_readOnly:protected] =>
[_writePending:protected] =>
[_writeRunning:protected] =>
[_errors:protected] => Array
(
)
[_whenSaveable:protected] => Array
(
)
[_cascadeSave:protected] => Array
(
)
[_behaviors:protected] =>
)
)
[_previousValues:protected] => Array
(
)
[_options:protected] => Array
(
)
[_deleted:protected] =>
[_readOnly:protected] =>
[_writePending:protected] =>
[_writeRunning:protected] =>
[_errors:protected] => Array
(
)
[_whenSaveable:protected] => Array
(
)
[_cascadeSave:protected] => Array
(
)
[_behaviors:protected] =>
)
)
[_previousValues:protected] => Array
(
)
[_options:protected] => Array
(
)
[_deleted:protected] =>
[_readOnly:protected] =>
[_writePending:protected] =>
[_writeRunning:protected] =>
[_errors:protected] => Array
(
)
[_whenSaveable:protected] => Array
(
)
[_cascadeSave:protected] => Array
(
)
[_behaviors:protected] =>
)
[24494] => ThemeHouse\XPress\XF\Entity\Thread Object
(
[_uniqueEntityId:XF\Mvc\Entity\Entity:private] => 117
[rootClass:protected] => XF\Entity\Thread
[_useReplaceInto:protected] =>
[_newValues:protected] => Array
(
)
[_values:protected] => Array
(
[thread_id] => 24494
[node_id] => 2
[title] => Changxin Storage's low-price sell-off of DDR4 reported incorrectly
[reply_count] => 1
[view_count] => 146
[user_id] => 5185
[username] => Fred Chen
[post_date] => 1770265106
[sticky] => 0
[discussion_state] => visible
[discussion_open] => 1
[discussion_type] => discussion
[first_post_id] => 97197
[first_post_reaction_score] => 0
[first_post_reactions] => []
[last_post_date] => 1770265284
[last_post_id] => 97199
[last_post_user_id] => 5185
[last_post_username] => Fred Chen
[prefix_id] => 0
[tags] => []
[custom_fields] => []
[vote_score] => 0
[vote_count] => 0
[featured] => 0
[type_data] => []
[index_state] => default
)
[_relations:protected] => Array
(
[User] => ThemeHouse\XLink\XF\Entity\User Object
(
[_uniqueEntityId:XF\Mvc\Entity\Entity:private] => 74
[rootClass:protected] => XF\Entity\User
[_useReplaceInto:protected] =>
[_newValues:protected] => Array
(
)
[_values:protected] => Array
(
[user_id] => 5185
[username] => Fred Chen
[username_date] => 0
[username_date_visible] => 0
[email] => chen.t.fred@gmail.com
[custom_title] =>
[language_id] => 1
[style_id] => 0
[style_variation] =>
[timezone] => America/Los_Angeles
[visible] => 1
[activity_visible] => 1
[user_group_id] => 4
[secondary_group_ids] =>
[display_style_group_id] => 4
[permission_combination_id] => 92
[message_count] => 2519
[question_solution_count] => 0
[conversations_unread] => 0
[register_date] => 1333032401
[last_activity] => 1770380409
[last_summary_email_date] => 1605940563
[trophy_points] => 113
[alerts_unviewed] => 2
[alerts_unread] => 2
[avatar_date] => 0
[avatar_width] => 0
[avatar_height] => 0
[avatar_highdpi] => 0
[avatar_optimized] => 0
[gravatar] =>
[user_state] => valid
[security_lock] =>
[is_moderator] => 0
[is_admin] => 0
[is_banned] => 0
[reaction_score] => 1825
[warning_points] => 0
[is_staff] => 0
[secret_key] => 5m-bZq0HRSi9VA-96QONHJeevdQas5S8
[privacy_policy_accepted] => 0
[terms_accepted] => 0
[vote_score] => 0
)
[_relations:protected] => Array
(
)
[_previousValues:protected] => Array
(
)
[_options:protected] => Array
(
)
[_deleted:protected] =>
[_readOnly:protected] =>
[_writePending:protected] =>
[_writeRunning:protected] =>
[_errors:protected] => Array
(
)
[_whenSaveable:protected] => Array
(
)
[_cascadeSave:protected] => Array
(
)
[_behaviors:protected] =>
)
[Forum] => XF\Entity\Forum Object
(
[_uniqueEntityId:XF\Mvc\Entity\Entity:private] => 56
[rootClass:protected] => XF\Entity\Forum
[_useReplaceInto:protected] =>
[_newValues:protected] => Array
(
)
[_values:protected] => Array
(
[node_id] => 2
[discussion_count] => 8303
[message_count] => 60745
[last_post_id] => 97282
[last_post_date] => 1770407775
[last_post_user_id] => 333446
[last_post_username] => dkr1986
[last_thread_id] => 24495
[last_thread_title] => TSMC CEO flags 3-nanometre chip production in Japan, investment reported at $17 billion
[last_thread_prefix_id] => 0
[moderate_threads] => 0
[moderate_replies] => 0
[allow_posting] => 1
[count_messages] => 1
[auto_feature] => 0
[find_new] => 1
[allow_index] => allow
[index_criteria] =>
[field_cache] => []
[prefix_cache] => []
[prompt_cache] => []
[default_prefix_id] => 0
[default_sort_order] => last_post_date
[default_sort_direction] => desc
[list_date_limit_days] => 0
[require_prefix] => 0
[allowed_watch_notifications] => all
[min_tags] => 0
[forum_type_id] => discussion
[type_config] => {"allowed_thread_types":["poll"]}
)
[_relations:protected] => Array
(
[Node] => XF\Entity\Node Object
(
[_uniqueEntityId:XF\Mvc\Entity\Entity:private] => 55
[rootClass:protected] => XF\Entity\Node
[_useReplaceInto:protected] =>
[_newValues:protected] => Array
(
)
[_values:protected] => Array
(
[node_id] => 2
[title] => SemiWiki Main Forum ( Ask the Experts! )
[description] => Post your questions to the experts here!
[node_name] =>
[node_type_id] => Forum
[parent_node_id] => 1
[display_order] => 1
[display_in_list] => 1
[lft] => 2
[rgt] => 3
[depth] => 1
[style_id] => 0
[effective_style_id] => 0
[breadcrumb_data] => {"1":{"node_id":1,"title":"Main Category","depth":0,"lft":1,"node_name":null,"node_type_id":"Category","display_in_list":true}}
[navigation_id] =>
[effective_navigation_id] =>
)
[_relations:protected] => Array
(
)
[_previousValues:protected] => Array
(
)
[_options:protected] => Array
(
)
[_deleted:protected] =>
[_readOnly:protected] =>
[_writePending:protected] =>
[_writeRunning:protected] =>
[_errors:protected] => Array
(
)
[_whenSaveable:protected] => Array
(
)
[_cascadeSave:protected] => Array
(
)
[_behaviors:protected] =>
)
)
[_previousValues:protected] => Array
(
)
[_options:protected] => Array
(
)
[_deleted:protected] =>
[_readOnly:protected] =>
[_writePending:protected] =>
[_writeRunning:protected] =>
[_errors:protected] => Array
(
)
[_whenSaveable:protected] => Array
(
)
[_cascadeSave:protected] => Array
(
)
[_behaviors:protected] =>
)
)
[_previousValues:protected] => Array
(
)
[_options:protected] => Array
(
)
[_deleted:protected] =>
[_readOnly:protected] =>
[_writePending:protected] =>
[_writeRunning:protected] =>
[_errors:protected] => Array
(
)
[_whenSaveable:protected] => Array
(
)
[_cascadeSave:protected] => Array
(
)
[_behaviors:protected] =>
)
[24491] => ThemeHouse\XPress\XF\Entity\Thread Object
(
[_uniqueEntityId:XF\Mvc\Entity\Entity:private] => 121
[rootClass:protected] => XF\Entity\Thread
[_useReplaceInto:protected] =>
[_newValues:protected] => Array
(
)
[_values:protected] => Array
(
[thread_id] => 24491
[node_id] => 2
[title] => Google parent beats on revenue, projects significant AI spending increase
[reply_count] => 1
[view_count] => 159
[user_id] => 36640
[username] => soAsian
[post_date] => 1770243524
[sticky] => 0
[discussion_state] => visible
[discussion_open] => 1
[discussion_type] => discussion
[first_post_id] => 97185
[first_post_reaction_score] => 1
[first_post_reactions] => {"1":1}
[last_post_date] => 1770246909
[last_post_id] => 97186
[last_post_user_id] => 14042
[last_post_username] => hist78
[prefix_id] => 0
[tags] => []
[custom_fields] => []
[vote_score] => 0
[vote_count] => 0
[featured] => 0
[type_data] => []
[index_state] => default
)
[_relations:protected] => Array
(
[User] => ThemeHouse\XLink\XF\Entity\User Object
(
[_uniqueEntityId:XF\Mvc\Entity\Entity:private] => 90
[rootClass:protected] => XF\Entity\User
[_useReplaceInto:protected] =>
[_newValues:protected] => Array
(
)
[_values:protected] => Array
(
[user_id] => 36640
[username] => soAsian
[username_date] => 0
[username_date_visible] => 0
[email] => jackmtsai@gmail.com
[custom_title] =>
[language_id] => 1
[style_id] => 0
[style_variation] =>
[timezone] => America/Chicago
[visible] => 1
[activity_visible] => 1
[user_group_id] => 2
[secondary_group_ids] =>
[display_style_group_id] => 2
[permission_combination_id] => 8
[message_count] => 394
[question_solution_count] => 0
[conversations_unread] => 0
[register_date] => 1608139716
[last_activity] => 1770408559
[last_summary_email_date] => 1719670845
[trophy_points] => 63
[alerts_unviewed] => 0
[alerts_unread] => 0
[avatar_date] => 0
[avatar_width] => 0
[avatar_height] => 0
[avatar_highdpi] => 0
[avatar_optimized] => 0
[gravatar] =>
[user_state] => valid
[security_lock] =>
[is_moderator] => 0
[is_admin] => 0
[is_banned] => 0
[reaction_score] => 357
[warning_points] => 0
[is_staff] => 0
[secret_key] => 2oKeCTFkGUpMro5tcmj7WaY9HksB13Kw
[privacy_policy_accepted] => 1608139716
[terms_accepted] => 1608139716
[vote_score] => 0
)
[_relations:protected] => Array
(
)
[_previousValues:protected] => Array
(
)
[_options:protected] => Array
(
)
[_deleted:protected] =>
[_readOnly:protected] =>
[_writePending:protected] =>
[_writeRunning:protected] =>
[_errors:protected] => Array
(
)
[_whenSaveable:protected] => Array
(
)
[_cascadeSave:protected] => Array
(
)
[_behaviors:protected] =>
)
[Forum] => XF\Entity\Forum Object
(
[_uniqueEntityId:XF\Mvc\Entity\Entity:private] => 56
[rootClass:protected] => XF\Entity\Forum
[_useReplaceInto:protected] =>
[_newValues:protected] => Array
(
)
[_values:protected] => Array
(
[node_id] => 2
[discussion_count] => 8303
[message_count] => 60745
[last_post_id] => 97282
[last_post_date] => 1770407775
[last_post_user_id] => 333446
[last_post_username] => dkr1986
[last_thread_id] => 24495
[last_thread_title] => TSMC CEO flags 3-nanometre chip production in Japan, investment reported at $17 billion
[last_thread_prefix_id] => 0
[moderate_threads] => 0
[moderate_replies] => 0
[allow_posting] => 1
[count_messages] => 1
[auto_feature] => 0
[find_new] => 1
[allow_index] => allow
[index_criteria] =>
[field_cache] => []
[prefix_cache] => []
[prompt_cache] => []
[default_prefix_id] => 0
[default_sort_order] => last_post_date
[default_sort_direction] => desc
[list_date_limit_days] => 0
[require_prefix] => 0
[allowed_watch_notifications] => all
[min_tags] => 0
[forum_type_id] => discussion
[type_config] => {"allowed_thread_types":["poll"]}
)
[_relations:protected] => Array
(
[Node] => XF\Entity\Node Object
(
[_uniqueEntityId:XF\Mvc\Entity\Entity:private] => 55
[rootClass:protected] => XF\Entity\Node
[_useReplaceInto:protected] =>
[_newValues:protected] => Array
(
)
[_values:protected] => Array
(
[node_id] => 2
[title] => SemiWiki Main Forum ( Ask the Experts! )
[description] => Post your questions to the experts here!
[node_name] =>
[node_type_id] => Forum
[parent_node_id] => 1
[display_order] => 1
[display_in_list] => 1
[lft] => 2
[rgt] => 3
[depth] => 1
[style_id] => 0
[effective_style_id] => 0
[breadcrumb_data] => {"1":{"node_id":1,"title":"Main Category","depth":0,"lft":1,"node_name":null,"node_type_id":"Category","display_in_list":true}}
[navigation_id] =>
[effective_navigation_id] =>
)
[_relations:protected] => Array
(
)
[_previousValues:protected] => Array
(
)
[_options:protected] => Array
(
)
[_deleted:protected] =>
[_readOnly:protected] =>
[_writePending:protected] =>
[_writeRunning:protected] =>
[_errors:protected] => Array
(
)
[_whenSaveable:protected] => Array
(
)
[_cascadeSave:protected] => Array
(
)
[_behaviors:protected] =>
)
)
[_previousValues:protected] => Array
(
)
[_options:protected] => Array
(
)
[_deleted:protected] =>
[_readOnly:protected] =>
[_writePending:protected] =>
[_writeRunning:protected] =>
[_errors:protected] => Array
(
)
[_whenSaveable:protected] => Array
(
)
[_cascadeSave:protected] => Array
(
)
[_behaviors:protected] =>
)
)
[_previousValues:protected] => Array
(
)
[_options:protected] => Array
(
)
[_deleted:protected] =>
[_readOnly:protected] =>
[_writePending:protected] =>
[_writeRunning:protected] =>
[_errors:protected] => Array
(
)
[_whenSaveable:protected] => Array
(
)
[_cascadeSave:protected] => Array
(
)
[_behaviors:protected] =>
)
[24484] => ThemeHouse\XPress\XF\Entity\Thread Object
(
[_uniqueEntityId:XF\Mvc\Entity\Entity:private] => 125
[rootClass:protected] => XF\Entity\Thread
[_useReplaceInto:protected] =>
[_newValues:protected] => Array
(
)
[_values:protected] => Array
(
[thread_id] => 24484
[node_id] => 2
[title] => (Anecdote) - Mobile x86 / memory supply for corporate laptops
[reply_count] => 4
[view_count] => 270
[user_id] => 35301
[username] => Xebec
[post_date] => 1770217642
[sticky] => 0
[discussion_state] => visible
[discussion_open] => 1
[discussion_type] => discussion
[first_post_id] => 97150
[first_post_reaction_score] => 4
[first_post_reactions] => {"1":4}
[last_post_date] => 1770236944
[last_post_id] => 97176
[last_post_user_id] => 35301
[last_post_username] => Xebec
[prefix_id] => 0
[tags] => []
[custom_fields] => []
[vote_score] => 0
[vote_count] => 0
[featured] => 0
[type_data] => []
[index_state] => default
)
[_relations:protected] => Array
(
[User] => ThemeHouse\XLink\XF\Entity\User Object
(
[_uniqueEntityId:XF\Mvc\Entity\Entity:private] => 122
[rootClass:protected] => XF\Entity\User
[_useReplaceInto:protected] =>
[_newValues:protected] => Array
(
)
[_values:protected] => Array
(
[user_id] => 35301
[username] => Xebec
[username_date] => 0
[username_date_visible] => 0
[email] => john.heritage@gmail.com
[custom_title] =>
[language_id] => 1
[style_id] => 0
[style_variation] =>
[timezone] => America/New_York
[visible] => 1
[activity_visible] => 1
[user_group_id] => 2
[secondary_group_ids] =>
[display_style_group_id] => 2
[permission_combination_id] => 8
[message_count] => 1557
[question_solution_count] => 0
[conversations_unread] => 0
[register_date] => 1598710106
[last_activity] => 1770399667
[last_summary_email_date] => 1631629203
[trophy_points] => 113
[alerts_unviewed] => 0
[alerts_unread] => 0
[avatar_date] => 1760746858
[avatar_width] => 480
[avatar_height] => 384
[avatar_highdpi] => 1
[avatar_optimized] => 0
[gravatar] =>
[user_state] => valid
[security_lock] =>
[is_moderator] => 0
[is_admin] => 0
[is_banned] => 0
[reaction_score] => 1915
[warning_points] => 0
[is_staff] => 0
[secret_key] => Y7XyJgQMBi7ZiDtuAyqNGDrBQQsi8JB4
[privacy_policy_accepted] => 1598710106
[terms_accepted] => 1598710106
[vote_score] => 0
)
[_relations:protected] => Array
(
)
[_previousValues:protected] => Array
(
)
[_options:protected] => Array
(
)
[_deleted:protected] =>
[_readOnly:protected] =>
[_writePending:protected] =>
[_writeRunning:protected] =>
[_errors:protected] => Array
(
)
[_whenSaveable:protected] => Array
(
)
[_cascadeSave:protected] => Array
(
)
[_behaviors:protected] =>
)
[Forum] => XF\Entity\Forum Object
(
[_uniqueEntityId:XF\Mvc\Entity\Entity:private] => 56
[rootClass:protected] => XF\Entity\Forum
[_useReplaceInto:protected] =>
[_newValues:protected] => Array
(
)
[_values:protected] => Array
(
[node_id] => 2
[discussion_count] => 8303
[message_count] => 60745
[last_post_id] => 97282
[last_post_date] => 1770407775
[last_post_user_id] => 333446
[last_post_username] => dkr1986
[last_thread_id] => 24495
[last_thread_title] => TSMC CEO flags 3-nanometre chip production in Japan, investment reported at $17 billion
[last_thread_prefix_id] => 0
[moderate_threads] => 0
[moderate_replies] => 0
[allow_posting] => 1
[count_messages] => 1
[auto_feature] => 0
[find_new] => 1
[allow_index] => allow
[index_criteria] =>
[field_cache] => []
[prefix_cache] => []
[prompt_cache] => []
[default_prefix_id] => 0
[default_sort_order] => last_post_date
[default_sort_direction] => desc
[list_date_limit_days] => 0
[require_prefix] => 0
[allowed_watch_notifications] => all
[min_tags] => 0
[forum_type_id] => discussion
[type_config] => {"allowed_thread_types":["poll"]}
)
[_relations:protected] => Array
(
[Node] => XF\Entity\Node Object
(
[_uniqueEntityId:XF\Mvc\Entity\Entity:private] => 55
[rootClass:protected] => XF\Entity\Node
[_useReplaceInto:protected] =>
[_newValues:protected] => Array
(
)
[_values:protected] => Array
(
[node_id] => 2
[title] => SemiWiki Main Forum ( Ask the Experts! )
[description] => Post your questions to the experts here!
[node_name] =>
[node_type_id] => Forum
[parent_node_id] => 1
[display_order] => 1
[display_in_list] => 1
[lft] => 2
[rgt] => 3
[depth] => 1
[style_id] => 0
[effective_style_id] => 0
[breadcrumb_data] => {"1":{"node_id":1,"title":"Main Category","depth":0,"lft":1,"node_name":null,"node_type_id":"Category","display_in_list":true}}
[navigation_id] =>
[effective_navigation_id] =>
)
[_relations:protected] => Array
(
)
[_previousValues:protected] => Array
(
)
[_options:protected] => Array
(
)
[_deleted:protected] =>
[_readOnly:protected] =>
[_writePending:protected] =>
[_writeRunning:protected] =>
[_errors:protected] => Array
(
)
[_whenSaveable:protected] => Array
(
)
[_cascadeSave:protected] => Array
(
)
[_behaviors:protected] =>
)
)
[_previousValues:protected] => Array
(
)
[_options:protected] => Array
(
)
[_deleted:protected] =>
[_readOnly:protected] =>
[_writePending:protected] =>
[_writeRunning:protected] =>
[_errors:protected] => Array
(
)
[_whenSaveable:protected] => Array
(
)
[_cascadeSave:protected] => Array
(
)
[_behaviors:protected] =>
)
)
[_previousValues:protected] => Array
(
)
[_options:protected] => Array
(
)
[_deleted:protected] =>
[_readOnly:protected] =>
[_writePending:protected] =>
[_writeRunning:protected] =>
[_errors:protected] => Array
(
)
[_whenSaveable:protected] => Array
(
)
[_cascadeSave:protected] => Array
(
)
[_behaviors:protected] =>
)
[24445] => ThemeHouse\XPress\XF\Entity\Thread Object
(
[_uniqueEntityId:XF\Mvc\Entity\Entity:private] => 129
[rootClass:protected] => XF\Entity\Thread
[_useReplaceInto:protected] =>
[_newValues:protected] => Array
(
)
[_values:protected] => Array
(
[thread_id] => 24445
[node_id] => 2
[title] => SpaceX wants to put 1 million solar-powered data centers into orbit
[reply_count] => 5
[view_count] => 677
[user_id] => 5
[username] => Daniel Nenni
[post_date] => 1769999995
[sticky] => 0
[discussion_state] => visible
[discussion_open] => 1
[discussion_type] => discussion
[first_post_id] => 97037
[first_post_reaction_score] => 1
[first_post_reactions] => {"1":1}
[last_post_date] => 1770233905
[last_post_id] => 97173
[last_post_user_id] => 14042
[last_post_username] => hist78
[prefix_id] => 0
[tags] => []
[custom_fields] => []
[vote_score] => 0
[vote_count] => 0
[featured] => 0
[type_data] => []
[index_state] => default
)
[_relations:protected] => Array
(
[User] => ThemeHouse\XLink\XF\Entity\User Object
(
[_uniqueEntityId:XF\Mvc\Entity\Entity:private] => 54
[rootClass:protected] => XF\Entity\User
[_useReplaceInto:protected] =>
[_newValues:protected] => Array
(
)
[_values:protected] => Array
(
[user_id] => 5
[username] => Daniel Nenni
[username_date] => 0
[username_date_visible] => 0
[email] => dnenni@semiwiki.com
[custom_title] => Admin
[language_id] => 1
[style_id] => 0
[style_variation] =>
[timezone] => America/Los_Angeles
[visible] => 1
[activity_visible] => 1
[user_group_id] => 3
[secondary_group_ids] => 4,5,132
[display_style_group_id] => 3
[permission_combination_id] => 88
[message_count] => 15220
[question_solution_count] => 0
[conversations_unread] => 0
[register_date] => 1280720820
[last_activity] => 1770393156
[last_summary_email_date] => 1605968657
[trophy_points] => 113
[alerts_unviewed] => 143
[alerts_unread] => 143
[avatar_date] => 1663211649
[avatar_width] => 110
[avatar_height] => 107
[avatar_highdpi] => 0
[avatar_optimized] => 0
[gravatar] =>
[user_state] => valid
[security_lock] =>
[is_moderator] => 1
[is_admin] => 1
[is_banned] => 0
[reaction_score] => 9085
[warning_points] => 0
[is_staff] => 1
[secret_key] => 0HwyUVVHCwJotUUVEpvqAclfYJdGNPpw
[privacy_policy_accepted] => 0
[terms_accepted] => 0
[vote_score] => 0
)
[_relations:protected] => Array
(
)
[_previousValues:protected] => Array
(
)
[_options:protected] => Array
(
)
[_deleted:protected] =>
[_readOnly:protected] =>
[_writePending:protected] =>
[_writeRunning:protected] =>
[_errors:protected] => Array
(
)
[_whenSaveable:protected] => Array
(
)
[_cascadeSave:protected] => Array
(
)
[_behaviors:protected] =>
)
[Forum] => XF\Entity\Forum Object
(
[_uniqueEntityId:XF\Mvc\Entity\Entity:private] => 56
[rootClass:protected] => XF\Entity\Forum
[_useReplaceInto:protected] =>
[_newValues:protected] => Array
(
)
[_values:protected] => Array
(
[node_id] => 2
[discussion_count] => 8303
[message_count] => 60745
[last_post_id] => 97282
[last_post_date] => 1770407775
[last_post_user_id] => 333446
[last_post_username] => dkr1986
[last_thread_id] => 24495
[last_thread_title] => TSMC CEO flags 3-nanometre chip production in Japan, investment reported at $17 billion
[last_thread_prefix_id] => 0
[moderate_threads] => 0
[moderate_replies] => 0
[allow_posting] => 1
[count_messages] => 1
[auto_feature] => 0
[find_new] => 1
[allow_index] => allow
[index_criteria] =>
[field_cache] => []
[prefix_cache] => []
[prompt_cache] => []
[default_prefix_id] => 0
[default_sort_order] => last_post_date
[default_sort_direction] => desc
[list_date_limit_days] => 0
[require_prefix] => 0
[allowed_watch_notifications] => all
[min_tags] => 0
[forum_type_id] => discussion
[type_config] => {"allowed_thread_types":["poll"]}
)
[_relations:protected] => Array
(
[Node] => XF\Entity\Node Object
(
[_uniqueEntityId:XF\Mvc\Entity\Entity:private] => 55
[rootClass:protected] => XF\Entity\Node
[_useReplaceInto:protected] =>
[_newValues:protected] => Array
(
)
[_values:protected] => Array
(
[node_id] => 2
[title] => SemiWiki Main Forum ( Ask the Experts! )
[description] => Post your questions to the experts here!
[node_name] =>
[node_type_id] => Forum
[parent_node_id] => 1
[display_order] => 1
[display_in_list] => 1
[lft] => 2
[rgt] => 3
[depth] => 1
[style_id] => 0
[effective_style_id] => 0
[breadcrumb_data] => {"1":{"node_id":1,"title":"Main Category","depth":0,"lft":1,"node_name":null,"node_type_id":"Category","display_in_list":true}}
[navigation_id] =>
[effective_navigation_id] =>
)
[_relations:protected] => Array
(
)
[_previousValues:protected] => Array
(
)
[_options:protected] => Array
(
)
[_deleted:protected] =>
[_readOnly:protected] =>
[_writePending:protected] =>
[_writeRunning:protected] =>
[_errors:protected] => Array
(
)
[_whenSaveable:protected] => Array
(
)
[_cascadeSave:protected] => Array
(
)
[_behaviors:protected] =>
)
)
[_previousValues:protected] => Array
(
)
[_options:protected] => Array
(
)
[_deleted:protected] =>
[_readOnly:protected] =>
[_writePending:protected] =>
[_writeRunning:protected] =>
[_errors:protected] => Array
(
)
[_whenSaveable:protected] => Array
(
)
[_cascadeSave:protected] => Array
(
)
[_behaviors:protected] =>
)
)
[_previousValues:protected] => Array
(
)
[_options:protected] => Array
(
)
[_deleted:protected] =>
[_readOnly:protected] =>
[_writePending:protected] =>
[_writeRunning:protected] =>
[_errors:protected] => Array
(
)
[_whenSaveable:protected] => Array
(
)
[_cascadeSave:protected] => Array
(
)
[_behaviors:protected] =>
)
[24485] => ThemeHouse\XPress\XF\Entity\Thread Object
(
[_uniqueEntityId:XF\Mvc\Entity\Entity:private] => 133
[rootClass:protected] => XF\Entity\Thread
[_useReplaceInto:protected] =>
[_newValues:protected] => Array
(
)
[_values:protected] => Array
(
[thread_id] => 24485
[node_id] => 2
[title] => Texas Instruments to buy chip designer Silicon Laboratories in $7.5 billion deal
[reply_count] => 1
[view_count] => 307
[user_id] => 5
[username] => Daniel Nenni
[post_date] => 1770223525
[sticky] => 0
[discussion_state] => visible
[discussion_open] => 1
[discussion_type] => discussion
[first_post_id] => 97159
[first_post_reaction_score] => 0
[first_post_reactions] => {"4":1}
[last_post_date] => 1770232605
[last_post_id] => 97172
[last_post_user_id] => 14042
[last_post_username] => hist78
[prefix_id] => 0
[tags] => []
[custom_fields] => []
[vote_score] => 0
[vote_count] => 0
[featured] => 0
[type_data] => []
[index_state] => default
)
[_relations:protected] => Array
(
[User] => ThemeHouse\XLink\XF\Entity\User Object
(
[_uniqueEntityId:XF\Mvc\Entity\Entity:private] => 54
[rootClass:protected] => XF\Entity\User
[_useReplaceInto:protected] =>
[_newValues:protected] => Array
(
)
[_values:protected] => Array
(
[user_id] => 5
[username] => Daniel Nenni
[username_date] => 0
[username_date_visible] => 0
[email] => dnenni@semiwiki.com
[custom_title] => Admin
[language_id] => 1
[style_id] => 0
[style_variation] =>
[timezone] => America/Los_Angeles
[visible] => 1
[activity_visible] => 1
[user_group_id] => 3
[secondary_group_ids] => 4,5,132
[display_style_group_id] => 3
[permission_combination_id] => 88
[message_count] => 15220
[question_solution_count] => 0
[conversations_unread] => 0
[register_date] => 1280720820
[last_activity] => 1770393156
[last_summary_email_date] => 1605968657
[trophy_points] => 113
[alerts_unviewed] => 143
[alerts_unread] => 143
[avatar_date] => 1663211649
[avatar_width] => 110
[avatar_height] => 107
[avatar_highdpi] => 0
[avatar_optimized] => 0
[gravatar] =>
[user_state] => valid
[security_lock] =>
[is_moderator] => 1
[is_admin] => 1
[is_banned] => 0
[reaction_score] => 9085
[warning_points] => 0
[is_staff] => 1
[secret_key] => 0HwyUVVHCwJotUUVEpvqAclfYJdGNPpw
[privacy_policy_accepted] => 0
[terms_accepted] => 0
[vote_score] => 0
)
[_relations:protected] => Array
(
)
[_previousValues:protected] => Array
(
)
[_options:protected] => Array
(
)
[_deleted:protected] =>
[_readOnly:protected] =>
[_writePending:protected] =>
[_writeRunning:protected] =>
[_errors:protected] => Array
(
)
[_whenSaveable:protected] => Array
(
)
[_cascadeSave:protected] => Array
(
)
[_behaviors:protected] =>
)
[Forum] => XF\Entity\Forum Object
(
[_uniqueEntityId:XF\Mvc\Entity\Entity:private] => 56
[rootClass:protected] => XF\Entity\Forum
[_useReplaceInto:protected] =>
[_newValues:protected] => Array
(
)
[_values:protected] => Array
(
[node_id] => 2
[discussion_count] => 8303
[message_count] => 60745
[last_post_id] => 97282
[last_post_date] => 1770407775
[last_post_user_id] => 333446
[last_post_username] => dkr1986
[last_thread_id] => 24495
[last_thread_title] => TSMC CEO flags 3-nanometre chip production in Japan, investment reported at $17 billion
[last_thread_prefix_id] => 0
[moderate_threads] => 0
[moderate_replies] => 0
[allow_posting] => 1
[count_messages] => 1
[auto_feature] => 0
[find_new] => 1
[allow_index] => allow
[index_criteria] =>
[field_cache] => []
[prefix_cache] => []
[prompt_cache] => []
[default_prefix_id] => 0
[default_sort_order] => last_post_date
[default_sort_direction] => desc
[list_date_limit_days] => 0
[require_prefix] => 0
[allowed_watch_notifications] => all
[min_tags] => 0
[forum_type_id] => discussion
[type_config] => {"allowed_thread_types":["poll"]}
)
[_relations:protected] => Array
(
[Node] => XF\Entity\Node Object
(
[_uniqueEntityId:XF\Mvc\Entity\Entity:private] => 55
[rootClass:protected] => XF\Entity\Node
[_useReplaceInto:protected] =>
[_newValues:protected] => Array
(
)
[_values:protected] => Array
(
[node_id] => 2
[title] => SemiWiki Main Forum ( Ask the Experts! )
[description] => Post your questions to the experts here!
[node_name] =>
[node_type_id] => Forum
[parent_node_id] => 1
[display_order] => 1
[display_in_list] => 1
[lft] => 2
[rgt] => 3
[depth] => 1
[style_id] => 0
[effective_style_id] => 0
[breadcrumb_data] => {"1":{"node_id":1,"title":"Main Category","depth":0,"lft":1,"node_name":null,"node_type_id":"Category","display_in_list":true}}
[navigation_id] =>
[effective_navigation_id] =>
)
[_relations:protected] => Array
(
)
[_previousValues:protected] => Array
(
)
[_options:protected] => Array
(
)
[_deleted:protected] =>
[_readOnly:protected] =>
[_writePending:protected] =>
[_writeRunning:protected] =>
[_errors:protected] => Array
(
)
[_whenSaveable:protected] => Array
(
)
[_cascadeSave:protected] => Array
(
)
[_behaviors:protected] =>
)
)
[_previousValues:protected] => Array
(
)
[_options:protected] => Array
(
)
[_deleted:protected] =>
[_readOnly:protected] =>
[_writePending:protected] =>
[_writeRunning:protected] =>
[_errors:protected] => Array
(
)
[_whenSaveable:protected] => Array
(
)
[_cascadeSave:protected] => Array
(
)
[_behaviors:protected] =>
)
)
[_previousValues:protected] => Array
(
)
[_options:protected] => Array
(
)
[_deleted:protected] =>
[_readOnly:protected] =>
[_writePending:protected] =>
[_writeRunning:protected] =>
[_errors:protected] => Array
(
)
[_whenSaveable:protected] => Array
(
)
[_cascadeSave:protected] => Array
(
)
[_behaviors:protected] =>
)
)
[populated:protected] => 1
)
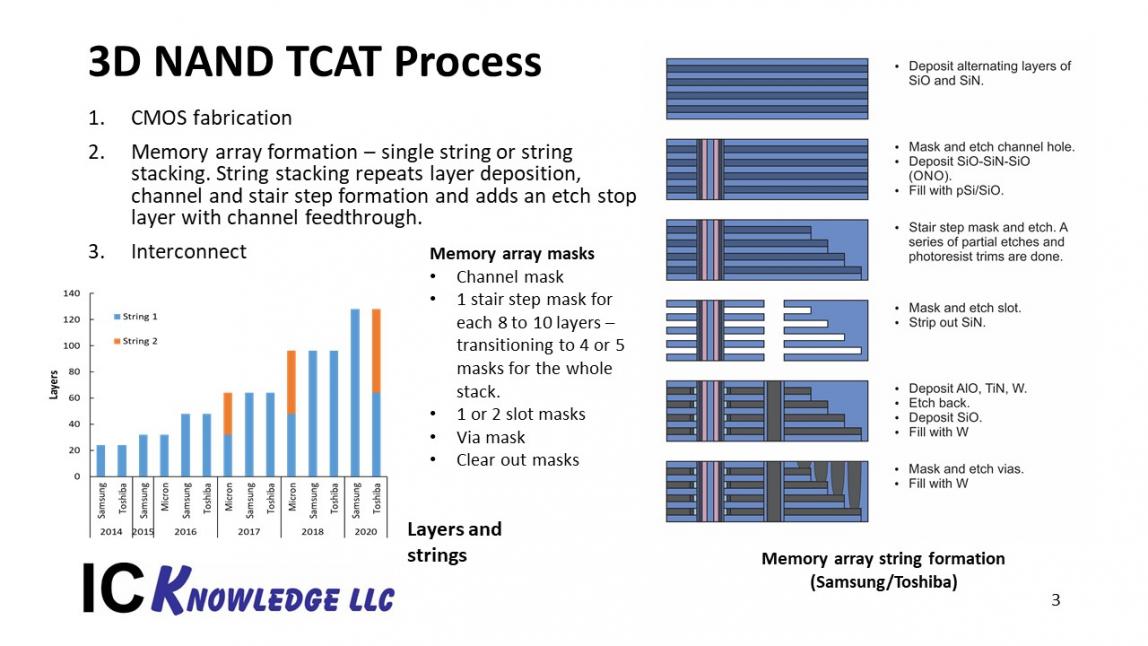
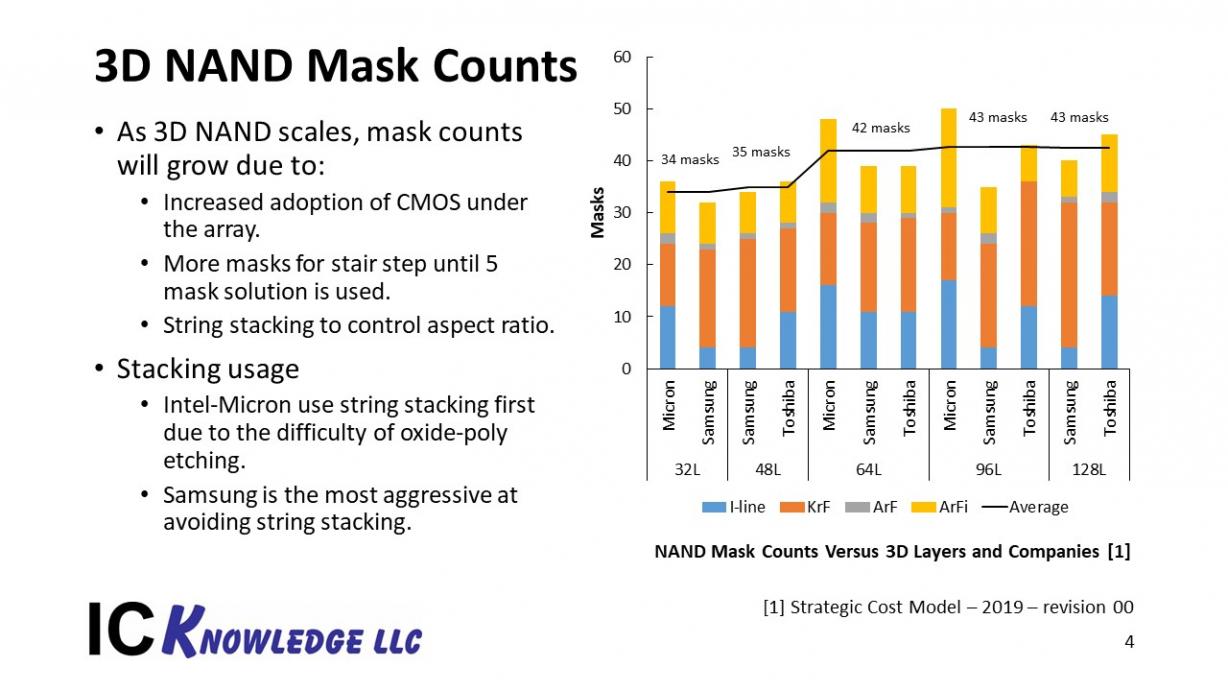
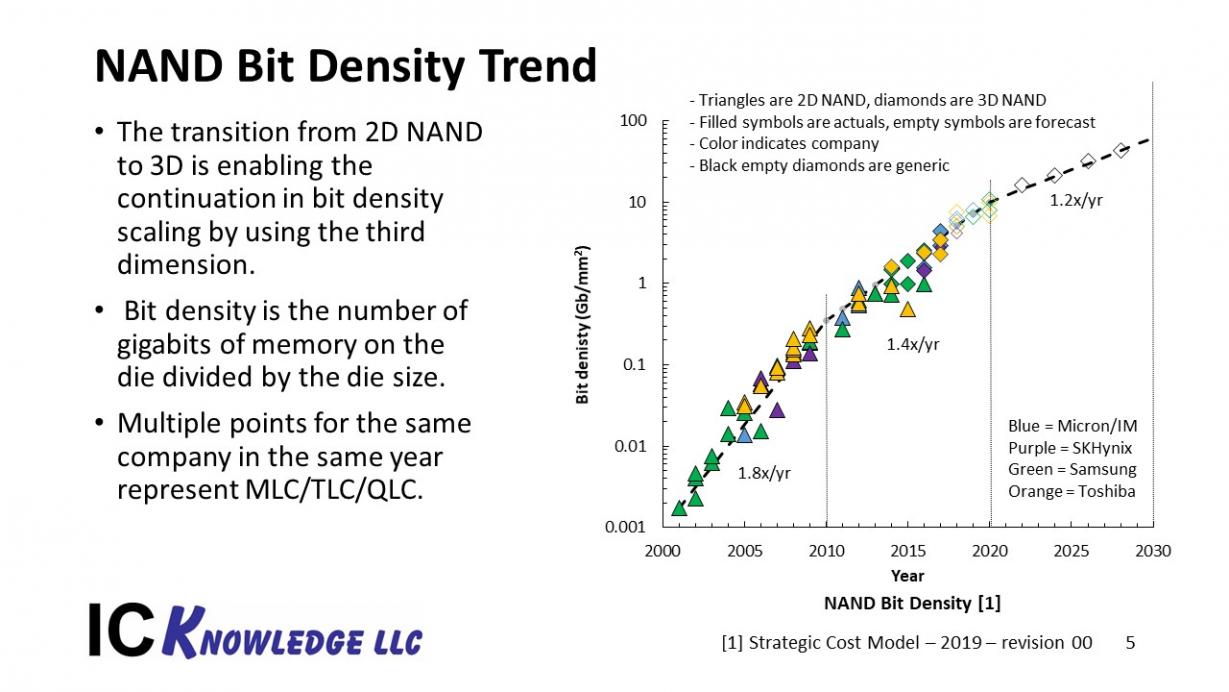
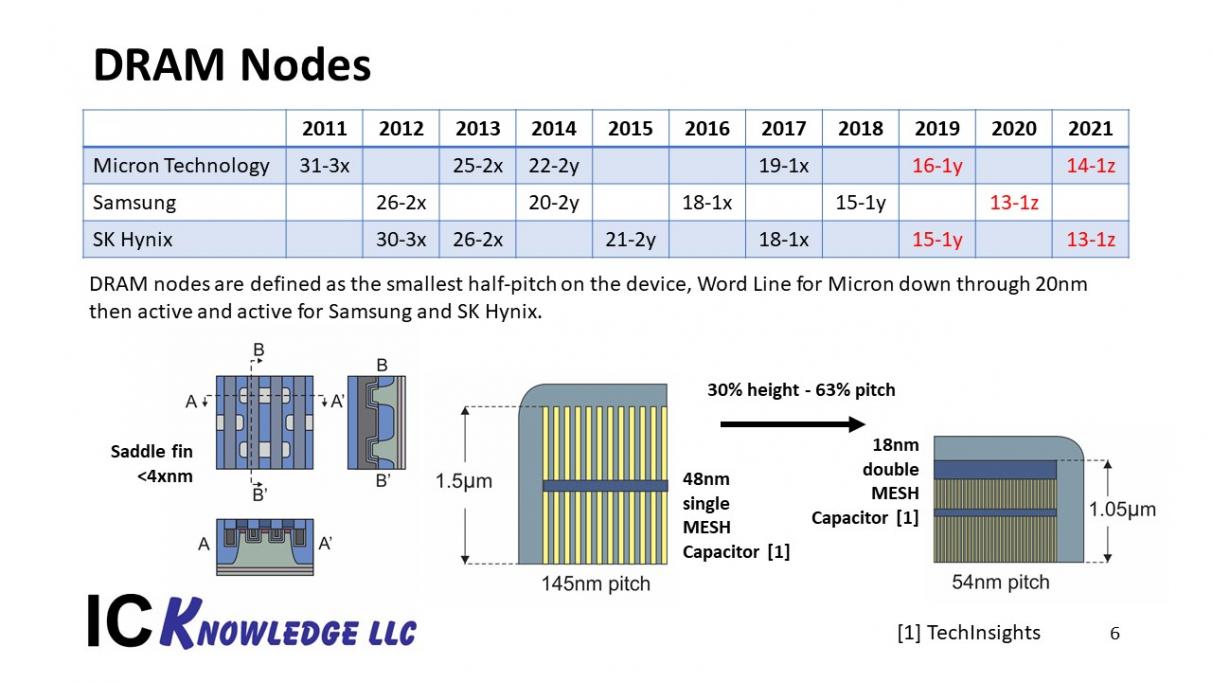
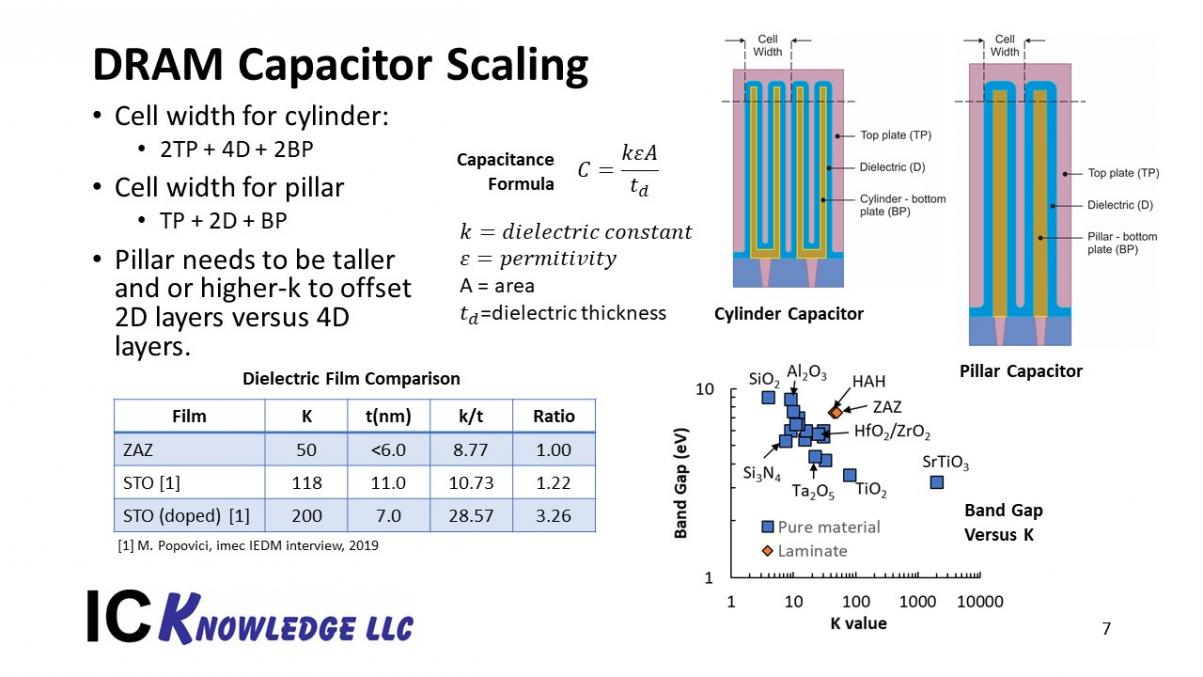
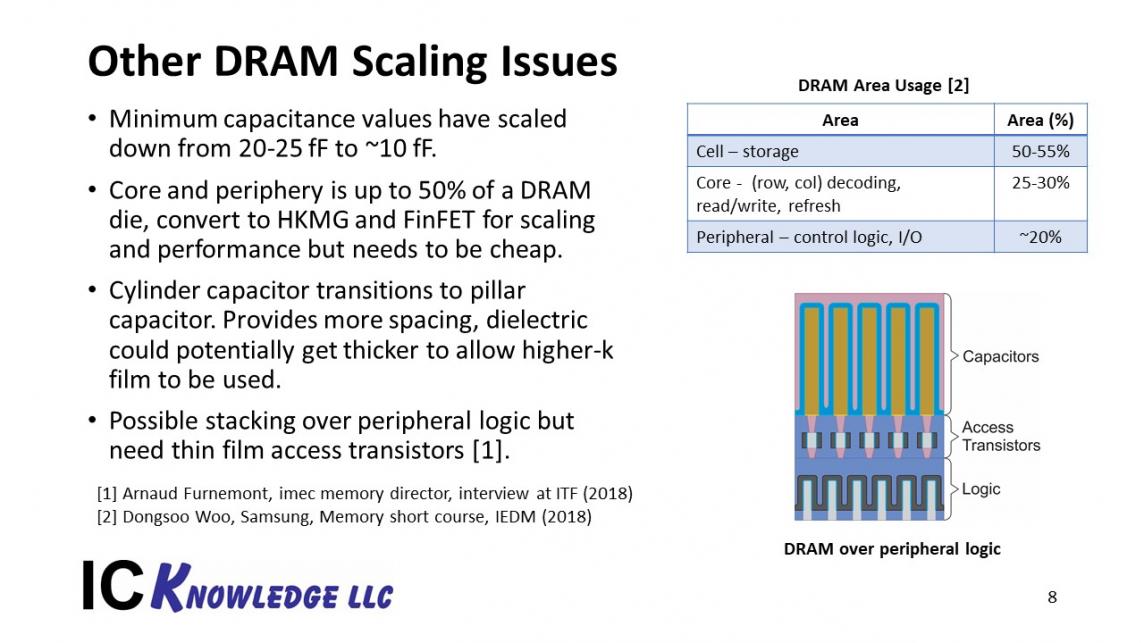
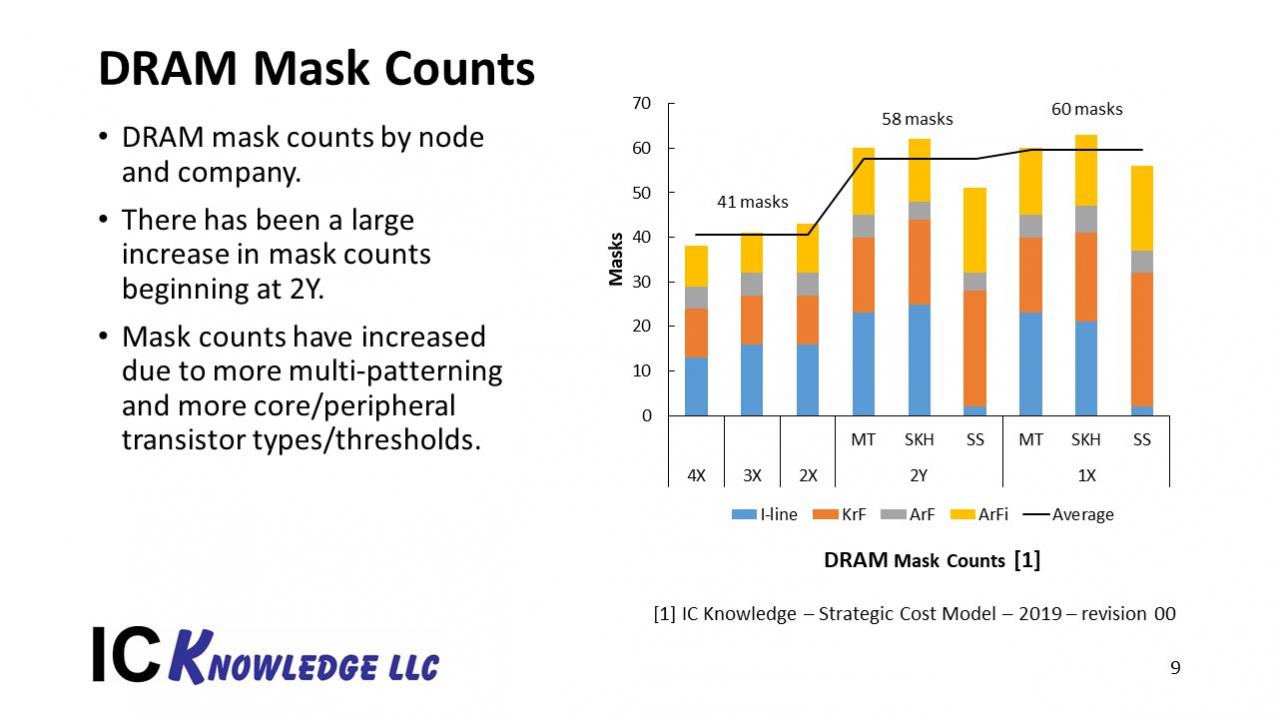
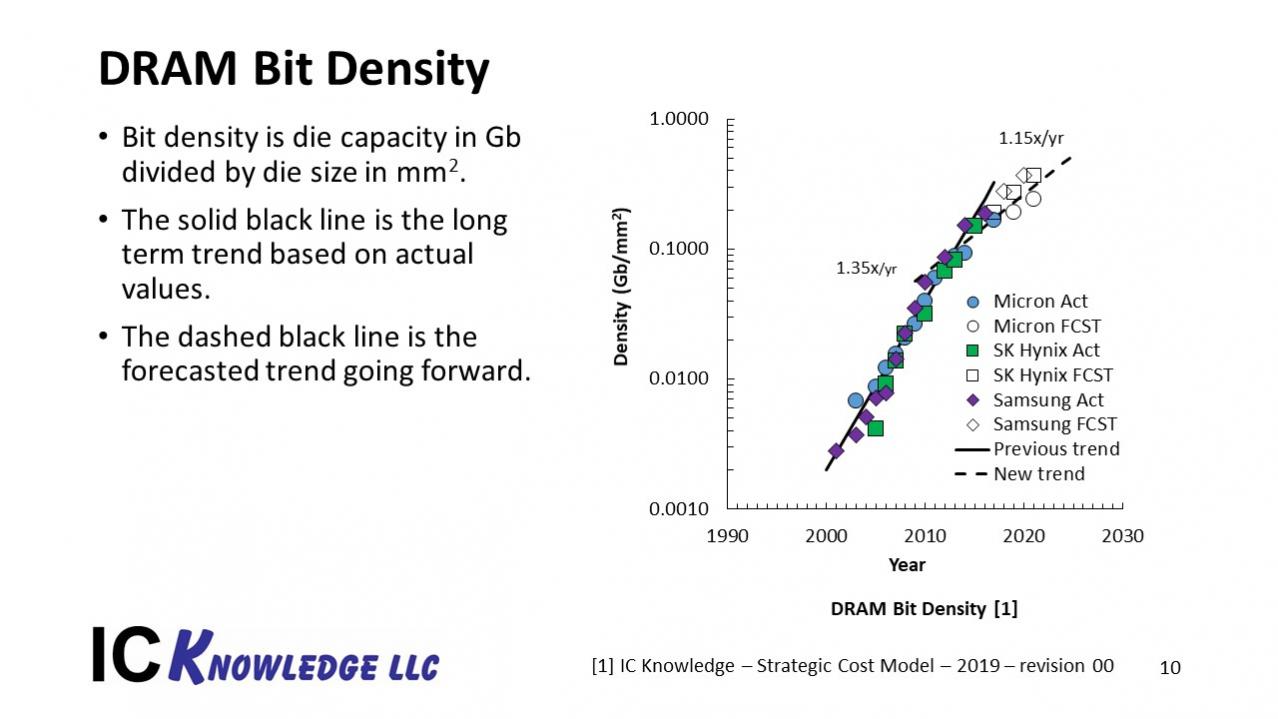
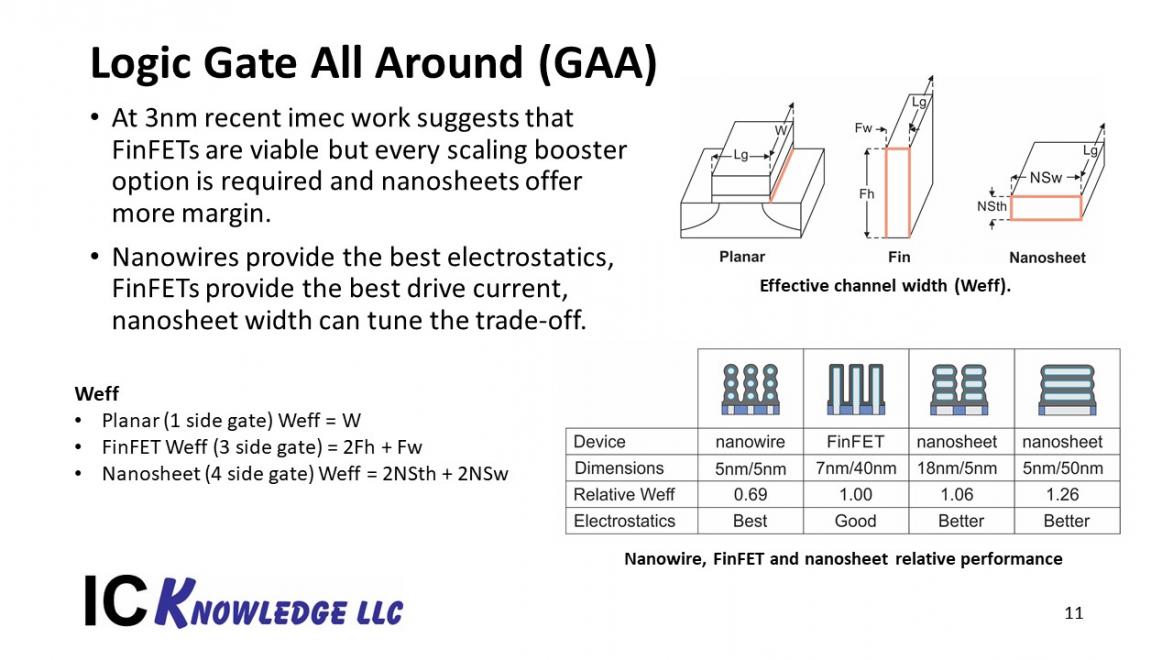
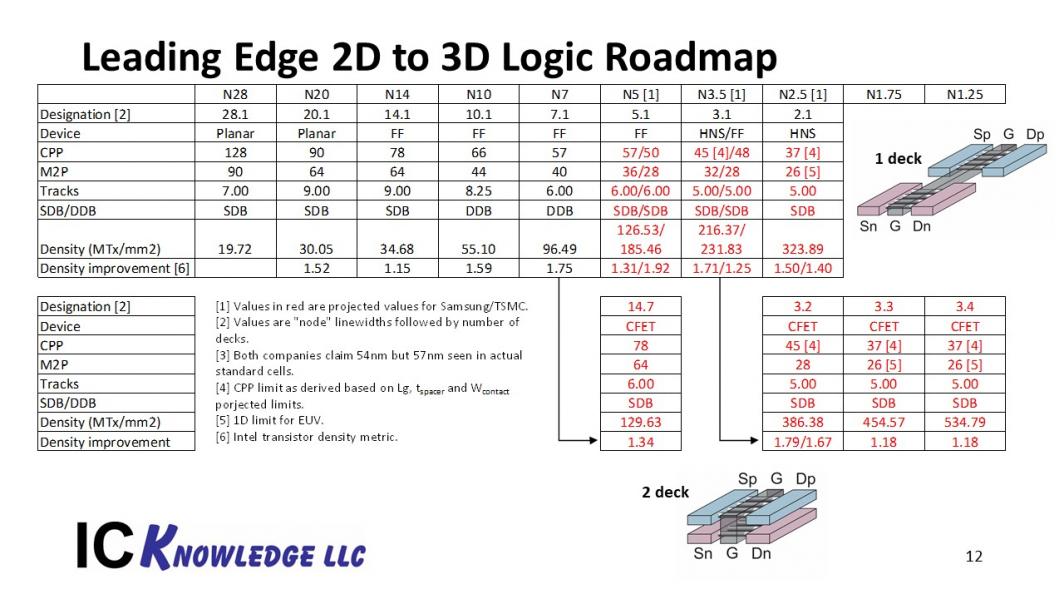
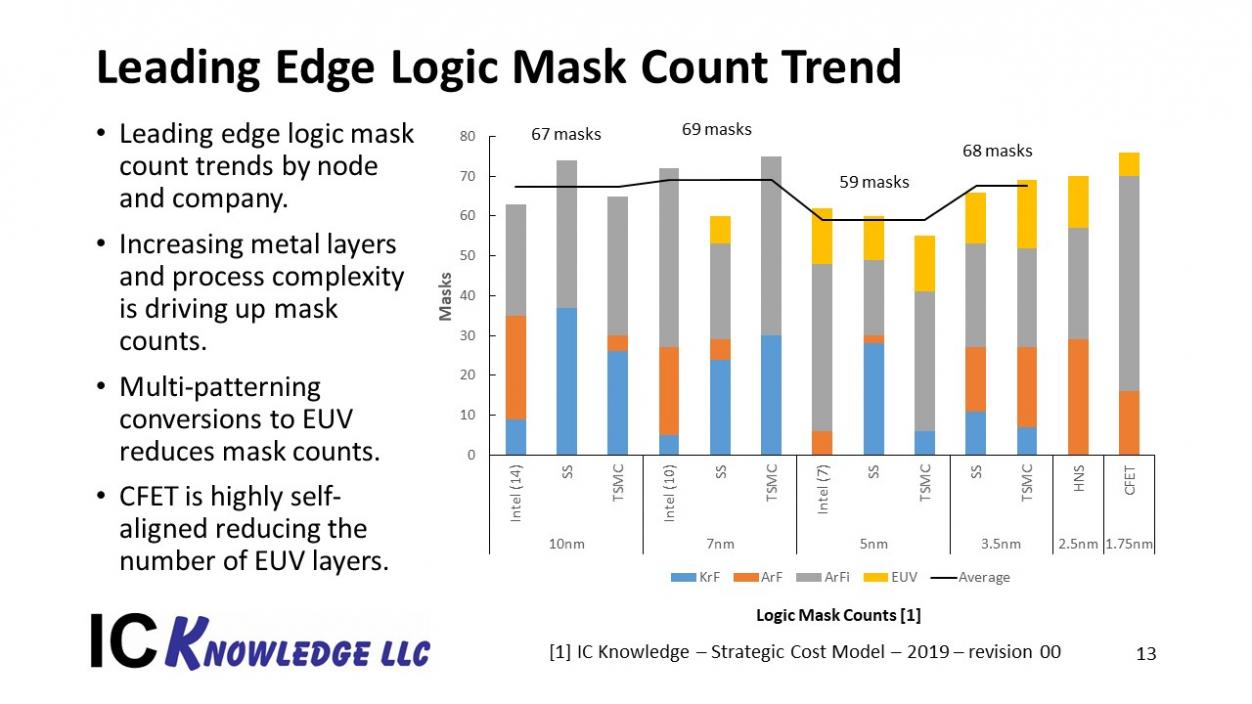
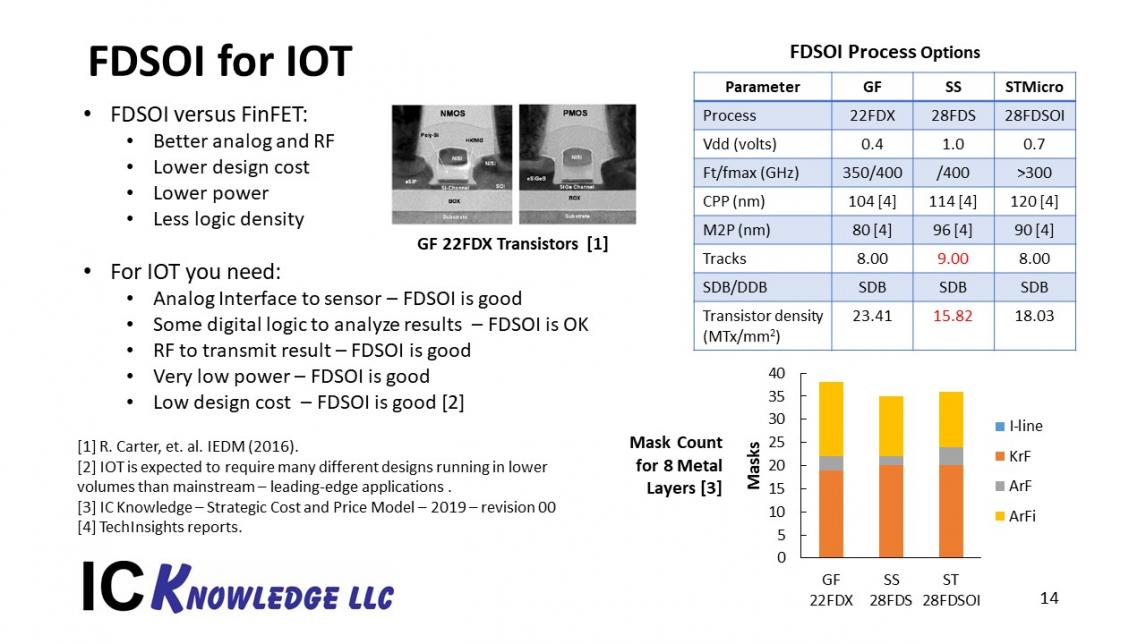
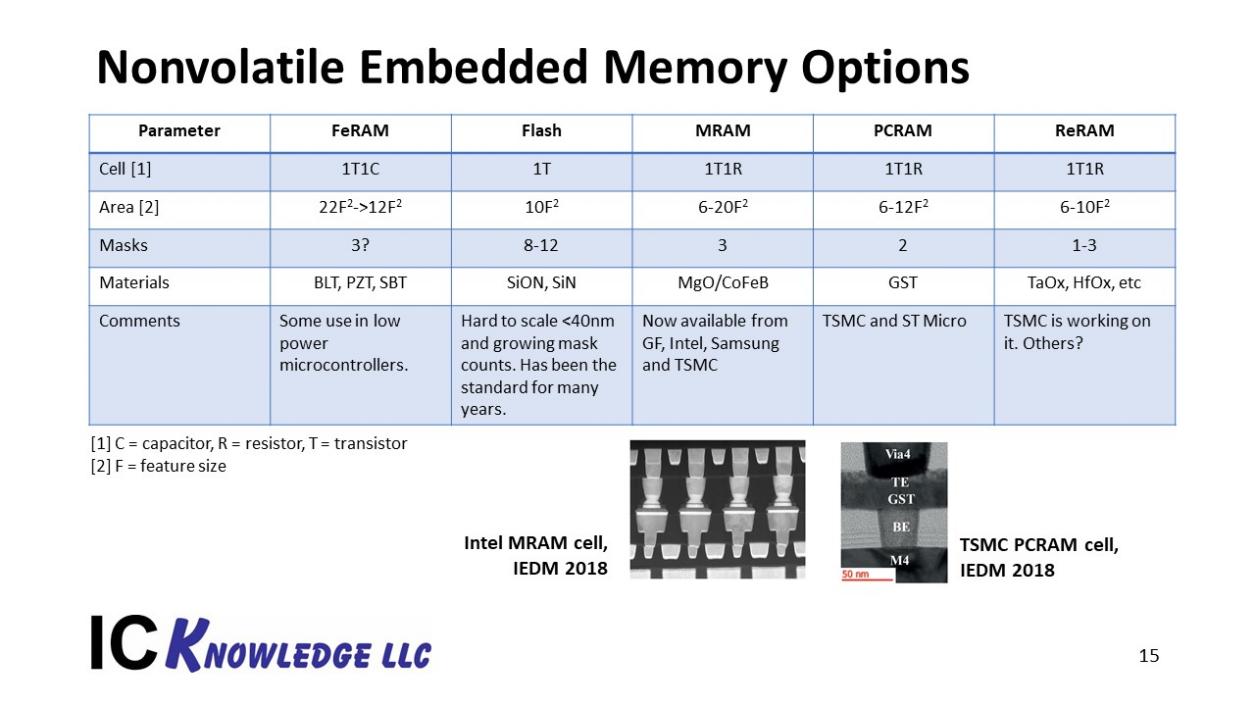


Comments
20 Replies to “LithoVision 2019 – Semiconductor Technology Trends and their impact on Lithography”
You must register or log in to view/post comments.