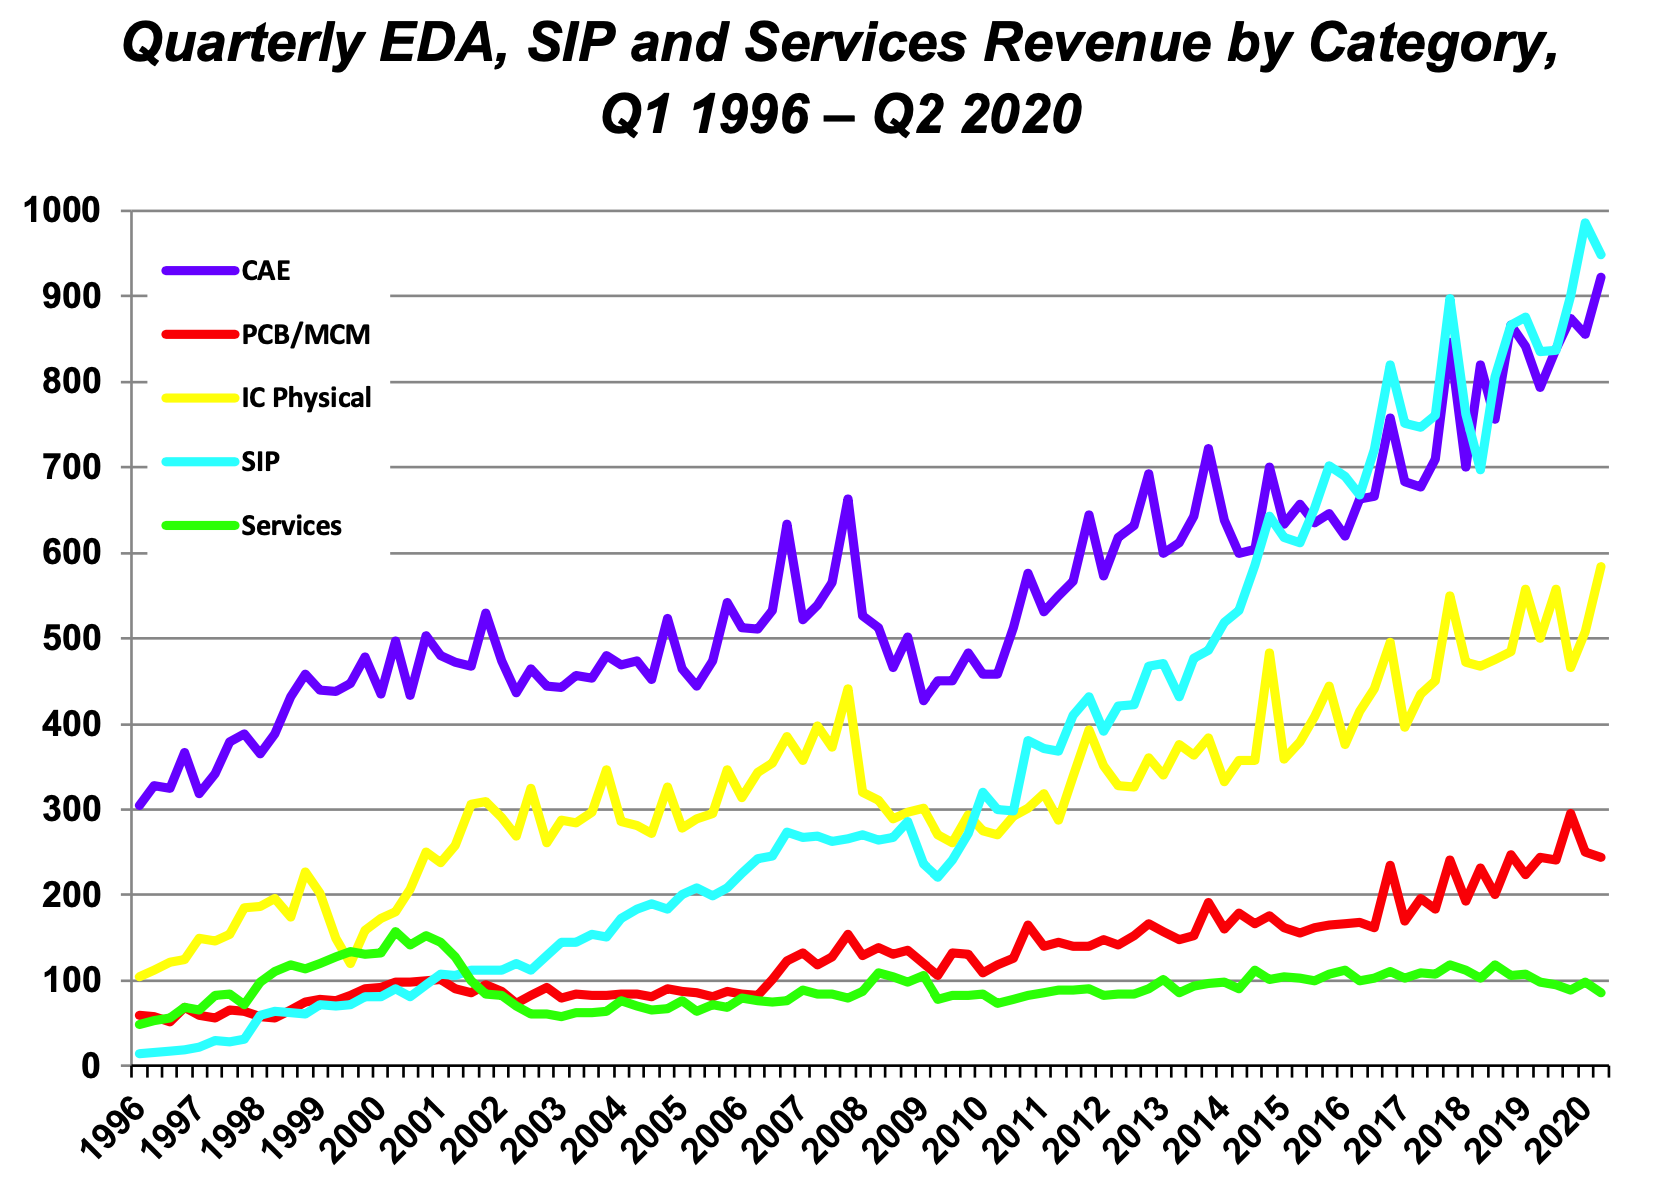
The ESD Alliance tracks revenue growth for a large number of EDA companies. Their recent report paints a positive picture in a landscape dotted with challenges and not-so-good news. The report cites 12.6% overall revenue growth for Q2 2020 vs. Q2 2019. Furthermore, the overall most recent four quarter revenue average has increased 6.7% when compared to the prior four quarters. It’s all up and to the right. Employment in EDA paints a similar picture, with a 5% increase in headcount for Q2 2020 vs. Q2 2019 and a 1.4% increase for Q2 2020 vs. Q1 2020.
“EDA is a pretty good place to be” Wally Rhines
Mike Gianfagna I got the opportunity to speak with Wally Rhines about the report to get his perspective and try to understand the story behind the numbers. Wally wears many hats, in the context of this discussion he is the executive sponsor for the SEMI EDA Market Statistics Service. First, we discussed revenue by category for Q2 2020:
- CAE revenue increased 16.1% to $922 million compared to Q2 2019. The four-quarter CAE moving average increased 7.1%
- IC Physical Design and Verification revenue increased 16.8% to $584.1 million compared to Q2 2019. The four-quarter moving average for the category rose 4.8%
- Printed Circuit Board and Multi-Chip Module (PCB and MCM) revenue decreased 0.3% to $243.5 million compared to Q2 2019. The four-quarter moving average for PCB and MCM increased 12.4%
- SIP revenue increased 13.6% to $948.2 million compared to Q2 2019. The four-quarter SIP moving average grew 8.5%
- Services revenue decreased 12.8% to $86.2 million compared to Q2 2019. The four-quarter Services moving average decreased 14.3%
Two things jumped out for us here. First, why the poor showing for PCB and MCM. Wally pointed out that while the Q2 2020 vs. Q2 2019 data was low, PCB is still on track to deliver a stellar growth year overall. Regarding services, the bad performance is a bit of a mystery. Wally offered on his personal opinion on this one. He pointed out that when times get tough, outsourced services are brought in house. This could be one of the few negative impacts COVID may have on EDA.
He also pointed out that a lot of services work is done on-site, and COVID has definitely slowed down on-site work. Wally also provided a bit of color on the strong semiconductor IP (SIP) growth. All categories are up except ethernet and DDR controllers, which are flat.
Looking at revenue by region:
- The Americas, the largest reporting region by revenue, purchased $1,155.6 million of EDA products and services in Q2 2020, an 11.4% increase compared to Q2 2019. The four-quarter moving average for the Americas increased 4.6%.
- Europe, the Middle East, and Africa (EMEA) revenue increased 5.2%, to $377.5 million compared to Q2 2019. The four-quarter moving average for EMEA grew 12.2%.
- Japan revenue increased 9% to $240.4 million compared to Q2 2019. The four-quarter moving average for Japan rose 0.8%.
- APAC revenue increased 18.1% to $1,010.3 million compared to Q2 2019. The four-quarter moving average for APAC increased 6.3%.
We felt that lumping several key regions into one APAC number didn’t really tell the whole story. I typically find that Wally has data at his fingertips for almost everything. He didn’t let me down this time. Here is the breakout for APAC (Q2 2020 vs. Q2 2019):
- China: 36.4%
- India: 16.8%
- Korea: 0%
- Taiwan: 25%
- Rest of Asia: 32%
True to form, we chatted about a few other related topics during our meeting and Wally had more insightful data at his fingertips. Regarding venture funding for EDA, approximately $2B was invested in 2019 and it looks like the total investment for 2020 will be similar. The makeup changes, however. In 2019, investments were roughly split 50/50 between the US and China. In 2020, China plays a much larger role.
We also talked about the exploding server market. The growth here is fueled in large part by all the data analytics needed, thanks to the deluge of information from our connected world. Wally left us with an interesting observation. Companies like GE and Pratt & Whitney collect about 70 terabytes of data per hour for every jet engine that is in the air. That massive amount of data is then analyzed to spot potential operational issues and to develop maintenance schedules that are tuned to the actual equipment.
These companies are the only ones who can offer this service for their products and the customer is absolutely dependent on it for safety and smooth operation. It brings up the question of whether jet engine manufacturers should simply give the engines away for free in exchange for long-term data analysis contracts.
I also spoke to Eric Esteve of IP Nest about the SIP market:
“Design IP growth rate is impressive, year after year since 2010. The four-quarter moving average growth of 8.5% confirms the fact that Design IP category is growing more than the semiconductor (excluding memory), as IPnest has shown since monitoring this market. It will be interesting to check if Interface IP category yearly growth in 2020 will be as in 2019, or +18%.”
ESD Alliance Reports Strong Electronic Design Automation Industry
Revenue Growth for Q2 2020


Comments
3 Replies to “EDA Appears to Have COVID Immunity – ESD Alliance Reports Strong Q2 2020”
You must register or log in to view/post comments.