RVN! 26 Banner revised (800 x 100 px) (600 x 100 px)

Traceability and ISO 26262

Traceability and ISO 26262
by Bernard Murphy on 11-24-2021 at 6:00 am

V graphic 2 min

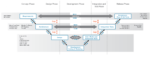
Since traceability and its relationship to ISO 26262 may be an unfamiliar topic for many of my readers, I thought it might be useful to spend some time on why this area is important. What is the motivation behind a need for traceability in support of automotive systems development? The classic verification and validation V-diagram is a useful starting point for understanding. The left arm of the V decomposes system design from concepts into requirements, architecture, and detailed design. The right arm represents verification and validation steps from unit testing all the way up to full system validation.

System development, verification and validation

Interdependency in system design

First, let’s talk about systems. A system is generally more than just a chip + software running on that chip. An example system is a car in which SoCs (chips + software) play multiple roles. There are many mechanical components in a car – engine, body structure, braking, airbags, seats and windows. All of which are enabled in various ways by electronic components: sensors to detect possible collisions, actuators to control brakes and steering, seat and window positions, communication and infotainment. These must work together as flawlessly as possible. Accomplishing this goal is managed through mountains of specifications, requirements lists and use-case definitions to ensure everyone is building and testing against the same expectations.

Car design depends heavily on reuse for the same reasons we face in SoC design – cost, schedule, quality, reliability. Plus, of course, safety. Which puts heavy constraints on interfaces between levels in the system. A new SoC must comply with multiple existing requirements in addition to meeting new requirements. The larger system and its software are very expensive to change and re-certify. New components like SoCs must fit the system requirements.

Mind the gaps

Now we’ve established that everything starts with specifications, requirements and use-cases, all non-negotiable expectations on a supplier; how does an SoC company map those into what they need to build? Going down the left arm of the V, requirements are managed in tools like IBM DOORS or Jama, and specifications might be in PDF and use-cases, perhaps in SysML. This information is very high level, not directly executable by an RTL design team.

An architect will map these requirements manually using her expertise into a more detailed specification, leveraging available IP and company differentiated skills. She will also optimize the architecture to meet performance, power and cost goals. The architect will use a different set of tools at this level, together with virtual modeling, to start early software development. That intent is then translated, usually manually, into the more familiar RTL design and modeling phase, where the full implementation is developed.

In the right arm of the V, verification and validation start with unit testing. These tests are built independently from development to maximize integrity of the testing. Subsystem and system testing follow, also independently developed for the same reason. Finally, full system validation runs against system software in a lab emulation of the full electronic system, perhaps even with some mechanical modeling.

There are gaps between all these stages, some well-intended, but gaps nonetheless. Humans must bridge these gaps; however, we are imperfect. We miss some things, we misinterpret others, and we don’t stay current with spec changes. You might hope for a universal modeling language to design out human fallibility, but that dream seems unattainable. Instead, we bridge the gaps with traceability – links connecting a higher-level requirement to lower-level implementation and tests of that requirement.

How traceability bridges the gaps

Without automation, the way you check correspondence between levels is through painstaking line-by-line checks between requirements and implementation. Tying up experts for days in performing those checks. Not so bad the first time, but as the design evolves, if the customer changes the specification or if multiple customers have conflicting requirements, periodically repeating that detailed level of check becomes very hard.

Bridging the gaps with Arteris® Harmony Trace™ traceability

A better solution would automate links between requirements and implementation, say a bus width or a register offset. Setup will require some initial effort, but then the integrity of that check persists through the design lifecycle and beyond. In a design review, you don’t have to slog through the documents every time; the tool will check automatically. If some parameter slipped out of compliance, you’d instantly know. You know you are still in compliance if the tool hasn’t raised any flags.

Traceability also gives you instant evidence you can show to somebody who’s going to check your work. Maybe your own internal safety team, maybe a customer demanding proof of compliance, maybe a safety process auditor. There’s another benefit. When something goes wrong (because this is engineering; something always goes wrong), you have an audit trail through traceability to help figure out what you should change in your process.

Traceability throughout the lifecycle

Traceability isn’t only important in the design phase. After the chip goes into production, when the auto OEM is running extensive tests, they may find a problem. In diagnosis, they want to trace back through software to hardware components. Can this problem be attributed to a deficiency in the requirements?  Being able to trace quickly to a root cause can have a huge impact on corrective action and ultimately model release. Being able to provide quick turn-around and definitive evidence of compliance, or an unforeseen problem, can only enhance the reputation of a provider in the supply chain.

Arteris® Harmony Trace™

Is there such a solution available for SoC Product design teams? Arteris IP has now released its Harmony Trace product to automate and report on these links. Harmony Trace connects IP-XACT-based SoC assembly and the hardware/software interface to popular requirements management tools and to popular documentation formats. There is now an automated path to ensure compliance with those higher-level requirements and to be able to quickly demonstrate that compliance to customers and ISO 26262 auditors. To learn more, click HERE.

Also Read:

Physically Aware SoC Assembly

More Tales from the NoC Trenches

Smoothing the Path to NoC Adoption


Bonds, Wire-bonds: No Time to Mesh Mesh It All with Phi Plus

Bonds, Wire-bonds: No Time to Mesh Mesh It All with Phi Plus
by Matt Commens on 11-23-2021 at 10:00 am

Ansys Phi Plus

Automatic adaptive meshing in HFSS is a critical component of its advanced simulation process. Guided by Maxwell’s Equations, it efficiently refines the mesh to accurately capture both the geometric and electromagnetic detail of a design. The end result is a process that guarantees accurate and reliable simulation results with no user input required.

Before the adaptive meshing process can begin, there must be an initial mesh to faithfully represent the device’s geometry. With today’s highly dense and complex designs, creating this mesh can be a challenging task. A variety of initial meshing approaches are available in HFSS, each with a different scheme for mesh generation and a different set of strengths, apropos for different design types. For example, the TAU meshing technology is well suited for meshing complex 3D CAD while the Phi meshing technology is highly effective for meshing PCBs. Attempting to apply a one-mesh-fits-all paradigm is a significant challenge when approaching complex designs containing a mixture of CAD, like a PCB in a shielding enclosure.

Fortunately, today HFSS uses the new breakthrough HFSS Mesh Fusion technology to apply meshing approaches according to local CAD specifications. From there, HFSS proceeds with the same reliable, adaptive refinement process with guaranteed accuracy.

Figure 1. HFSS Mesh Fusion applied to PCB-Connector-Flex System. Mesh-left, Fields-right

Phi is one of the meshing techniques that Mesh Fusion can apply to local CAD for components like PCBs and IC packaging. Phi is “geometry-aware.” It works with designs that are composed of 2D layers uniformly swept in their normal. When applied to the right CAD, such as a PCB, Phi is 10, 15, or even 20 times faster than its partner 3D meshing technologies—Classic and TAU.

After two decades of meshing innovation, there were still a few “rogue” design types that were notoriously difficult to mesh—most notably a common, inexpensive design solution in consumer electronics: wirebond packaging. With tiny, high-aspect-ratio copper wires connecting to an integrated circuit inside the package, its design is both layered and 3D in nature. These two CAD features, when combined in a single design, were challenging for the existing meshing technologies to manage…until now.

Introducing Phi Plus
Ansys created Phi Plus using a ground-up approach for new meshing technology, specifically designed for challenging mixed geometries like wirebond packaging. Like its predecessor, Phi, it’s “geometry-aware.” It was designed specifically to understand how wirebond packages, and other complicated 3D components like PCB connectors, are manufactured and assembled. Phi Plus takes advantage of this design knowledge and accounts for those nuances in the meshing model.

Figure 2. Package on PCB system meshed with Phi Plus and HFSS Mesh Fusion. Z-stretched view

Key features include:

Parallel Meshing Technology
Ansys prioritized parallel meshing to speed up Phi Plus processing time. From the ground up, Phi Plus was designed to take advantage of parallel computational strategies; in beta, upwards of 10 times faster mesh times were observed when meshing with 12 cores.

Robustness and Reliability
Phi Plus combines the reliability of Phi with component-specific considerations to control for a uniform, high-quality, and water-tight mesh. A higher quality mesh generates downstream benefits in the adaptive meshing and frequency sweep solving steps. Benefits include smaller final mesh count, less solution memory, and the ability to solve more frequency points in parallel for a faster total speed with high performance computing (HPC) resources.

Figure 3. Close-up view of wirebond at top layer of package

More Than “Just” Fast
With no change to user flow, the entire simulation process can be upwards of 10 times faster with little to no mesh failures. For now, implementation requires a single settings change in simulation set up with no other action needed from the user. Phi Plus has proven to be so robust in its beta rollout that it’s anticipated to become the default meshing approach in a near-future release.

It doesn’t stop with “just” wirebond packages either. Phi Plus addresses system complexity that wasn’t possible before. Its robust meshing capabilities can manage other common 3D effects in complex electronics design, including trace etching or the inclusion of 3D Encrypted Components.

The Bottom Line
However beautifully rendered a 3D design may look on the computer screen, it’s the mesh that dictates what’s simulated. Mesh is foundational to an accurate physics model. HFSS has a long legacy of letting Maxwell’s Equations guide the creation of accurate, efficient mesh, and that legacy grows stronger with the advent of Phi Plus. With Ansys HFSS 2022 R1, Phi Plus meshing will be fully incorporated into our system-capable Mesh Fusion technology. Combined with hyper-scale technologies like Ansys Cloud, there are no limits to what teams can tackle with Ansys HFSS.

Also Read

Optical I/O Solutions for Next-Generation Computing Systems

Neural Network Growth Requires Unprecedented Semiconductor Scaling

SeaScape: EDA Platform for a Distributed Future


Learning-Based Power Modeling. Innovation in Verification

Learning-Based Power Modeling. Innovation in Verification
by Bernard Murphy on 11-23-2021 at 6:00 am

Innovation New

Learning-Based Power Modeling. Innovation in Verification

Is it possible to automatically generate abstract power models for complex IP which can both run fast and preserve high estimation accuracy? Paul Cunningham (GM, Verification at Cadence), Raúl Camposano (Silicon Catalyst, entrepreneur, former Synopsys CTO) and I continue our series on research ideas. As always, feedback welcome.

The Innovation

This month’s pick is Learning-Based, Fine-Grain Power Modeling of System-Level Hardware IPs. We found this paper in the 2018 ACM Transactions on Design Automation of Electronic Systems. The authors are from UT Austin.

I find it easiest here to start from the authors’ experiments, and drill down along the way into their methods. They start from Vivado high-level synthesis (HLS) models of complex IP such as generalized matrix multiply and JPEG quantization. These they synthesize against a generic library and run gate-level simulations (GLS) and power estimation. Next they capture activity traces at nodes in the HLS model mapped at three levels of abstraction of the implementation: cycle-accurate traces for datapath resources, block-level IO activity within the IP, and IO activity on the boundary of the IP. Through ML methods they optimize representations to model power based on the three activity abstractions.

There is some sophistication in the mapping and learning phases. In resource-based abstractions, they adjust for out of order optimizations and pipelining introduced in synthesis. The method decomposes resource-based models to reduce problem dimensionality. At block and IP levels, the method pays attention to past states on IOs as a proxy for hidden internal state. The authors devote much of the paper to detailing these methods and justification.

Paul’s view

This is a very important topic, widely agreed to be one of the big still-unsolved problems in commercial EDA. Power estimation must span from low-level physical detail for accurate gate and wire estimation, up to a full software stack and apps running for billions of cycles for accurate activity traces. Abstracting mid-level behavior with good power accuracy and reasonable performance to run against those software loads is a holy grail for EDA.

The scope of this paper spans designs for which the RTL can be generated through high-level synthesis (HLS) from a C++ software model. I see two key contributions in the paper:

  • Reverse mapping activity from gate level simulations (GLS) to the C++ model and using this mapping to create a software level power model that enables power estimation from pure C++ simulations of the design.
  • Using an ML-based system to train these software level power models based on whatever low level GLS sims are available for the synthesized design.

A nice innovation in the first contribution is a “trace buffer” to solve the mapping problem when the HLS tool shares hardware resources across different lines in the C++ code or generates RTL that permissibly executes C++ code out of order.

The power models themselves are weighted sums of signal changes (activities), with weights trained using standard ML methods. But the authors play some clever tricks, having multiple weights per variable, with each weight denoting a different internal state of the program. Also, their power models conceptually convolve across clock cycles, with the weighted sum including weights for signal changes up to n clock cycles before and after the current clock cycle.

The results presented are solid, though for very small circuits (<25k gates). Also noteworthy is that HLS-based design is still a small fraction of market. Most designs have a behavioral C++ model and an independent hand coded RTL model without any well-defined mapping between the two. That said, this is a great paper. Very thought-provoking.

Raúl’s view

The article presents a novel machine learning-based approach for fast, data-dependent, fine grain, accurate power estimates of IPs. It can capture activity traces at three abstraction levels:

  • individual resources (“white box” cycle level),
  • block (“gray box” basic blocks), and
  • I/O transitions (“black box”invocations).

The technique develops a power model for each of these levels, e.g. for power in cycle n and state s

pn = 𝛉sn·asn

with an activity vector a over relevant signals, and a coefficient vector 𝛉. The approach develops similar models, with less coefficients and relevant signals, for blocks and I/O.  The method runs training using the same input vectors of an (accurate) gate-level simulation adjusting the coefficients, by various linear and non-linear regression models.

Experiments used the Vivado HLS (Xilinx), Synopsys DC and Primetime PX for power estimation. They tested 5 IP blocks between 700-22,000 gates. The authors were able to generate models within 34 minutes for all cases. Most of this time was spent generating the actual gate-level power traces. The accuracy at cycle-, block-, and I/O-level is within 10%, 9%, and 3% of the commercial gate-level estimation tool (presumably PrimeTime) and 2000x to 15,000x faster. They also write briefly about demonstrating benefits of these models for virtual platform prototyping and system-level design space exploration. Here they integrated into the GEM5 system simulator.

This is an interesting and possibly very useful approach power modeling. The results speak for themselves, but doubts remain about how general it is. How many signal traces are needed to train and what is the maximum error for a particular circuit; can this be bound? This is akin to “just 95% accuracy” of image recognition. There is perhaps the potential to develop and ship very fast/accurate power estimation models for IP.

My view

I spent quite a bit of time over the years on power estimation so I’m familiar with the challenges. Capturing models which preserve physical accuracy across a potentially unbounded state space of use cases is not a trivial problem. Every reasonable attempt to chip away at the problem is worthy of encouragement 😃

Also Read

Battery Sipping HiFi DSP Offers Always-On Sensor Fusion

Memory Consistency Checks at RTL. Innovation in Verification

Cadence Reveals Front-to-Back Safety


Machine Learning Applied to IP Validation, Running on AWS Graviton2

Machine Learning Applied to IP Validation, Running on AWS Graviton2
by Daniel Payne on 11-22-2021 at 10:00 am

Solido Variation Designer on Neoverse N1 CPU min

I recall meeting with Solido at DAC back in 2009, learning about their Variation Designer tool that allowed circuit designers to quickly find out how their designs performed under the effects of process variation, in effect finding the true corners of the process. Under the hood the Solido tool was using Machine Learning (ML) techniques so that instead of running millions of brute-force SPICE simulations in Monte Carlo analysis, they could get Monte Carlo results with only a much smaller subset of SPICE simulations. Mentor Graphics acquired Solido in December 2017, while Mentor was acquired by Siemens in March 2017.

I spoke with Sathishkumar Balasubramanian of Siemens EDA, where he is Head of Products for AMS verification, to get an update.  The big news is that EDA tools like  Variation Designer have run on the most popular engineering platforms powered by Intel chips, and now on the AWS Graviton2, which uses 64-bit Arm Neoverse cores. Not only are EDA tools moving to the cloud, but when you get in the cloud. then you get to choose X86 or AWS Graviton2 chips to run demanding workloads.

Engineers at Siemens EDA ported Solido Variation Designer software over to the AWS Graviton2, and also optimized for performance.  Users of Variation Designer on both X86 and AWS Graviton2 platforms have the same use experience.

Arm has been a long-time user of Solido tools, even prior to using AWS. They are seeing a 1,000X speedup in addition to better accuracy and coverage with Variation Designer on their IP validation runs, compared to the brute-force approach, where they need to verify standard cell IP to Six Sigma. The cost benefit analysis for Arm tilted in favor of using AWS over x86. With Graviton2 they were able to get more processors for the same costs as on x86.

Arm processor use is growing in HPC and data centers, giving EDA users some choices. The Variation Designer tool launches any of the major SPICE circuit simulators out there today, not just AFS from Siemens EDA. Arm could run their IP validation jobs on premise, but by using the AWS Graviton2-based Amazon EC2 instances on the cloud they just got a better return on investment, lowering costs by 24%, reducing CPU time by 12% and getting a 6% improved turnaround time. Running jobs in the cloud offers both scalability and capacity, something hard to achieve with on-premise. It’s kind of cool that Arm is designing IP for their next generation systems running on Arm cores in the cloud.

With Variation Designer you can expect to see four releases per year, along with monthly updates for any patches. Safety critical designs like automotive chips require 6 sigma validation of their IP, which is 1 failure in a billion units, so using a smart ML approach in the cloud gets you there quickly, and with lowered costs. IC designs at advanced process nodes require high sigma variation too, because there’s a much higher transistor count and silicon functionality per chip.

Summary

If you are using Solido Variation Designer already, and are attracted to the scalability and capacity of cloud computing, then give some thought to using AWS Graviton2 processors.

Related Blogs


Numerical Sizing and Tuning Shortens Analog Design Cycles

Numerical Sizing and Tuning Shortens Analog Design Cycles
by Tom Simon on 11-22-2021 at 6:00 am

Sizing and tuning

By any measure analog circuit design is a difficult and complex process. This point is driven home in a recent webinar by MunEDA. Michael Pronath, VP Products and Solutions at MunEDA, lays out why, even with the assistance of simulators, analog circuit sizing and tuning can consume weeks of time in what can potentially be a non-convergent process. The webinar titled “Optimal circuit sizing strategies for performance, low power, and high yield of analog and full custom IP” describes the problems designers encounter and offers a solution.

Memories, custom cells, RF and analog blocks are facing challenges that include smaller process nodes, difficult PPA trade-offs, reliability, low noise requirements, yield, etc. Equation-based circuit sizing can become intractable, especially when numerous performance specifications are added to the problem. It quite quickly becomes an expanding n-dimensional problem. Not only is it hard to find a working solution through manual iteration, manual approaches often prevent significant further optimization from being achieved. In many cases Michael explains reaching the optimal value of one spec violates another spec. This can arise from non-linear parameter dependencies resulting in mixed effects. He suggests that it’s not enough just to shift nominal values, but instead sensitivities need to be minimized so that yields can be improved.

Sizing and tuning

MunEDA has developed an automated tool that performs numerical resizing based on simulation results to refine device parameters to achieve all of a design’s specifications. The initial design needs some initial sizes, but even if it does not meet all design specs, MunEDA’s circuit sizing, optimization and variation analysis tools can find optimum results, or tell the designers that a different topology is necessary. MunEDA’s WiCkeD Tool Suite delivers performance optimization over multiple PVT corners on all test benches simultaneously. It is smart enough to perform automatic analog structure recognition. It performs yield optimization, and power & area optimization. It is suitable for traditional process technologies and FinFET nodes. As the WiCkeD tools work on a design they keep a design history and database at each step, so it is easy to perform experimentation and exploration.

MunEDA’s automated numerical circuit sizing with WiCkeD progresses through four distinct stages. Feasibility optimization locates the design with correct DC biasing for MOS devices. Nominal tuning at typical PVT fulfills specs at typical conditions. Worst case operating conditions are met through tuning at different PVTs. Design centering is done to improve the robustness of the design against process variation and mismatch. Each phase narrows down the design parameters to achieve the best result.

After this discussion Michael moves the webinar on to a thorough demo that shows in detail how designers interact with the tool as they go through a design. There were several interesting highlights during this part of the webinar. The user interface provides both text and graphic feedback on the design state and performance. There is a fascinating view of the design that shows pairwise dependencies between specs so it is easy to comprehend where trade-offs might be difficult or easy to make. At each step of the sizing, tuning and optimization process there are graphs available that show values for each specification.

Michael runs through a convergent process of fitting specifications and moving toward completion. Frequently a process that might have taken weeks through manual optimization can be completed in several hours – including setup. The design history allows reverting to earlier steps and repeating them with different goals to find the best result.

Michael concludes with several case studies of customer designs where the WiCkeD Tool Suite has delivered impressive results. He shows a high speed DDRx IO, a PA core & filter, and a rail to rail input push-pull output AMP. In each of these examples the design time was reduced from weeks to hours and the PPA often was better than the by-hand results by a wide margin.

Michael’s expertise shows though in this concise but detailed talk on how to improve analog circuit design efforts. Breaking the bottleneck on analog circuit sizing and tuning can have meaningful result in shortening time to tape out. The webinar is available to view on-demand at the MunEDA website.

Also Read

Webinar on Methods for Monte Carlo and High Sigma Analysis

CEO Interview: Harald Neubauer of MunEDA

Webinar on Tools and Solutions for Analog IP Migration


Supply Chain Breaks Under Strain Causes Miss, Weak Guide, Repairs Needed

Supply Chain Breaks Under Strain Causes Miss, Weak Guide, Repairs Needed
by Robert Maire on 11-21-2021 at 8:00 am

Applied Materials

-AMAT -Supply chain can’t keep up with expanding business
-May be longer term issue which will limit upside
-Being tough on vendors may have come back to bite Applied
-Fixing supply chain will likely take longer than the current cycle

Supply Chain issues come home to roost

Applied Materials missed on both earnings and revenues versus the street coming in at EPS of $1.94 and revenues of $6.123B versus street expectations of $1.96 and $6.375B with whispers of over $2 and about $6.5B.

Guidance is for $1.85 +- $0.07 and revenues of $6.16B +- $250M …which sounds like flattish in a world of huge demand. Street expectations were $2.01 and $6.5B.

As compared to the rest of the semiconductor equipment industry which ranged from virtually zero supply chain impact to significant impact, Applied was most negatively impacted of any company. This clearly implies that the problems reported were likely Applied specific. According to the company the supply chain related impact was around $300M.

Shoemakers Children go barefoot

Applied laid the blame primarily on semiconductor shortages although we think it likely goes well beyond that to subsystems using semiconductors. It also sounded like most of the issues were on process tools.

We find it a bit odd that after navigating issues for much of the year that supply chain problems finally caught up with them. We would imagine that much of the inventory and stock in the supply chain has likely been used up to the point where there is little to no buffer left in the system.

Its not question of if upside will be limited but how much it will be limited?

We had predicted in our quarterly preview note of October 4th that we would likely see more impact from supply chain issues that we had not previously seen in previous quarters and that upside would likely start to limit performance which would in turn limit stock upside. Applied’s report is the best example of that projected issue

We have at the very least two quarters of negative impact on revenue and earnings and likely beyond into 2022. Although the reported quarter is only about a 5% hit to revenues it could worsen

Does inability to supply lead to share loss to competitors?

From Applied management it was clear that the areas most impacted were coincidentally those areas with the most competition such as deposition and etch. Could we see Lam, Tokyo Electron, Hitachi and ASMI pick up some share as customers get more desperate for tools that Applied can’t supply.

This is obviously more damaging as it causes a longer term problem because its harder to get back lost share

Demand is beyond huge…. its all a supply issue

Demand remains at super strong levels and we will likely see record demand in the near term. Sooner or later this “super duper cycle” will subside and things will slow so its very important to “make hay while the sun shines” and not miss any opportunities. We would hope that Applied can address the supply issues before the current cycle slows.

Being tough on vendors may have come back to bite Applied

Applied has always been very proud of being tough on suppliers…. perhaps a bit too tough, always trying to squeeze the last margin point or concession out of vendors. It seems that management has recognized this, perhaps a little late in the current demand environment.

CEO Gary Dickerson said during opening remarks on the call ” the economic value of capturing upside opportunities far outweighs pure efficiency savings, we’re also seeing changes in supply agreements across the eco-system as companies place a premium on having preferential access to capacity”.

Its certainly better late than never but it will take a long time to change the ingrained habits of the supply chain managers at Applied (similar to those in the auto industry). In our long history in the semiconductor industry we know of a number of sub suppliers who either didn’t do business with Applied or preferred doing business with others due to Applied’s hardball tactics. Now that things are tight its going to be even tougher to get new/more suppliers that are already servicing other customers..

We will likely see some impact on margins near term for expediting supplies or shipments or simply paying more to incentivize suppliers.

The stocks

We will likely see a knee jerk reaction across the space for what is a problem that is more specific to Applied although not completely limited to Applied as others have issues though not as bad.

The fear will be that supply issues will get worse and spread further across the industry which is not untrue.

We had suggested in our Oct 4th preview that the stocks had seen their near term peak and supply chain fears could be the reason that keeps them in check for the near term.

In general we think that KLAC and LRCX have done a better job on the supply chain issues with KLAC seeing essentially zero impact. ASML trades in another universe so even supply chain issues are of little impact given their monopolistic position.

We continue with the view that upside is limited in general as the fears will likely grow especially after Applied’s report.

Sub-suppliers may see a bit more love in the near term but shouldn’t expect it to last through a downturn when it comes.

Also Read:

KLAC- Foundry/Logic Drives Outperformance- No Supply Chain Woes- Nice Beat

Intel – “Super” Moore’s Law Time warp-“TSMC inside” GPU & Global Flounders IPO

Intel- Analysts/Investor flub shows disconnect on Intel, Industry & challenges


The Story of Ultra-Wideband Part 6: The Secret Revealed

The Story of Ultra-Wideband Part 6: The Secret Revealed
by Frederic Nabki & Dominic Deslandes on 11-21-2021 at 6:00 am

energy efficiency graph

This 6-article series started by asking the question: Why did Apple leap ahead of demand in 2019 by designing a UWB transceiver into the iPhone 11? Then in early 2020, why was UWB chip supplier Decawave acquired for an estimated $400-$500 Million? Why are automakers GM, Ford, Toyota, Nissan, Honda, Hyundai, Volkswagen, BMW and Mercedes all investing in UWB?

The answer is now clear: UWB offers a unique combination of accurate positioning, ultra-low power, ultra-low latency and high bandwidth that cannot be matched by any other short-range wireless technology. UWB deployments in 2021 have focused on precise positioning and location-based services: secure keyless entry, hands-free payments and indoor navigation. Coming soon are low-power and battery-free data IoT networks with up to 10X the bandwidth of Bluetooth.

This last article in the UWB series focuses on UWB’s superpowers as we enter the extreme-low-power and battery-free era.

UWB’s Superpowers: A Chronology

In the first five articles in this series, we examined the 100-year history of UWB and the development of each of its superpowers:

1912:                 Titanic uses wideband (WB) spark gap transmitters to call for help; all commercial ships are subsequently required to be equipped with WB transmitters and receivers are monitored 24/7. Spark gap transmitters took advantage of the first of wideband’s superpowers: using a wide spectrum to achieve a wideband signal.

1920s:               Narrowband displaces WB in communications to serve the booming demand for code and voice channels.

1930s-1940s:    Secret military research continues into wideband for its ranging capabilities, resulting in the RADAR revolution during World War II. RADAR takes full advantage of the second UWB superpower: high-precision positioning and ranging.

1980s-2000s:    Medical imaging; ground, wall and foliage penetrating radars and synthetic aperture radar (SAR) take advantage of ultra-wideband’s high-precision imaging.

Early 2000s:      Worldwide frequency allocations approved for UWB, but orthogonal frequency-division multiplexing (OFDM) UWB achieves limited deployment and mostly fails due to WiFi advances. Building on this experience, SPARK Microsystems develops a proprietary third UWB superpower: technology to make low-power low-latency UWB resilient to narrowband interference.

Early 2020s:      Apple and automakers start shipping hundreds of millions of UWB transceivers for secure keyless entry and location-based services. These applications take full advantage of UWB’s superpower of accurate positioning. In parallel, SPARK Microsystems starts to present ultra-low latency audio and video links leveraging its UWB technology, showing off UWB’s fourth superpower: extreme low latency for interactivity.

UWB Smashes Through Bluetooth Design Limitations

Bluetooth has been wildly successful serving low-bandwidth, low-fidelity communications (wireless headsets and earbuds, for example). So why did Apple design yet another transceiver into the iPhone 11? To serve emerging applications that dramatically exceed Bluetooth’s design limitations, notably accurate positioning.

In Part 5 of this series, we explored how narrowband protocols like Bluetooth have fundamental limitations that make them less suitable than UWB for extremely low power, low latency and battery-less applications:

Data rate limits: The Bluetooth specification limits over the air bandwidth to just 3 Mbps, and in most system is limited to less than 1 Mbps. UWB can operate at tens of Mbps.

Low data rate power: Oscillator overhead and long packet duration keeps Bluetooth minimum power at several milliwatts for even at lowest data rates. UWB tailored to low power operation and to data streaming, as achieved with SPARK Microsystems’ implementation, can transmit 1 kbps at under 10 μW, making possible battery-free sensors powered by energy harvesting.

Latency:            Bluetooth latency often exceeds 100 ms, which is noticed by headset users as echoes, long audio delays and speaking over each other on phone calls. This latency makes Bluetooth unattractive for interactive applications like game controllers and AR/VR, and unacceptable for industrial sensor and control systems. UWB offers sub-millisecond latency for near-real-time machine control and interactive entertainment systems.

Positioning:      Location services and precise positioning are well-known strong points of UWB, which can measure relative locations within 10 cm accuracy. This is out of the reach of Bluetooth which struggles getting sub few meters accuracy.

Interference robustness: The 3-10 GHz band is becoming crowded. In addition to LTE, 5G and WiFi, including the recently announced WiFi 6E, all occupy different parts of this spectrum. It is possible to achieve robust UWB communications but this has to be done carefully in order to operate without impeding all of the other carrier-based signals, and effectively rejecting them. SPARK Microsystems’ UWB transceiver implementation has demonstrated robust operation with these interferers while providing robust data communications in the UWB spectrum.

UWB Ideal for Short-Range, Extreme Low-Power Applications:

Indeed, for short-range, low-power applications, UWB is superior to WLAN and Zigbee as well as classic Bluetooth and BLE:

The Bottom Line: Energy Consumed for a Complete Link

This chart compares the energy efficiency for a complete link at 200kbps for Zigbee, BLE and UWB:

Energy efficiency for complete link (200kbps)

When you add up all the power required to energize and stabilize the carrier frequency and transmit narrowband data, the total is 1-2 orders of magnitude greater than UWB when tailored to operate at low power.

Conclusion:

Today’s UWB doesn’t resemble its spark gap predecessors from 100 years ago. And although narrowband radios have dominated communications since the demise of the spark gap almost a century ago, UWB is at the beginning of a massive resurgence. After all, it is the first new unlicensed-spectrum wireless technology to be included into smartphones in about 20 years and other phone manufacturers have followed Apple’s lead. UWB’s ‘superpowers’ directly address the power, bandwidth and latency demands of new applications that narrowband cannot deliver. UWB is uniquely suited to dominate many emerging low-power, low-latency, higher data rate applications and pave the way toward battery-less applications.

Our sincere thanks to SemiWiki for giving us the opportunity to recap and share the history of UWB to date. It goes without saying that there is much more history still to be written! Be sure to ‘watch this space’ for subsequent entries detailing UWB’s many technologies and commercial milestones on the path to mainstream adoption.

About Frederic Nabki

Dr. Frederic Nabki is cofounder and CTO of SPARK Microsystems, a wireless start-up bringing a new ultra low-power and low-latency UWB wireless connectivity technology to the market. He directs the technological innovations that SPARK Microsystems is introducing to market. He has 18 years of experience in research and development of RFICs and MEMS. He obtained his Ph.D. in Electrical Engineering from McGill University in 2010. Dr. Nabki has contributed to setting the direction of the technological roadmap for start-up companies, coordinated the development of advanced technologies and participated in product development efforts. His technical expertise includes analog, RF, and mixed-signal integrated circuits and MEMS sensors and actuators. He is a professor of electrical engineering at the École de Technologie Supérieure in Montreal, Canada. He has published several scientific publications, and he holds multiple patents on novel devices and technologies touching on microsystems and integrated circuits.

About Dominic Deslandes

Dr. Dominic Deslandes is cofounder and CSO of SPARK Microsystems, a wireless start-up bringing a new ultra low-power and low-latency UWB wireless connectivity technology to the market. He leads SPARK Microsystems’s long-term technology vision. Dominic has 21 years of experience in the design of RF systems. In the course of his career, he managed several research and development projects in the field of antenna design, RF system integration and interconnections, sensor networks and UWB communication systems. He has collaborated with several companies to develop innovative solutions for microwave sub-systems. Dr. Deslandes holds a doctorate in electrical engineering and a Master of Science in electrical engineering for Ecole Polytechnique of Montreal, where his research focused on high frequency system integration. He is a professor of electrical engineering at the École de Technologie Supérieure in Montreal, Canada.


Podcast EP50: Perforce at DAC

Podcast EP50: Perforce at DAC
by Daniel Nenni on 11-19-2021 at 10:00 am

Dan and Mike are joined by Simon Butler, general manager of the Methodics Business Unit at Perforce. Some history of DAC is discussed; what it’s like attending the show both as a small company and a larger one. The products Perforce will showcase at DAC this year are then discussed, The breadth of technology to support design infrastructure that Perforce brings to the industry is detailed by Simon.

The views, thoughts, and opinions expressed in these podcasts belong solely to the speaker, and not to the speaker’s employer, organization, committee or any other group or individual.

https://www.perforce.com/

https://www.dac.com/


2021 Semiconductors Finishing Strong with 2022 Moderating

2021 Semiconductors Finishing Strong with 2022 Moderating
by Bill Jewell on 11-19-2021 at 8:00 am

Top Semiconductor Comoany Reveue 2021

The semiconductor market in 3rd quarter 2021 was $144.8 billion, according to WSTS, up 7.4% from the prior quarter and up 27.6% from a year ago. The strong year-to-year growth was a slight deceleration from 30.4% in 2nd quarter 2021. The major memory companies reported very healthy 3Q21 revenue increases versus 2Q21 with all of them up double digits, led by Kioxia at 21.5%. Among the leading non-memory companies Qualcomm, AMD, Infineon, and NXP all had double digit growth. Intel was the only top semiconductor company with a revenue decline, down 2.2% in 3Q21 versus 2Q21.

The top semiconductor companies’ guidance for 4Q21 are mixed. Qualcomm expects 11.9% 4Q21 growth versus 3Q21 driven by strong handset growth, especially for Android smartphones. Nvidia, AMD, STMicroelectronics and NXP all project mid-single-digit revenue increases – citing datacenter, servers, gaming, automotive, and industrial as key drivers. Intel, Micron, MediaTek, Texas Instruments and Infineon all guided for 4Q21 revenue declines. The automotive market has drawn much attention for semiconductor shortages, however other markets are also showing problems. Weakness in the PC market due to shortages of some key components was highlighted as a concern by Intel, SK Hynix, Micron and Kioxia.

Constraints on supplies of semiconductors and other components are reflected in lower forecasts for the key end equipment categories of PCs and smartphones. In May 2021, IDC projected 2021 PC shipments of 357 million units, up 17.6% from 2020. In August 2021, IDC reduced its 2021 forecast to 347 million units, up 14.2% from 2020 and 10 million units lower than the May forecast. IDC cited supply chain issues for the lower forecast. Counterpoint Research in July 2021 expected 2021 smartphone shipments of 1,447 million units, up 8.7% from 2020. In September 2021, Counterpoint reduced its 2021 forecast to 1,414 million units, up 6.2% from 2020 and 33 million units lower than the July projection. Counterpoint blamed semiconductor shortages for its downward revision.

The most recent forecasts for the semiconductor market in 2021 and 2022 also incorporate the impact of supply constraints. Our November forecast from Semiconductor Intelligence calls for 2021 growth of 24.5% (down from 26% in our August forecast) and 14% growth in 2022 (down from 15% in August). IC Insights’ November projection of 23% growth in 2021 is down from their June forecast of 24.1%. Gartner is the most optimistic with an October estimate of a 27% increase in 2021. IDC has the lowest 2021 projection at 17%. With three quarters of data from WSTS and 4Q21 revenue guidance from most major companies, the 2021 semiconductor market will almost certainly finish in a range of 23% to 26%, the highest growth since 31.8% in 2010 following the great recession.

Our Semiconductor Intelligence forecast of 14% semiconductor market growth in 2022 is based on these key assumptions:

Normalization of growth of end equipment after higher-than-normal growth in 2021.

Relief of most major semiconductor and other component supply problems.

Continued recovery of most worldwide economies in 2022 following the worst of the pandemic.

The biggest uncertainty is the impact of COVID-19 in 2022. According to the Johns Hopkins University of Medicine, cases have risen over the last month following a decline from an August peak. Only 42% of the world’s population has been fully vaccinated, with the U.S. at 60%. Although most of the world has opened up, there are still numerous cases of local lockdowns. If COVID-19 is not mostly under control in 2022, the entire global economy will perform below its potential.

Also Read:

Semiconductor CapEx too strong?

Auto Semiconductor Shortage Worsens

Electronics Recovery Mixed


CEO Interview: Charbel Rizk of Oculi

CEO Interview: Charbel Rizk of Oculi
by Daniel Nenni on 11-19-2021 at 6:00 am

Charbel Rizk CEO Interview SemiWiki

Charbel Rizk is CEO of Oculi®, a spinout from Johns Hopkins University, a fabless semiconductor startup commercializing technology to address the high power and latency challenges of vision technology.  Dr. Rizk recognized these as barriers to effective AI in his years of experience as a Principal Systems Engineer, Lead Innovator, and Professor at Rockwell Aerospace, McDonnell Douglas, Boeing, JHUAPL and Johns Hopkins University. The Oculi vision solution reduces latency, bandwidth, and/or power consumption by up to 30x.

Why did you decide to create this technology?
Our original motivation was simply to enable more effective autonomy. Our perspective is that the planet needs the “human eye” in AI for energy efficiency and safety. Machines outperform humans in most tasks but human vision remains far superior despite technology advances. Cameras, being the predominant sensors for machine vision, have mega-pixels of resolution. Advanced processors can perform trillions of operations per second. With this combination, one would expect vision architecture (camera + computer) today to be on par with human vision. However, current technology is as much as ~40,000x behind, when looking at the combination of time and energy wasted in extracting the required information. There is a fundamental tradeoff between time and energy, and most solutions optimize one at the expense of the other. Just like biology, machine vision must generate the “best” actionable information very efficiently (in time and power consumption) from the available signal (photons).

What are the major problems with the current technology available in the market?
Cameras and processors operate very differently compared to the eye+brain combination, largely because they have been historically developed for different purposes. Cameras are for accurate communication and reproduction of a scene. Processors have evolved over time with certain applications in mind, with the primary performance measure being operations per second. The latest trend is domain specific architectures (i.e. custom chips), driven by demand from applications such as image processing.

Another important disconnect, albeit less obvious, is the architecture itself. When a solution is developed from existing components (i.e. off-the-self cameras and processors), it becomes difficult to integrate into a flexible solution and more importantly to dynamically optimize in real-time which is a key aspect of human vision.

As the world of automation grows exponentially and the demand for imaging sensors skyrockets, efficient (time and resources) vision technology becomes even more critical to safety (reducing latency) and to conserving energy.

What are the solutions proposed by Oculi?
Oculi has developed an integrated sensing and processing architecture for imaging or vision applications. Oculi patented technology is agnostic to both the sensing modality on the front end (linear, Geiger, DVS, infrared, depth or TOF) and the post-processing (CPU, GPU, AI Processors…) that follows.We have also demonstrated key IP in silicon that can materialize this architecture into commercial products within 12-18 months.

A processing platform that equals the brain is an important step in matching human perception, but it will not be sufficient to achieve human vision without “eye-like” sensors. In the world of vision technology, the eye represents the power and effectiveness of parallel edge processing and dynamic sensor optimization. The eye not only senses the light, it also performs a good bit of parallel processing and only transfers to the brain relevant information. It also receives feedback signals from the brain to dynamically adjust to changing conditions and/or objectives. Oculi has developed a novel vision architecture that deploys parallel processing and in-memory compute in the pixel (zero-distance between sensing and processing) that delivers up to 30x improvements in efficiency (time and/or energy).

The OCULI SPU™ (Sensing & Processing Unit), is a single chip complete vision solution delivering real-time Vision Intelligence (VI) at the edge with software-defined features and an output compatible with most computer vision ecosystems of tools and algorithms. Being fitted with the IntelliPixel™ technology, the OCULI SPU reduces bandwidth and external post-processing down to ~1% with zero loss of relevant information. The OCULI SPU S12, Our GEN 1 Go-To-Market product, is the industry’s first integrated neuromorphic (eye+brain) silicon deploying sparse sensing, parallel processing + memory, and dynamic optimization

It offers Efficient Vision Intelligence (VI) that is a prerequisite for effective Artificial Intelligence (AI) for edge applications.  OCULI SPU is the first single-chip vision solution on a standard CMOS process that delivers unparalleled selectivity, efficiency, and speed.

There is significant room for improvement in today’s products by simply optimizing the architecture, in particular the signal processing chain from capture to action, and human vision is a perfect example of what’s possible. At Oculi, we have developed a new architecture for computer and machine vision that promises efficiency on par with human vision but outperforms in speed.

Do you want to talk about the potential markets? R&D?
We have developed a healthy pipeline of customers/partners engagements over a variety of markets from industrial and intelligent transportation to consumers to automotive. Our initial focus is on edge applications for eye, gesture, and face tracking for interactive/smart display and AR/VR markets. These are near term market opportunities with high volume and Oculi technology offers a clear competitive edge. As biology and nature have been the inspiration for much of the technology innovations, developing imaging technology that mimics human vision in efficiency but outperforms in speed is a logical path. It is a low hanging fruit (performance versus price) as Oculi has successfully demonstrated in multiple paid pilot projects with large international customers. Also unlike photos and videos we collect for personal consumption, machine vision is not about pretty images and the most number of pixels.

Also Read:

CEO Update: Tuomas Hollman, Minima Processor CEO

CEO Interview: Dr. Ashish Darbari of Axiomise

CEO Interview: Da Chaung of Expedera