In our first blog installment, we outlined the interference concerns surrounding the coexistence of the new C-band 5G telecom service spanning the band from 3.7 to 3.98 GHz with aviation radar altimeters. Radar altimeters are essential components for safety during landing and takeoff, as they offer precise measurements from the aircraft to the ground. For background on the spectrum allocation involved, please refer to our earlier installment.
We will now consider the components required in a high-fidelity interference analysis aimed at determining the maximum interference potential between a 5G C-band transmitter and a radar altimeter receiver.
The Anatomy of an Interference Analysis
The traditional method for determining whether interference exists has been to simply turn on the radios involved and measure the spectrum. In the case of 5G C-band interference with radar altimeters, this would involve turning on a tower near an airport, pushing peak traffic levels through the radio system, flying an aircraft through the airspace with a particular radar altimeter system, and taking many data samples. Undertaking real measurements is costly for many reasons:
- Testing can only validate one radar altimeter at a time per test aircraft, and depending on antenna interaction with the host airframe, may only apply to one aircraft type at a time
- Other signals within the 5G and radar altimeter band would need to be “quieted” so that measurements are not biased by contributions from other signals in the area
- The airspace would need to be cleared of other aircraft while testing is conducted
- Testing would apply to one 5G base station location at a time, and one airport at a time
These are just some factors that lead to a very high cost of validation through measurement.
With sufficient fidelity, simulation offers a very cost-effective and repeatable way to test and validate combinations of radar altimeters, host aircraft, C-Band 5G base station combinations and parameters, and airport locations. Let’s examine a worst-case interference analysis via simulation. In our case, we will use the Ansys Electronics Desktop, featuring the Ansys HFSS simulator for modeling antennas and their interactions with their local environment, and the Ansys Electromagnetic Interference Toolkit (EMIT) for modeling wideband interference potential between radio systems.
Both in-channel and out-of-band effects are considered. Beyond transmitters and receivers, the antenna systems must also be considered, allowing for the orientation and position of the aircraft and for the beamforming and beam steering characteristics of the 5G antenna system.
Interference scenario modeling can be broken down into three parts, as illustrated in Figure 4.

Figure 4 – The major components of RF interference modeling and simulation
In this case, we are concerned with a single 5G transmitter and a radar altimeter receiver. For purposes of this analysis, we won’t concern ourselves with interference in the other direction (from radar altimeter transmitter to the 5G receiver) but with Ansys EMIT it could be considered.
Emissions Model for the 5G C-Band Transmitter
The 5G Base Station model requires knowledge of its wideband electromagnetic emissions — both within its 5G channels and its out-of-band emissions. Any transmitter that carries messages in the RF signal has out-of-band emissions because of signal modulation, and the FCC and the International Telecommunication Union (ITU) set regulatory limits on the levels of signal transmitted by any licensed (or unlicensed) transmitter. The transmitter is fixed — sitting on the ground or on a fixed tower, but the antenna may have the ability to concentrate its energy in certain directions using a process called beam forming.
In the process of looking for interference potential, we study worst-case effects. In modeling the transmitter, we start with a peak power spectral mask, which shows the maximum power that is used at any frequency at any time. We can also capture effects like harmonics, intermodulation products, broadband noise, narrowband noise, and so forth, but one of the best ways to start is by using the industry regulatory requirements for maximum emissions. The International Telecommunications Union (ITU) sets these standards to ensure safety to people and systems due to RF level exposures. For our examination, we have started by using the specifications for a Wide Area Coverage C-Band base station with a 16-by-16 array, as set forward in the 3GPP Specifications. (If you’re interested in digging into the details, you can find it here.) I should mention that telecom equipment providers may (and do) provide equipment with broadband noise performance that exceeds the values we used; we start with the requirement as this represents a worst-case for a compliant transmitter. In fact, in a supporting study to the FAA by the Radio Technical Commission for Aeronautics (RTCA), we found a number of helpful parameters for defining the 5G radio emissions mask.
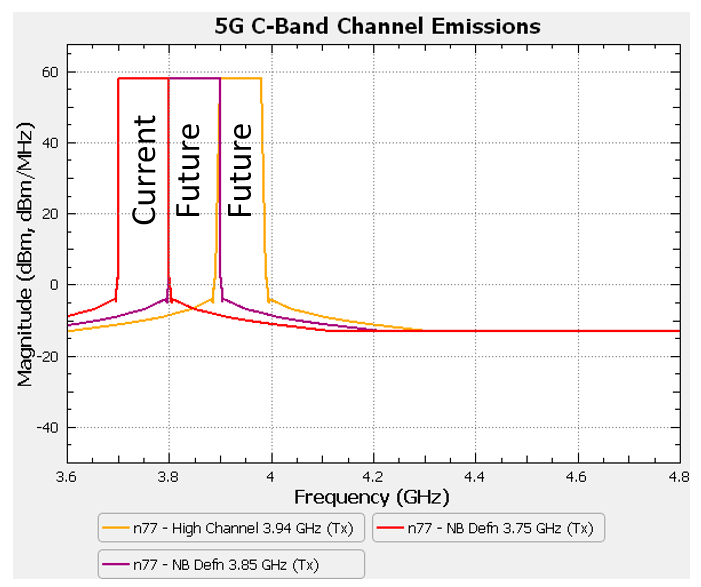
Figure 5 shows the 5G transmitter emission models used in our simulations, and we considered the currently available band at 3.7-3.8 GHz, in addition to the proposed future bands at 3.8-3.9 GHz and 3.9-3.98 GHz.

Figure 5 – The wideband emissions mask specification for the 5G C-band transmitters. Current implements involve only the 100 MHz band from 3.7-3.8 GHz, but future spectrum has been purchased by telecom providers for the 100 MHz band at 3.8-3.9 GHz and the 80 MHz band from 3.9-3.98 GHz.
Receiver Susceptibility Model
The radar altimeter receiver also has a wideband performance characteristic. While it is designed to operate in the 4.2-4.4 GHz band, it can suffer degraded performance if other radios put sufficiently strong emissions into this band. In addition, it is potentially susceptible to radiation outside this band of operation. Radio system designers often look at wideband receiver performance with a metric called susceptibility, which is generally a measure of how well a receiver can reject RF signals at any frequency. Within its band of operation, a receiver is intended to be very sensitive, therefore its susceptibility is very low. Outside its channel of operation, it is designed to be insensitive to incoming signals, so its susceptibility is very high at out-of-band frequencies.
A particular challenge in receiver design is balancing in-band or in-channel susceptibility with out-of-band susceptibility. A receiver might be very sensitive to signals within its band, but a consequence of this sensitivity may be that it can be overloaded by an out-of-band signal that is so strong that it defeats the receiver’s ability to reject it, resulting in a condition known as saturation.
Because saturation events can happen with strong transmission sources near our receiver, any good interference simulation needs to consider the receiver’s sensitivity and saturation characteristics for both the in-channel and the out-of-band signals.
While researching radar altimeter performance models, we found that there are wide performance variations. Arguably the best altimeter systems are used for commercial passenger aircraft, and indeed this is reflected in the types of aircraft that have now been approved for landing at the designated airports under low-visibility conditions. In our effort to develop a model for this demonstration, we looked for a “middle of the road” system to represent the radar altimeter susceptibility.
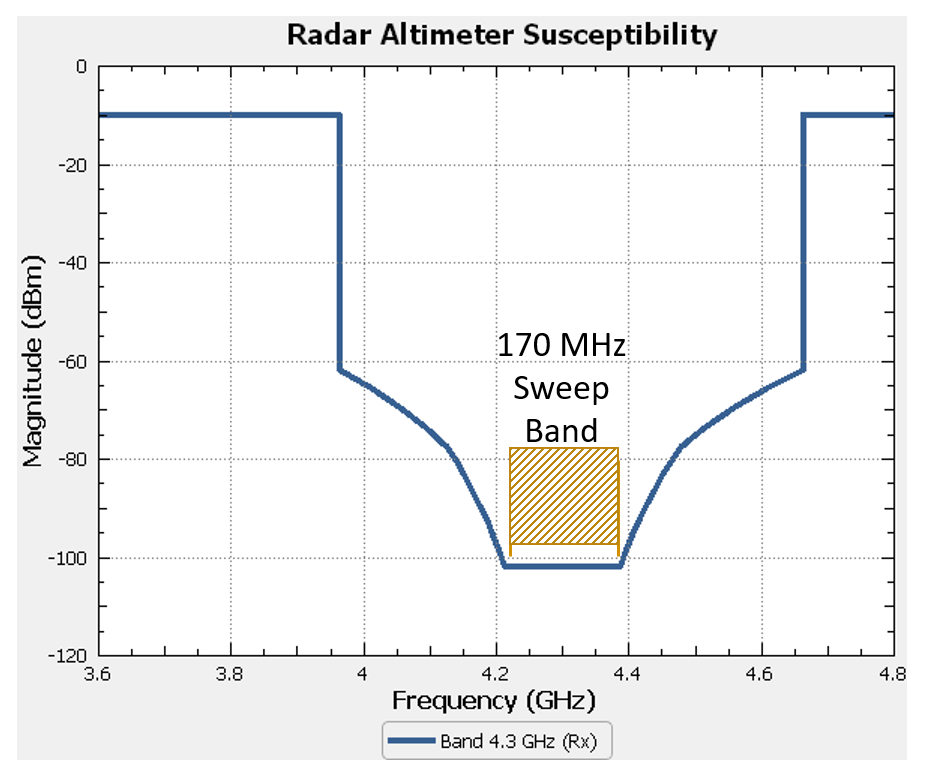
To formulate our model, we found a useful resource in the RTCA study, choosing an altimeter with good wideband characteristics (to yield the best altitude measurement resolution), along with a “reasonably good” receiver saturation level of -10 dBm. This means that the radar should have reasonable performance to reject signals outside of its intended frequency of operation. Figure 6 shows the receiver susceptibility model that we are using for this interference study, based on parameters listed in the RTCA study.

Figure 6 – Receiver susceptibility of a candidate radar altimeter operating at center frequency of 4.3 GHz. Most high-resolution aviation altimeters use 170 MHz of spectrum for measuring range from aircraft to ground.
With models for transmitter emissions and receiver susceptibility, we have two of the three important components of any interference analysis. The third component will be the wireless channel, depicted in Figure 4. We’ll cover the wireless channel and consider an interference analysis for a worst-case scenario in our next blog installment.
Also read:
5G and Aircraft Safety: Simulation is Key to Ensuring Passenger Safety
5G and Aircraft Safety: Simulation is Key to Ensuring Passenger Safety – Part 3
5G and Aircraft Safety: Simulation is Key to Ensuring Passenger Safety – Part 4
Share this post via:


Comments
There are no comments yet.
You must register or log in to view/post comments.