In our previous blog installment, we introduced the components of RF interference modeling, and established models for wideband peak emissions of a 5G C-band transmitter and the wideband receiver susceptibility for a radar altimeter receiver. Here, we consider the third component: the wireless channel, which considers the physics of the antennas and how they couple energy in the environment. After we establish parameters for the wireless channel, we will be in a position to combine all three to get an accurate estimate of the maximum interference potential at any frequency.
Antenna-to-Antenna Coupling
Modeling interference accurately depends upon having accurate models for coupling the power coming out of the transmitter to the receiver — across the entire band. This is important for both in-channel coupling as well as out-of-band emissions coupling. Measurement of antenna coupling is challenging because of the spacing between the antennas and the fact that the radar altimeter antenna is in continual motion.
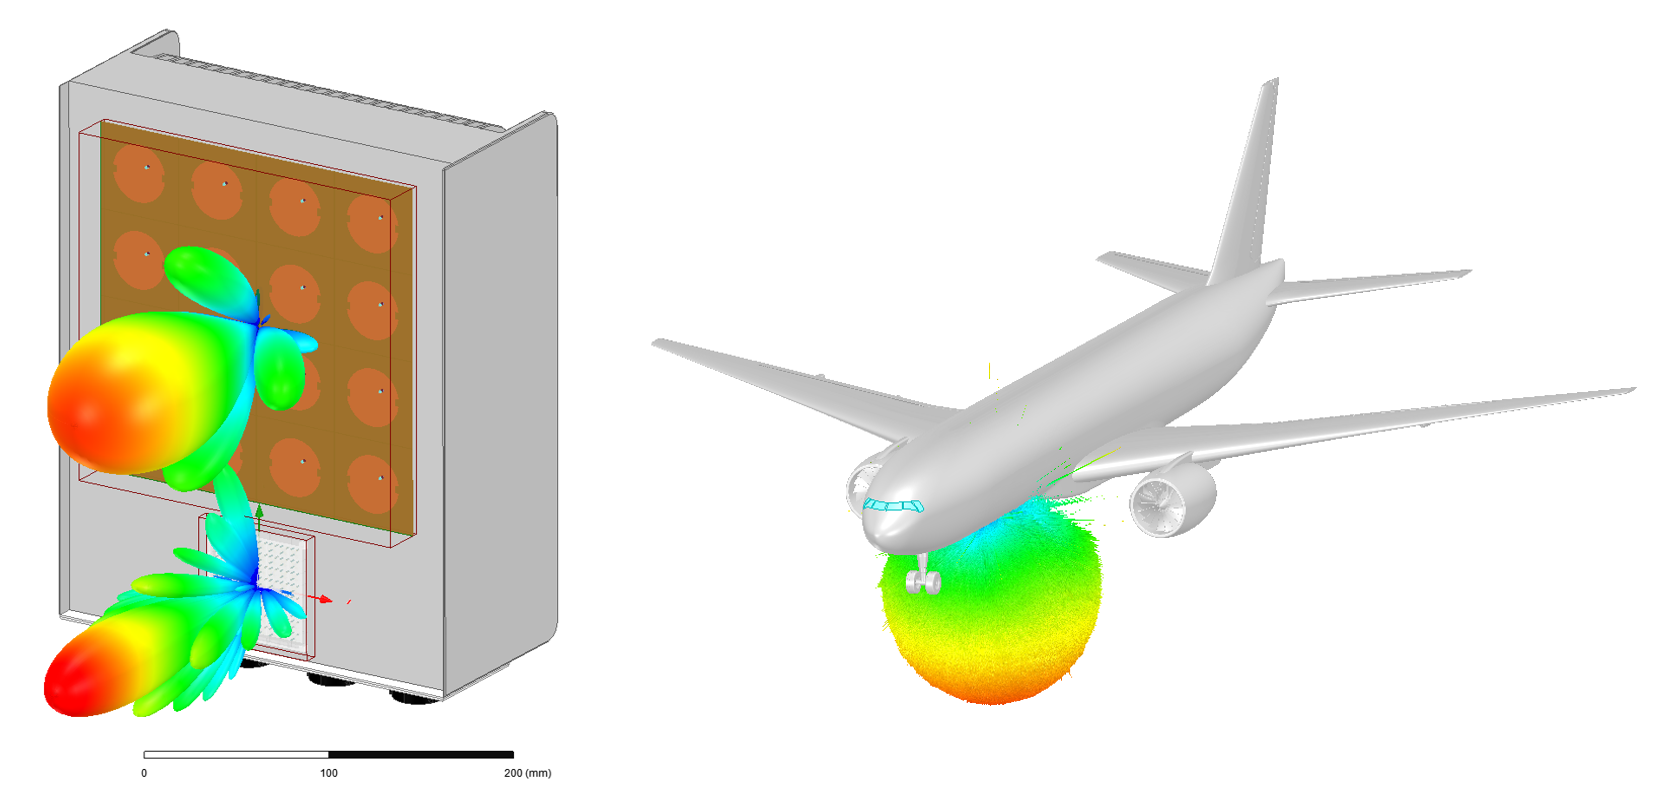
The wireless channel of Figure 4 (in the previous blog entry) consists of the 5G transmit antenna and its characteristics for focusing power in a given direction, the radar altimeter antenna and its directional gain sensitivity, and the propagation (and loss) of the signal as it travels between the two antennas. For accurate antenna performance, Ansys HFSS can be used to accurately predict the antenna behavior through electromagnetic simulation, to capture beamforming performance and the way the antenna’s host platform interaction modifies the antenna’s performance. Figure 6 shows a notional dual band 5G antenna unit and a candidate radar altimeter antenna design under an airliner airframe as simulated by HFSS and HFSS SBR+.

Figure 7 – Ansys HFSS models use electromagnetic physics to simulate the antenna radiation characteristics for a notional 5G radio antenna (left) and an installed radar altimeter antenna on a large commercial aircraft
As you can observe from the patterns shown, the antennas can direct energy in very specific directions. Therefore, the beam steering control of the 5G antenna will be important, as will the location and orientation of the aircraft during landing and takeoff. If the aircraft rolls during these phases of the flight due to turbulence or other actions, the antenna’s sensitivity region will roll with it.
Finally, the link between the antennas must be accurately determined, and this can be computed using standard propagation loss formulas or by using an electromagnetic analysis solution like HFSS SBR+. For our purposes here, we will use a propagation loss model. Ansys EMIT can also include the effects of water vapor, rain, rain rate, and fade effects if desired. Because these effects would only introduce additional losses which would reduce interference, we’ll leave them out for now.
With EMIT, the antenna characteristics and the wireless propagation between them is simulated at all frequencies and used for the chain calculation depicted in Figure 4.
Static Interference Assessment: Putting the Ingredients Together
We would like to conduct a test to see whether either in-band interference or out-of-band interference could be experienced by the radar altimeter due to a 5G transmitter near the airport, for an assumed worst-case static placement of the RF systems involved. This involves an analysis using worst-case coupling between the systems, as well as reasonable candidate designs for the 5G transmitter and radar altimeter receiver. We need a few more details to round out the scenario.
| Distance from 5G base station to airport runway approach | 400 m |
| Height of 5G base station | 40 m |
| Base station antenna gain | 22 dBi (pointed at aircraft) |
| Radar altimeter antenna gain | 11 dBi (aircraft rolling, pointing at 5G base station) |
| Aircraft altitude | 100 m |
This represents a worst case, representing a base station with high power, focusing a beam at the landing aircraft, which is rolling in such a way as to place the peak of the radar altimeter radiation pattern on the base station. However, when setting standards, or studying critical keep-out zones for radiating towers, this is the type of analysis that one needs to use. Any of the parameters in this analysis can be changed at any time to quickly assess interference mitigation strategies.
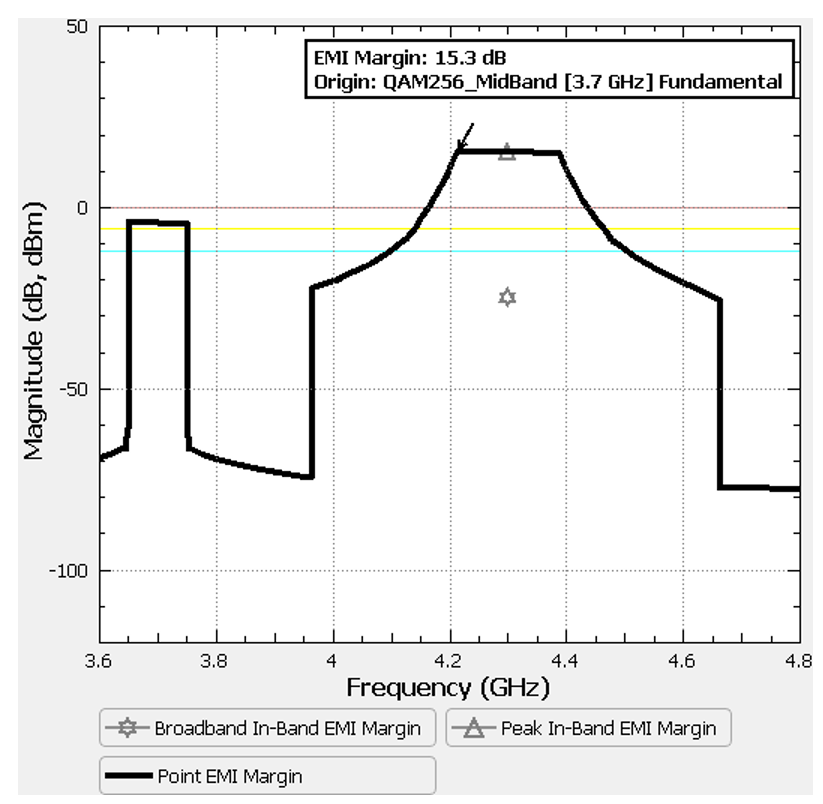
Let’s examine the results for the initial C-Band service rollout in the 100 MHz band from 3.7-3.8 GHz. Figure 8 shows the result of our investigation. The black curve gives us a view of what is going on in the receiver and measures the difference between the transmitted power at each frequency and the receiver’s ability to reject that energy (receiver susceptibility). If this value goes above zero (the red line), we have an interference event because the receiver can’t reject that energy at that frequency. We can also place threshold values to watch for frequencies where we are getting close to an interference event. The plot suggests that the 5G transmitter out-of-band emissions are creating strong interference potential (for our environment conditions) within the receive band of the radar altimeter. The in-band radiation (3.7-3.8 GHz) of the 5G transmitter is close, but not exceeding the receiver saturation so this is not causing interference.

Figure 8 – EMI margin analysis for the current C-Band service implementation for our sample scenario. The out-of-band emissions from the 5G base station causes in-band interference to the radar altimeter antenna in regions where the black curve exceeds the red line. 5G emissions will need to be reduced by at least 15.3 dB to mitigate the interference.
The service providers have spent a great deal of money on all three of these channels, and eventually will want to enable service on the additional 180 MHz contained in the two bands above the current operational band. What happens when these bands are enabled in the future against this radar altimeter in our worst-case scenario?
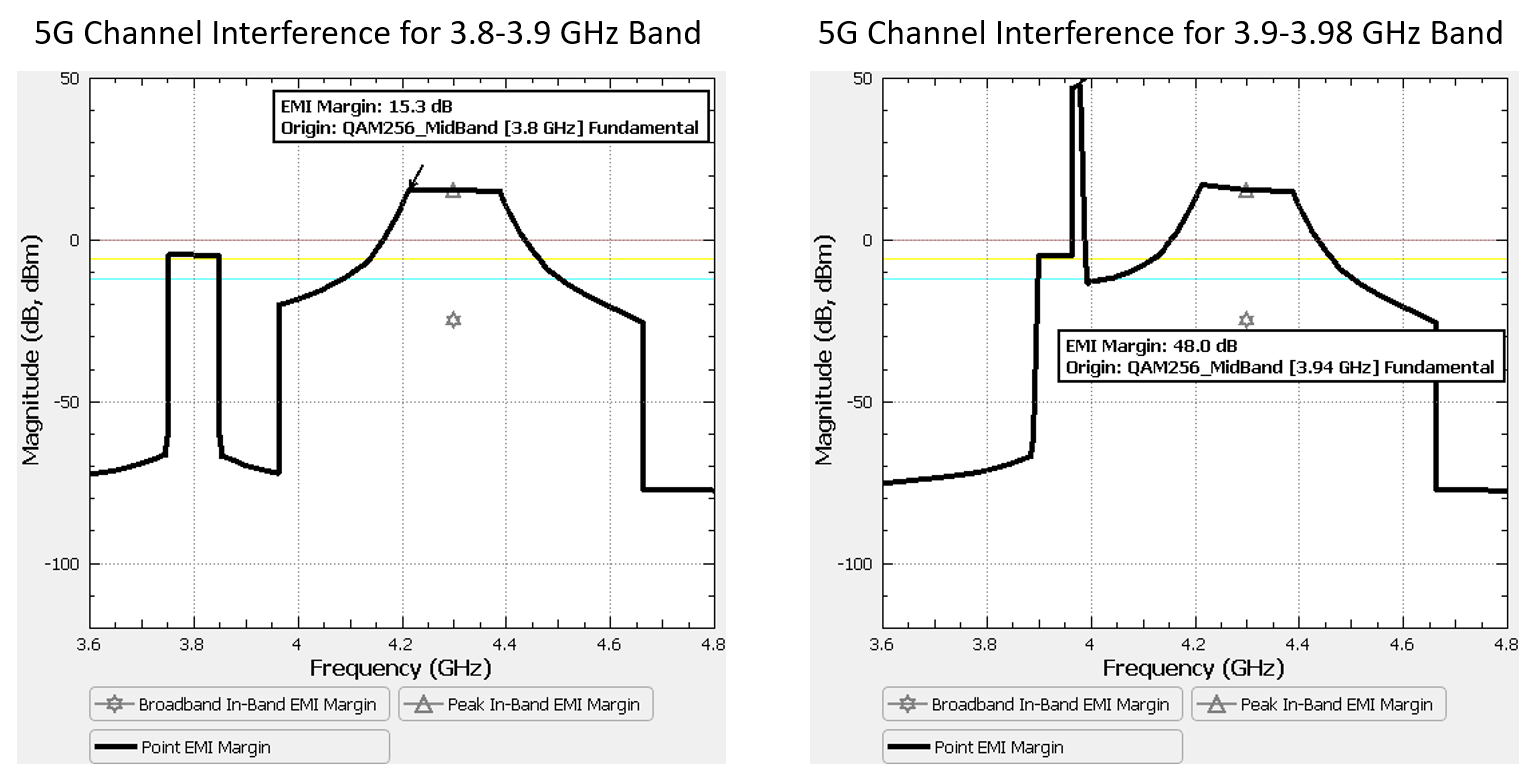
Figure 9 shows that we face basically the same problem for the next 100 MHz band (3.8-3.9 GHz). However, the plot on the right shows that a new problem crops up if the last 80 MHz band (3.9-3.98 GHz) is activated. The interference appears to be due to the 5G emissions mask putting higher power levels into a part of the spectrum where the altimeter receiver has reduced rejection, and strong interference exists here which will require at least an additional 25 dB of 5G signal reduction over the lower two channels to ensure coexistence.

Figure 9 – EMI margin analysis for the future C-Band channels (3.8-3.9 GHz on left, and 3.9-3.98 GHz on right) for our sample scenario. The out-of-band emissions from the 5G base station causes in-band interference to the radar altimeter antenna in regions where the black curve exceeds the red line. In-band interference potential is shown for the 3.8-3.9 GHz channel, whereas very strong out-of-band interference in the radar altimeter receiver is expected to cause receiver saturation from the 3.9-3.98 GHz channel.
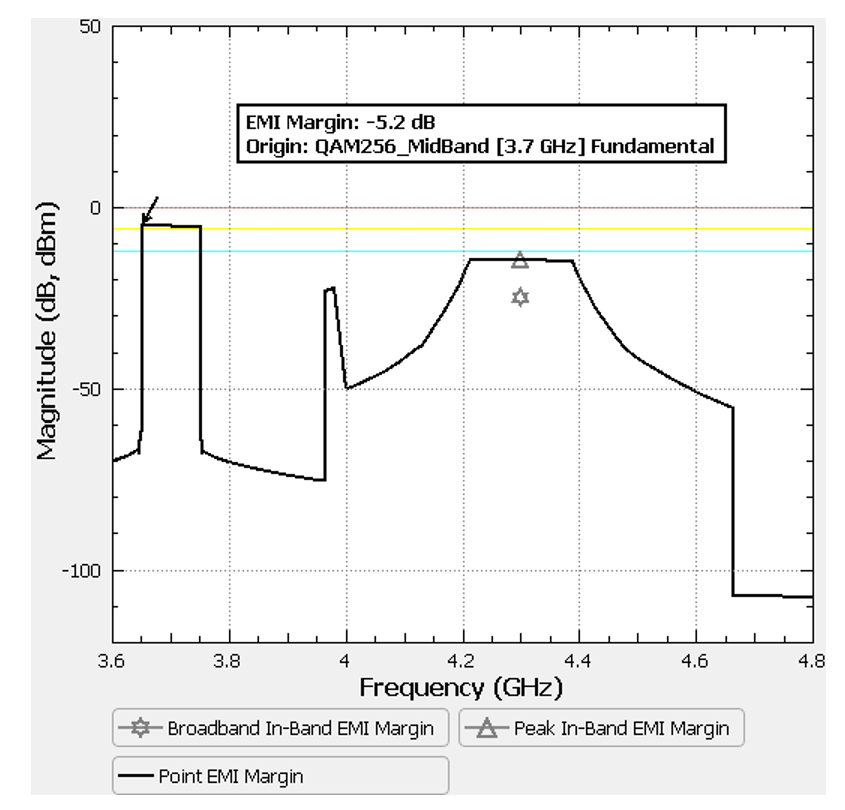
Ansys EMIT can be used to evaluate these mitigation strategies quickly — without requiring a single hour of flight time. For example, if we add a low-pass filter to the 5G transmitting elements (which we could easily design and synthesize using the Ansys Nuhertz FilterSolutions software), we could explore the impact of a filter on reducing the 5G system’s out of band emissions on the radar altimeter. With a low-pass filter added to the 5G transmitter chain in EMIT (1 dB of in-band loss, 40 dB of rejection above 4 GHz), we see an immediate improvement — the interference is eliminated. Figure 10 shows the EMI margin plot with the filter in place, showing that we have 5.2 dB of “head room” before interference occurs at any frequency.

Figure 10 – Adding a low-pass filter to the 5G base station transmitting elements has eliminated interference for the use of the 3.7-3.8 GHz 5G channel on the radar altimeter.
You may wonder whether we use simulation to examine (and validate) specific radar altimeters against specific 5G base station installations at specific airports. Interference potential is a dynamic phenomenon, and the situation changes from moment to moment as the aircraft lands or takes off. In our next blog installment, we’ll hook up this interference modeling machinery to our Ansys AGI STK flight simulation capabilities and show you what the interference looks like during a landing or takeoff when dynamic motion, position, and orientations are considered at a prospective airport setting.
Also read:
5G and Aircraft Safety: Simulation is Key to Ensuring Passenger Safety
5G and Aircraft Safety: Simulation is Key to Ensuring Passenger Safety – Part 2
5G and Aircraft Safety: Simulation is Key to Ensuring Passenger Safety – Part 4
Share this post via:


Comments
There are no comments yet.
You must register or log in to view/post comments.