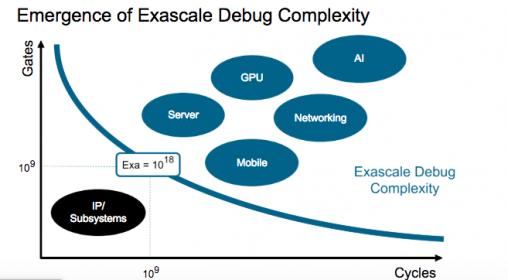
I think Synopsys would agree that they were not an early entrant to the emulation game, but once they really got moving, they’ve been working hard to catch up and even overtake in some areas. A recent webinar highlighted work they have been doing to overcome a common challenge in this area. Being able to boot a billion-gate design, bring up a hypervisor, guest OS, system services and finally applications, running potentially through billions of cycles, is an accomplishment in itself. But then how do you debug such a monster? Synopsys call this exascale debug because running billions of gates through billions of cycles combines to exascale (10[SUP]18[/SUP]) complexity. Finding and root-causing bugs at that scale takes a lot more help than you are likely used to in IP-based debug.

The Webinar presenter (Ribhu Mittal, Dir of Emulations Applications Engg) listed three main challenges in debug at this scale. First the sequential distance between a bug and the root cause of that bug may be significant – perhaps billions of cycles. This might seem improbable at first but consider how a cache error early in bring-up might result in storing an incorrect configuration value, said value not being accessed until much later in running an app. Cache errors notoriously can lead to this kind of long-range problem. The exascale issue here is how you are going to trace back potentially billions of cycles to who knows what in the design might have caused the problem. How do you intelligently decide what to dump, yet converge quickly through a minimum of iterations?
A second problem is indeterminacy. You want emulation to run as fast as possible with no pauses. At the same time, you have multiple asynchronous testbench drivers interacting with the emulation, say USB and PCI VIPs. When a bug is caught (by an assertion for example), if it was timing-sensitive there is no guarantee that it will appear again when you rerun the test. Changes in system load and environment may make the bug intermittent, which isn’t a great place to start when you want to isolate the root cause.
The third problem Ribhu mentioned is efficiently handling the volume of debug data. Streaming out even a selected set of signals at full speed, then expanding them offline and reading them into a debugger such as Verdi could take hours when you’re working at this scale. That’s before you start to work on where and why you have a bug.
Synopsys have refined a methodology and have put work into optimizing this flow for ZeBu; they cite 3 customers who have used these flows effectively. They recommend starting with a breadth-first search using the checker and monitor collateral you probably already get from IPs and subsystem verification teams. In ZeBu you can call out key signals (such as IP interfaces) from this collateral, before compile, to track system-level behavior; you can monitor these through the complete run at full emulation speed. Use the checkers for coarse-grain isolation of problems and monitors to further narrow the window.
The customer use-cases are particularly interesting. What I got from these is that when you are debugging at the system level, you maybe shouldn’t expect to get down to a root-cause in one pass. At this stage, you’re not finding elementary bugs; you’re more likely finding problems manifesting deep in the software stack. That means you likely want to progressively refine down to a window for much more detailed debug where you might do a full-signal dump. The customer examples shown got there in 2-3 passes, which seems fair given the complexity of the problems they isolated.
For handling indeterminacy, ZeBu offers exact signal record and replay, so on a rerun you can disconnect from the testbench and replay exactly what you ran when you saw the bug. Add to this full save and restart with save at periodic checkpoints; this works with signal replay so you can replay from the closest checkpoint before you saw the bug. Together these provide a deterministic and time-efficient way to isolate and debug those annoying intermittent bugs,
Finally, they’ve speeded up digesting those vast quantities of streamed data for offline debug.
They have fast streaming (2TB/s) from ZeBu; you can take this into parallelized expansion, or you can use a high-performance interactive/selective expansion to pick out just the signals you want to check. Synopsys have also added a native ZeBu database to Verdi to speed up load times. Together they say this decreases waveform expansion and load times by 10X.
This is a quick overview of how to drive efficient debug for emulation on big designs with big use-cases. You can watch the webinar HERE.
Share this post via:


Comments
There are no comments yet.
You must register or log in to view/post comments.