
Back in May of 2020 I published some comparisons of the cost to run a TSMC fab in Arizona versus their fabs in Taiwan. I found the fab operating cost based on the country-to-country difference to only be 3.4% higher in the US and then I found an additional 3.8% because of the smaller fab scale. Since that time, I have continued to encounter reports that the US fab costs are approximately 30% higher than countries in Asia. In the studies I have found, most of the cost difference is attributed to “incentives” without a clear explanation of what the incentives are. My calculation does not include incentives but still the size of the difference led me to completely reexamine my assumptions and look into incentives, what they could be and how they would impact the costs I calculate.
Profit and Loss
At the highest-level companies are judged by their Profit and Loss (P&L) and I decided to go through a simple P&L line by line and look at every country-to-country difference that could impact the bottom line profitability.
A P&L is summarized on an income statement, a simple income statement is:
- Revenue – the money received from selling the product
- Cost of Goods Sold (COGS) – the direct costs to produce the product being sold. This is what our Models calculate.
- Gross Margin = Revenue – COGS. For wafer sale prices we estimate gross margin and apply it to the wafer cost.
- Period expenses – Research and Development expenses (R&D), Selling, General and Administration expenses (SG&A) and other expenses.
- Operating Income = Gross Margin – Period Expenses
- Income Before Tax = Operating Income – Interest and Other
- Net Income = Income Before Tax – Tax (tax is based on Income Before Tax)
We can then go through this line by line to look at country by country differences. These line numbers will be referenced below in bold/italics.
For a cost evaluation line 1. Is irrelevant.
Line 2. (COGS) Is a key differentiator.
Cost of Goods Sold
In our Models we break out wafer cost categories as follows:
- Starting Wafer
- Direct labor
- Depreciation
- Equipment Maintenance
- Indirect Labor
- Facilities
- Consumables
Starting wafers – our belief is that starting wafers are globally sourced and the country where they are purchased does not impact the price. This has been confirmed in multiple expert interviews including by wafer suppliers.
Direct Labor (DL) – all our Models have DL rates by country and year for 24 countries. In 2021 the difference in labor rate from the least expensive to most expensive country was 21x! For each wafer size and product type we have estimates of labor hours required and we calculate the direct labor cost. We believe this calculation accurately reflect cost differences between countries in all our Models. It should be noted here, that leading edge 300mm wafer fabs are so highly automated that there are very few labor hours in the process and even with a huge labor rate difference, the percentage impact on wafer cost is small.
Depreciation – this is the most complex category. The capital cost to build a wafer fab is depreciated over time to yield with the depreciation amount charged off to the P&L.
We break out the capital cost to build a facility into:
- Equipment – we believe equipment is globally sourced and the cost is basically the same in any country. We did get one input that the US cost are slightly higher due to import costs, but we don’t believe this is significant.
- Equipment Installation – install costs in our Models are based on equipment type with different costs assigned to; inspection and metrology equipment, lithography equipment, and other equipment types (ALD, CVD, PVD, etc.). What we have found in our interviews is the costs vary by country with the variation being different for the different categories. For example, inspection and metrology equipment installation is heavily weighted toward electrical work that varies in cost between countries. Other equipment is more heavily weighted toward process hookups that are less country dependent. Lithography equipment is intermediate between the two.
- Automation – we believe automation is globally sourced and does not change in cost between countries although we are still checking on this assumption.
- Building – in the past we assumed that building costs were the same by country believing the major components were globally sourced. In our expert interviews we found there is a significant difference in cost per country. Revisiting fab construction costs we have in our databases also found differences after accounting for product types. Our latest Strategic Cost and Price Model fully accounts for these differences.
- Building Systems – as with the building we assumed building systems were globally sourced and the cost didn’t vary by country, but this only partially true. Our latest Strategic Cost and Price Model fully accounts for these differences.
- Capital Incentives – if a company receives government grants to help pay for the investments to build a wafer fab, they will impact the actual capital outlay for the company building the Fab. In the past we have not accounted for this, we now allow capital incentives to be entered into the model.
Our models all calculate the capital investment by fab using a detailed bottoms-up calculation. The equipment, equipment installs, and automation are then depreciated over five years, the building systems over ten years and the building over fifteen years. We use these default values because most companies use these lifetimes for reporting purpose. There are lifetimes by country differences for tax purposes, but taxes and reporting values are typically calculated separately. There are some companies that don’t use five years for equipment but to enable consistent comparison between fabs we use five years as a default, although the ability to change the lifetimes is built into many of our Models.
Equipment Maintenance – equipment maintenance costs include consumable items, repair parts and service contracts. The technicians and engineers that maintain equipment at a company are accounted for in the Indirect Labor Cost described below.
In our Strategic Cost and Price Model the country differences are accounted for as follows:
- Consumables – we continue to believe this is the same by country but there are company to company differences. For example, an etcher has quartz rings in the etch chamber that some companies source from the Original Equipment Manufacturers and other companies may source in the secondary market at lower cost.
- Repair Parts – repair parts are distinct from consumables in that they aren’t expected to normally wear out during operation. We believe these are globally sourced and don’t vary in cost by country.
- Service Contracts – we believe there is some difference in service contract costs due to labor rate differences.
Our latest Strategic Cost and Price Model fully accounts for these differences.
Indirect Labor (IDL) – IDL is made up of engineers, technicians, supervisors and managers, our Models have engineer salaries by country for twenty-four countries by year and ratios are used to calculate the technician, supervisor, and manager salaries. Difference in engineer salaries vary by 12x between the lowest cost and highest cost countries. For each process/fab being modeled we look at the IDL hours required for the process and break out the IDL hours between the four IDL categories. We believe all our Models correctly reflect country to country differences currently. As with DL costs, IDL costs have less impact on wafer cost than you might expect but are more significant than DL costs.
Facilities – we break out facilities into Ultrapure Water, Water and Sewer, Electric, Natural Gas, Communications, Building Systems Maintenance, Facility Occupancy, and Insurance. The main costs are Electric, Natural Gas, Building Systems Maintenance, and Insurance. Our Models all account for Electric and natural gas rates by country for twenty-four countries. Electrical rates vary by 2.8x by country and natural gas by 7.6x by country and both are fully accounted for in the models. Facility system maintenance and facility occupancy also vary by country. Our latest Strategic Cost and Price Model fully accounts for these differences.
Consumables – all our Models calculate consumables in varying degrees of detail. We believe materials are sourced globally and do not vary in price by country. There are some country-to-country tariff differences but the implementation of this is so complex and constantly changing that we do not model. It. We do not believe the impact is significant.
Profit and Loss – Continued
Line 3 – Gross Margin
Gross Margin isn’t part of a COGS discussion but many of our customers buy wafers from foundries. Foundry wafer prices are Wafer Cost + Foundry Margin and we have put significant effort into providing Foundry Margin guidance in our models. Foundry Margins in our Models vary company to company and within a company by year and quarter, purchasing volume and process node. They are not country dependent.
Line 4 – Period Expenses
Not relevant to a wafer cost discussion
Line 5 Operating Income
Not relevant to a wafer cost discussion
There are two other places in the P&L where we may see country-to-country impact.
Line 6 Income Before Taxes
if a government offers a company low-cost loan this would reduce interest expenses in the interest line. In my opinion low-cost loans are incentives.
Line 7 Net Income
Tax – there are two pieces to the tax line, one is country-to-country tax rate differences and the other is preferential tax rates. In my opinion tax rate differences are a structural difference whereas a preferential tax rate is an incentive. For example, the corporate tax rate in the US is 25.8% and in Taiwan is 20%. These tax rates are normally applied to Income Before Taxes.
In summary we see country to country operating cost differences and our current release of our Strategic Cost and Price Model models these differences accurately and in detail.
There is also country to country tax rate differences that we don’t model because they are below the COGS line.
Finally, there are incentives, we see these as having three parts:
- Capital grants that would reduce capital cost and therefore depreciation in COGS.
- Low-rate loans that would impact interest expenses.
- Tax incentives, investment, R&D and other tax reductions.
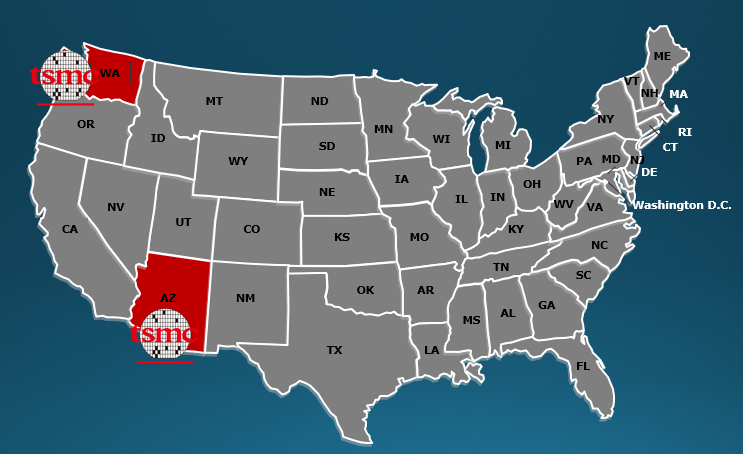
TSMC Arizona Fab
Having reviewed all the elements of wafer cost difference we can now investigate how TSMC’s cost in Arizona will match up to their cost in Taiwan.
TSMC currently produces 5nm wafers in Fab 18 – phases 1, 2, and 3 in Taiwan. We believe each phase is current running 40,000 wafer per month (wpm) with plans to ramp to 80,000 wpm per phase over the next two years. In contrast the Arizona fab is planned to produce 20,000 wpm (at least initially). This will lead to three differences in costs:
- Country to country operating cost difference – after accounting for all the operating cost differences, we now find a 7% increase in cost to operate in Arizona versus Taiwan. We find a higher difference than we did previously due to now including some factors we had previously missed. Having reviewed a P&L line by line and consulting with a wide range of experts we do not believe there are any missing parts to this analysis. An interesting note here is direct labor cost in the US are over 3x the rate in Taiwan, but they have only minimal impact because in Taiwan direct labor is only 0.1% of the wafer cost and even tripling or quadrupling the labor rate it is still less than 1% of the wafer cost. Utility costs are the other hand are lower in the US.
- Fab size differences – accounting for a 20,000 wpm fab in the US versus 80,000 wpm in Taiwan, plus the efficiency of clustering multiple fabs together in Taiwan adds 10% to the country-to-country difference found in 1. For a total 17% difference. We want to highlight that the 10% additional cost is due to TSMC’s decision to build a small fab in the US. We expect the initial Arizona cleanroom to have room to ramp up to more than 20,000 wpm and the site to have room for additional cleanrooms. Over time if TSMC ramps up and expands the site the 10% difference can be reduced or eliminated.
- Incentives – to the best of my knowledge Taiwan does not offer direct capital grants. To the best of my knowledge Taiwan does not offer low-cost loans. In the past Taiwan offered tax rebates for capital investment in fabs but my understand is this program has ended. There are R&D tax rebates available, and Taiwan has a lower corporate tax rate than the US (although this isn’t an “incentive” in my view). To investigate the tax advantage for TSMC in Taiwan versus the US I have compared TSMC’s effective tax rate over the last three years to Intel’s effective tax rate in the last three years. Surprisingly they aren’t that different, now I know there is a lot of complex financial engineering in Taxes, but it is the best comparison I can find. TSMC ‘s tax rate for 2018, 2019 and 2020 is 11.7%, 11.4% and 11.4% respectively. Over the same period Intel’s tax rate was 9.7% (one-time benefits) in 2018, 12.5%, in 2019, and 16.7% (NAND Sale) in 2020. So over three years TSMC paid 11.5% and Intel paid 13.1% as a tax rate which isn’t that different.
Conclusion
The bottom line to all this is the cost for TSMC to make wafers in the US is only 7% higher than Taiwan if they built the same size fab complex in the US as what they have in Taiwan. Because they are building a smaller Fab complex the cost will be 17% higher but that is due to TSMC’s decision to build a smaller fab, at least initially.
I do want to point out this doesn’t mean the US is not at a bigger cost disadvantage versus any other country. India has reportedly discussed providing 50% of the cost of a fab as part of an attempt to get Taiwanese companies to set up a fab in India. At least in the past the national and regional governments in China have offered large incentives. Israel has also provided significant incentives to Intel in the past. But under current conditions a US fab is only 7% more expensive than a fab in Taiwan if all factors other than the location are the same.
Also Read:
VLSI Technology Symposium – Imec Alternate 3D NAND Word Line Materials
VLSI Technology Symposium – Imec Forksheet
Share this post via:


Comments
16 Replies to “TSMC Arizona Fab Cost Revisited”
You must register or log in to view/post comments.