

Wendy Chen, MBA from the University of Manchester, has been the Founder and CEO of MSquare Technology since 2021. With over 23 years in the semiconductor industry, Wendy’s career includes roles as Sales Director at Synopsys Technology, Vice President at TF-AMD, and Vice President at Alchip Asia Pacific. Her extensive experience and leadership have been key to MSquare Technology’s growth and innovation.
Tell us about your company?
Our company, MSquare Technology, is incorporated in 2021 as a leading provider of integrated circuit IPs and Chiplets. dedicated to addressing the challenges of chip interconnectivity and vertical integration in the AI era. Currently we operate offices in Taipei, Shanghai, Sydney, and San Jose, boasting a team of over 150 employees, with 80% dedicated to research and development. We strive to foster an open ecosystem service platform for AI and Chiplets, providing comprehensive support for innovation and development within the IC and Chiplet industry. MSquare’s IP products have been successfully validated by notable foundries’ process nodes and brought to mass production, spanning from 5nm to 180nm and covering over 400 different process nodes across 5 leading foundries. The R&D team has launched interconnect interface IPs including HBM, LPDDR, ONFI, UCIe, eDP, PCIe, USB, as well as Chiplet solutions represented by M2LINK.
What problems are you solving?
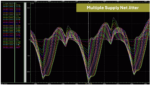
In the current climate of tight semiconductor supply chains and rising costs, we leverage our robust portfolio, substantial supply chain resources, and system integration capabilities to provide customers with cutting-edge technology, a shortened time to market, and reduced design cost. We offer clients validated IP products equipped with the latest technological advancements.
What application areas are your strongest?
We possess distinct strengths in high-speed interface IPs, Chiplets, foundation IPs and integrated services. These technologies find widespread application in sectors like AI, Data Centers, Automotive Electronics, the IoT, and Consumer Electronics. In scenarios that require extensive data processing and rapid data transmission, our solutions substantially improve efficiency and performance.
- AI & Data Center: We specializes in providing advanced interface IP and Chiplet products for High Performance Computing and AI applications. Our product portfolio is designed to meet the demands of AI and Data Centers for high-speed, high-bandwidth memory and interconnect technologies, ensuring the efficiency and security of data processing.
- Automative: Our products have obtained ISO 26262 functional safety certification, ensuring the most advanced functionality and reliable, safe operation.
- Internet of Things: With our high-performance, low-power IP solutions, are designed to enhance the security and communication efficiency of IoT devices, facilitating safe and efficient data transmission across applications such as smart homes, industrial automation, and smart cities.
- Consumer Electronics: Our high-performance, low-power IP solutions enable devices such as smartphones, tablets, and smartwatches to achieve faster processing speeds, richer multimedia capabilities, and extended battery life, provides robust momentum for creating the next generation of smart devices.
What keeps your customers up at night?
In the post-Moore era, customers across various industries—such as AI, data centers, automotive, and consumer electronics—face significant challenges related to memory bandwidth/density and system costs. As computational demands and model complexities increase, traditional memory solutions often fall short in several key areas:
- High Memory Costs: With the growing need for larger memory capacities to handle complex and memory-intensive applications, costs associated with high-bandwidth memory (HBM) can be prohibitive. Many customers struggle with the high cost per unit bandwidth and the limited availability of advanced memory solutions.
- System Integration and Scalability: Integrating large memory capacities into computing systems traditionally requires complex and costly silicon interposers, which increase system costs and complicate design.
- Performance Bottlenecks: The need for higher memory bandwidth to improve inference throughput is critical, yet existing solutions often face limitations in achieving the necessary performance levels.
To address these challenges, MSquare Technology offers our innovative HBM3 IO-Die solution. This approach provides several key benefits:
- Cost Efficiency: By decoupling the HBM host IP from SoCs and utilizing a separate IO-Die that converts the HBM protocol to the UCIe protocol, we reduce the need for expensive silicon interposers. This integration allows for a more cost-effective solution with broader process coverage and improved availability.
- Enhanced Performance: Our HBM3 IO-Die incorporates the latest 32Gbps UCIe IP, which significantly increases memory bandwidth and supports larger memory capacities within a single computing node. This reduces the need for synchronization across multiple nodes and enhances overall system performance.
- Flexibility and Scalability: The UCIe-based approach enables customers to integrate various Chiplets and memory types more flexibly. This modularity not only lowers SoC development and packaging costs but also allows for greater customization to meet specific application requirements.
- Advanced Technology: MSquare’s commitment to standardizing Chiplet interfaces and our early adoption of the UCIe standard ensure that our solutions are at the cutting edge of technology. Our HBM3 IO-Die, expected for mass production by the end of 2024, represents a significant advancement in addressing the memory and performance needs of modern computing systems.
By offering these advanced solutions, MSquare helps our customers overcome the limitations of traditional memory solutions, manage costs effectively, and achieve superior performance in a rapidly evolving technological landscape.
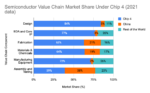
What does the competitive landscape look like and how do you differentiate?
The interface IP and Chiplet sectors are experiencing rapid growth, with fierce competition dominated by major global corporations. By 2030, the market size for IPs is projected to reach $10 billion, while the Chiplet market could expand to ten times that of the IP market. We believe Chiplets represent a revolutionary shift in the semiconductor industry, succeeding IDM and Fabless models, with high-speed interconnects being essential for fulfilling end-application requirements. We hold essential capabilities and resources for Chiplet production—including comprehensive, one-stop solutions and strong supply chain integration. These assets enable us to swiftly adapt to the fast-changing market landscape and provide tailored solutions to our clients.
What new features/technology are you working on?
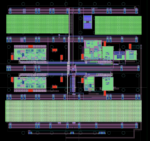
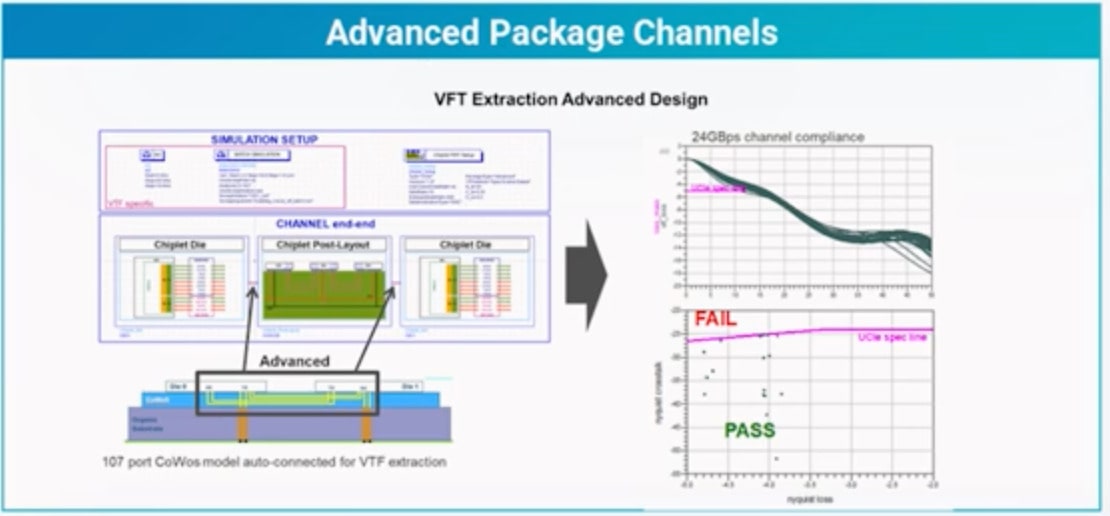
Our latest technology, the M2LINK solution, decoupled the HBM host IP from SoCs by developing a separate IO-Die that converts the HBM protocol to the UCIe protocol. This IO-Die is packaged with the HBM stack into a single module, allowing direct connectivity on a common substrate without using a silicon interposer. Compatible with UCIe1.1 Die-to-Die technology, which offers a high clock frequency of up to 16GHz, provides a data transfer rate of up to 32Gbps per lane, and delivers 1Tbps (512Gbps TX + 512Gbps RX) bandwidth per module for standard packages. This capability significantly supports the efficient computation of complex AI models.
How do customers normally engage with your company?
Our customers typically engage with us in following ways:
- IP Licensing: Customers can license various high-speed interface IPs, such as HBM, UCIe, PCIe, LPDDR, ONFI, etc. We provide thorough technical support and enables customers to integrate these IPs into their chip designs.
- Chiplet Design: We offer Chiplet design services, which follow a process from design specifications through to sampling and verification. This engagement is for customers who need customized solutions beyond standard IP licensing.
- One-stop Chip Design Service: We provide a comprehensive service that covers the entire lifecycle of chip development, including chip design, fabrication, packaging, and finally, testing.
We can be reached out through our sales, technical support, and marcom teams.
Our contact page: https://en.m2ipm2.com/AboutStd.html#s50019
Our website: https://en.m2ipm2.com/
Our LinkedIn: https://linkedin.com/company/m2ipm2
Also Read:
CEO Interview: BRAM DE MUER of ICsense


