A Field-Programmable Gate Array (FPGA) can implement arbitrary digital logic, anything from a microprocessor to a video generator or crypto miner. An FPGA consists of many logic blocks, each typically consisting of a flip flop and a logic function, along with a routing network that connects the logic blocks. What makes an FPGA special is that it is programmable hardware: you can redefine each logic block and the connections between them. The result is you can build a complex digital circuit without physically wiring up individual gates and flip flops or going to the expense of designing a custom integrated circuit.
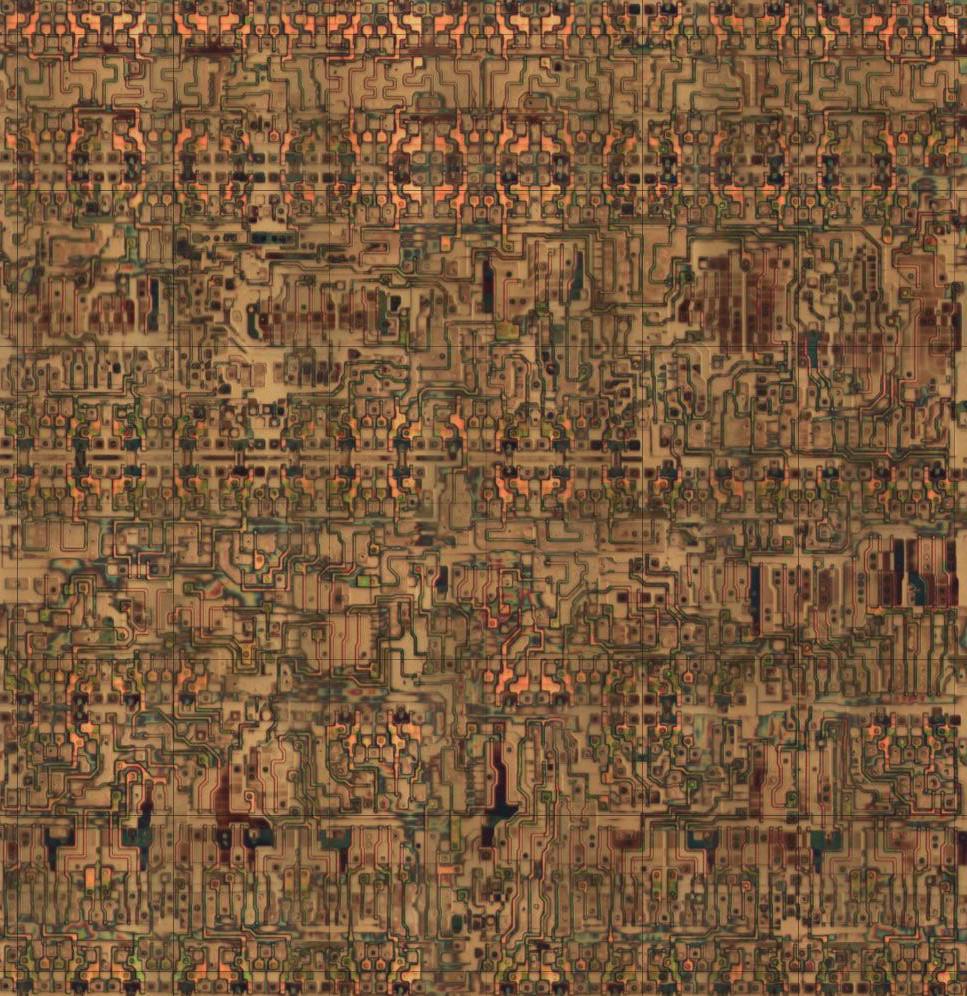
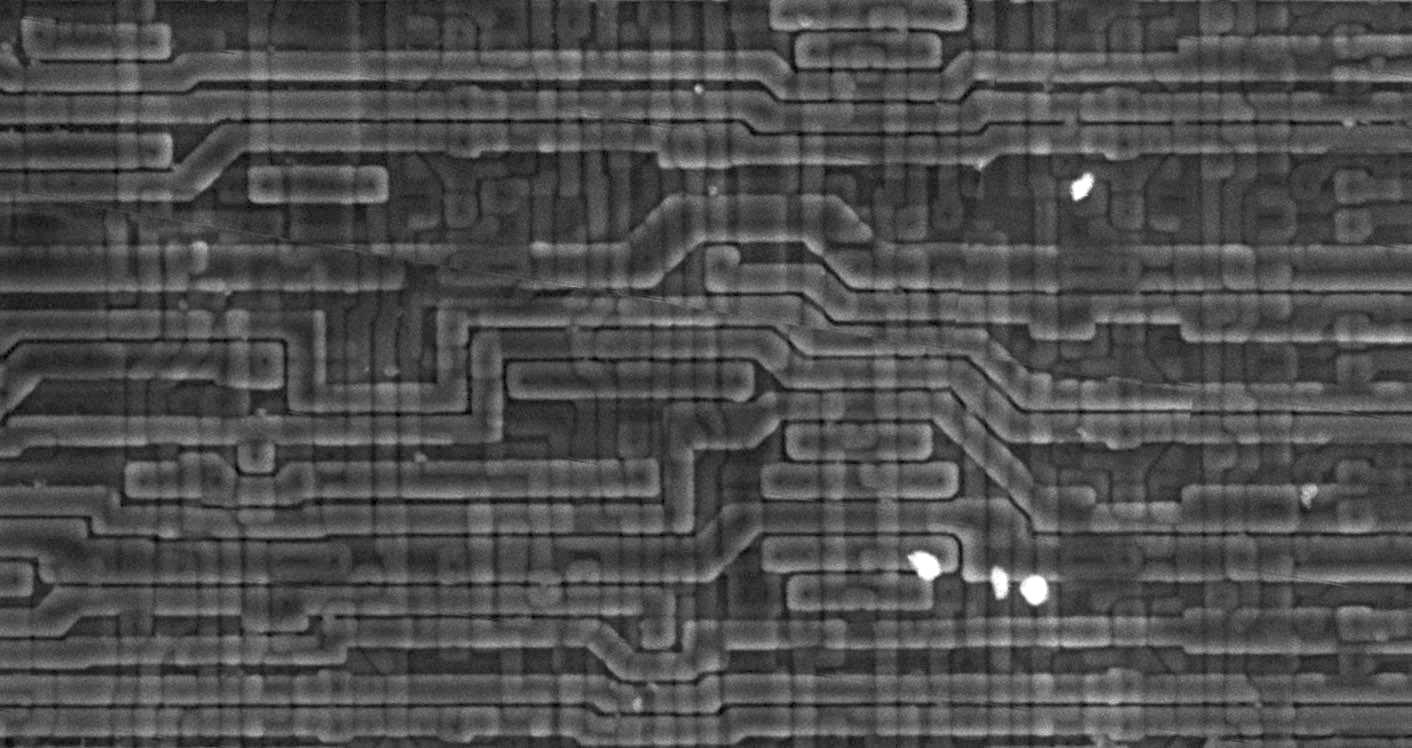
Die photo closeup showing the circuitry for one of the 64 tiles in the XC2064 FPGA. The metal layers have been removed, exposing the silicon and polysilicon transistors underneath. Click for a larger image. From
siliconpr0n.
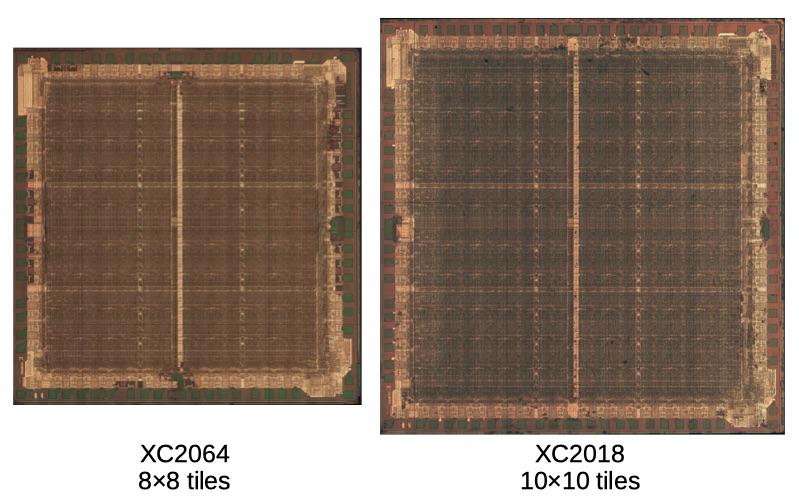
The FPGA was invented by Ross Freeman1 who co-founded Xilinx2 in 1984 and introduced the first FPGA, the XC2064. 3 This FPGA is much simpler than modern FPGAs—it contains just 64 logic blocks, compared to thousands or millions in modern FPGAs—but it led to the current multi-billion-dollar FPGA industry. Because of its importance, the XC2064 is in the Chip Hall of Fame. I reverse-engineered Xilinx’s XC2064, and in this blog post I explain its internal circuitry (above) and how a “bitstream” programs it.
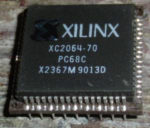
The Xilinx XC2064 was the first FPGA chip. Photo from
siliconpr0n.
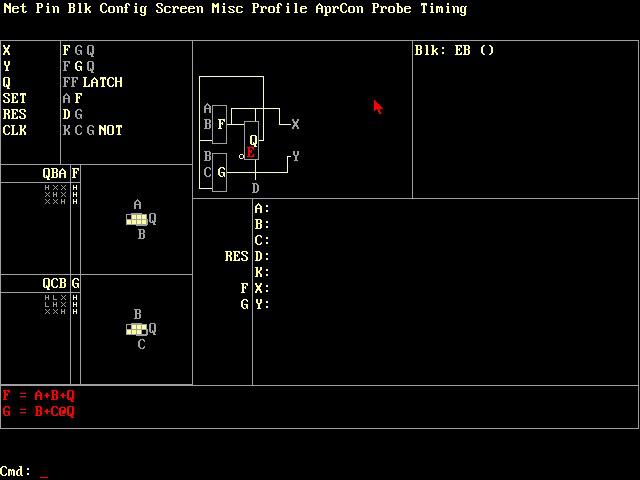
Nowadays, an FPGA is programed in a hardware description language such as Verilog or VHDL, but back then Xilinx provided their own development software, an MS-DOS application named XACT with a hefty $12,000 price tag. XACT operated at a lower level than modern tools: the user defined the function of each logic block, as shown in the screenshot below, and the connections between logic blocks. XACT routed the connections and generated a bitstream file that could be loaded into the FPGA.
Screenshot of XACT. The two lookup tables F and G implement the equations at the bottom of the screen, with Karnaugh map shown above.
An FPGA is configured via the bitstream, a sequence of bits with a proprietary format. If you look at the bitstream for the XC2064 (below), it’s a puzzling mixture of patterns that repeat irregularly with sequences scattered through the bitstream. There’s no clear connection between the function definitions in XACT and the data in the bitstream. However, studying the physical circuitry of the FPGA reveals the structure of the bitstream data and it can be understood.
Part of the bitstream generated by XACT.
How does an FPGA work?
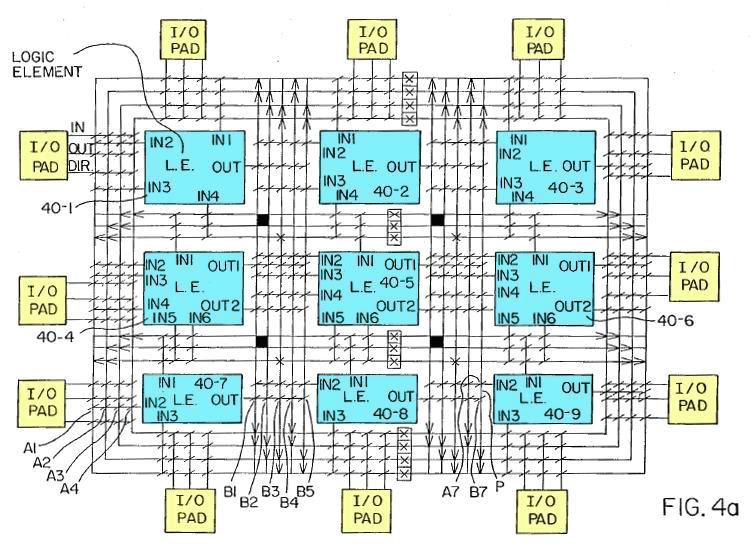
The diagram below, from the original FPGA patent, shows the basic structure of an FPGA. In this simplified FPGA, there are 9 logic blocks (blue) and 12 I/O pins. An interconnection network connects the components together. By setting switches (diagonal lines) on the interconnect, the logic blocks are connected to each other and to the I/O pins. Each logic element can be programmed with the desired logic function. The result is a highly programmable chip that can implement anything that fits in the available circuitry.
The
FPGA patent shows logic blocks (LE) linked by an interconnect.
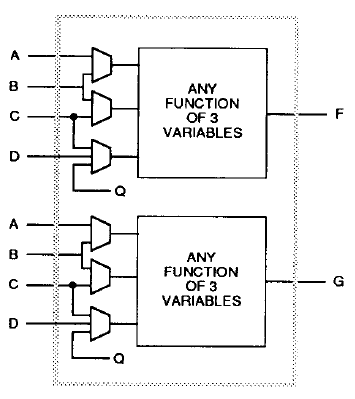
CLB: Configurable Logic Block
While the diagram above shows nine configurable logic blocks (CLBs), the XC2064 has 64 CLBs. The diagram below shows the structure of each CLB. Each CLB has four inputs (A, B, C, D) and two outputs (X and Y). In between is combinatorial logic, which can be programmed with any desired logic function. The CLB also contains a flip flop, allowing the FPGA to implement counters, shift registers, state machines and other stateful circuits. The trapezoids are multiplexers, which can be programmed to pass through any of their inputs. The multiplexers allow the CLB to be configured for a particular task, selecting the desired signals for the flip flop controls and the outputs.
A Configurable Logic Block in the XC2064, from the
datasheet.
You might wonder how the combinatorial logic implements arbitrary logic functions. Does it select between a collection of AND gates, OR gates, XOR gates, and so forth? No, it uses a clever trick called a lookup table (LUT), in effect holding the truth table for the function. For instance, a function of three variables is defined by the 8 rows in its truth table. The LUT consists of 8 bits of memory, along with a multiplexer circuit to select the right value. By storing values in these 8 bits of memory, any 3-input logic function can be implemented.4
The interconnect
The second key piece of the FPGA is the interconnect, which can be programmed to connect the CLBs in different ways. The interconnect is fairly complicated, but a rough description is that there are several horizontal and vertical line segments between each CLB. CLB. Interconnect points allow connections to be made between a horizontal line and a vertical line, allowing arbitrary paths to be created. More complex connections are done via “switch matrices”. Each switch matrix has 8 pins, which can be wired together in (almost) arbitrary ways.
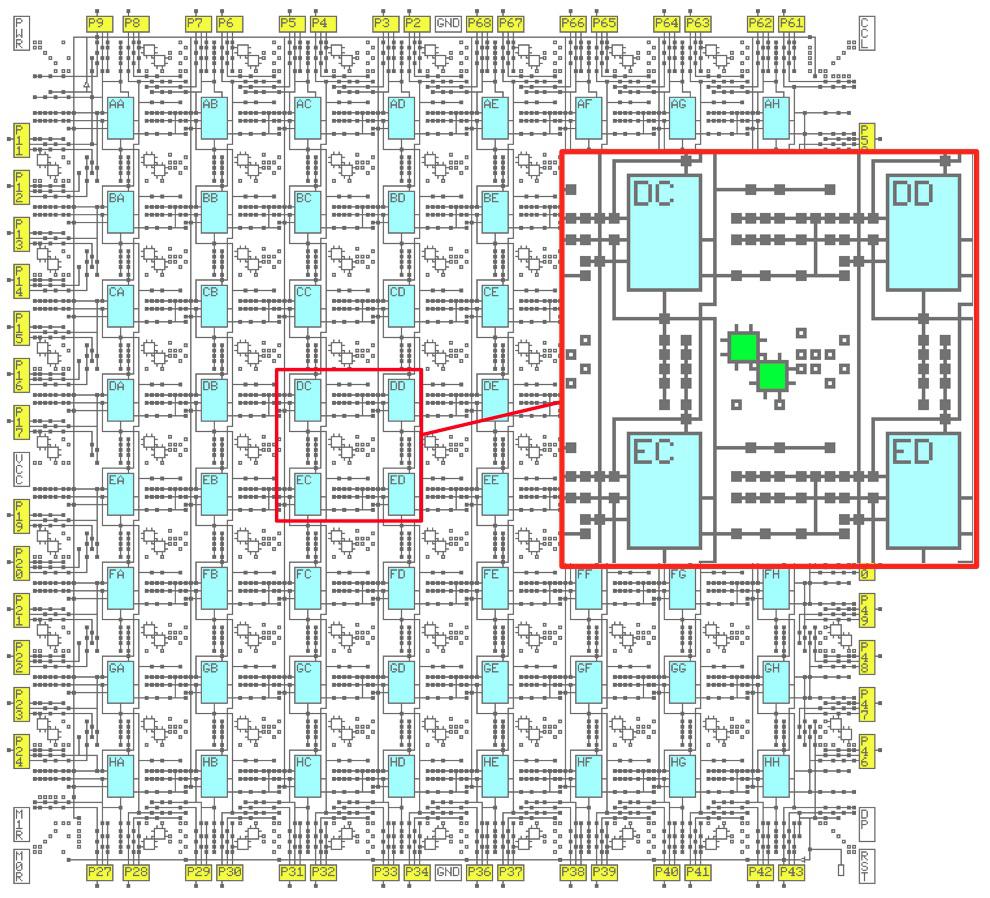
The diagram below shows the interconnect structure of the XC2064, providing connections to the logic blocks (cyan) and the I/O pins (yellow). The inset shows a closeup of the routing features. The green boxes are the 8-pin switch matrices, while the small squares are the programmable interconnection points.
The XC2064 FPGA has an 8 by 8 grid of CLBs. Each CLB has an alphabetic name from AA to HH.
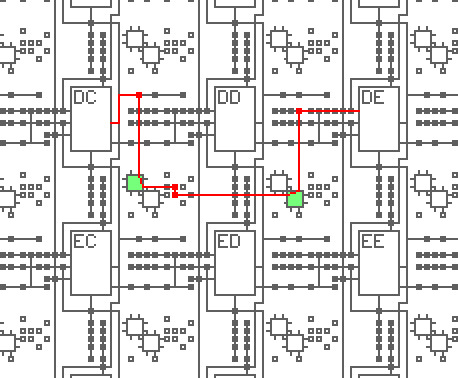
The interconnect can wire, for example, an output of block DC to an input of block DE, as shown below. The red line indicates the routing path and the small red squares indicate activated routing points. After leaving block DC, the signal is directed by the first routing point to an 8-pin switch (green) which directs it to two more routing points and another 8-pin switch. (The unused vertical and horizontal paths are not shown.) Note that routing is fairly complex; even this short path used four routing points and two switches.
Example of a signal routed from an output of block DC to block DE.
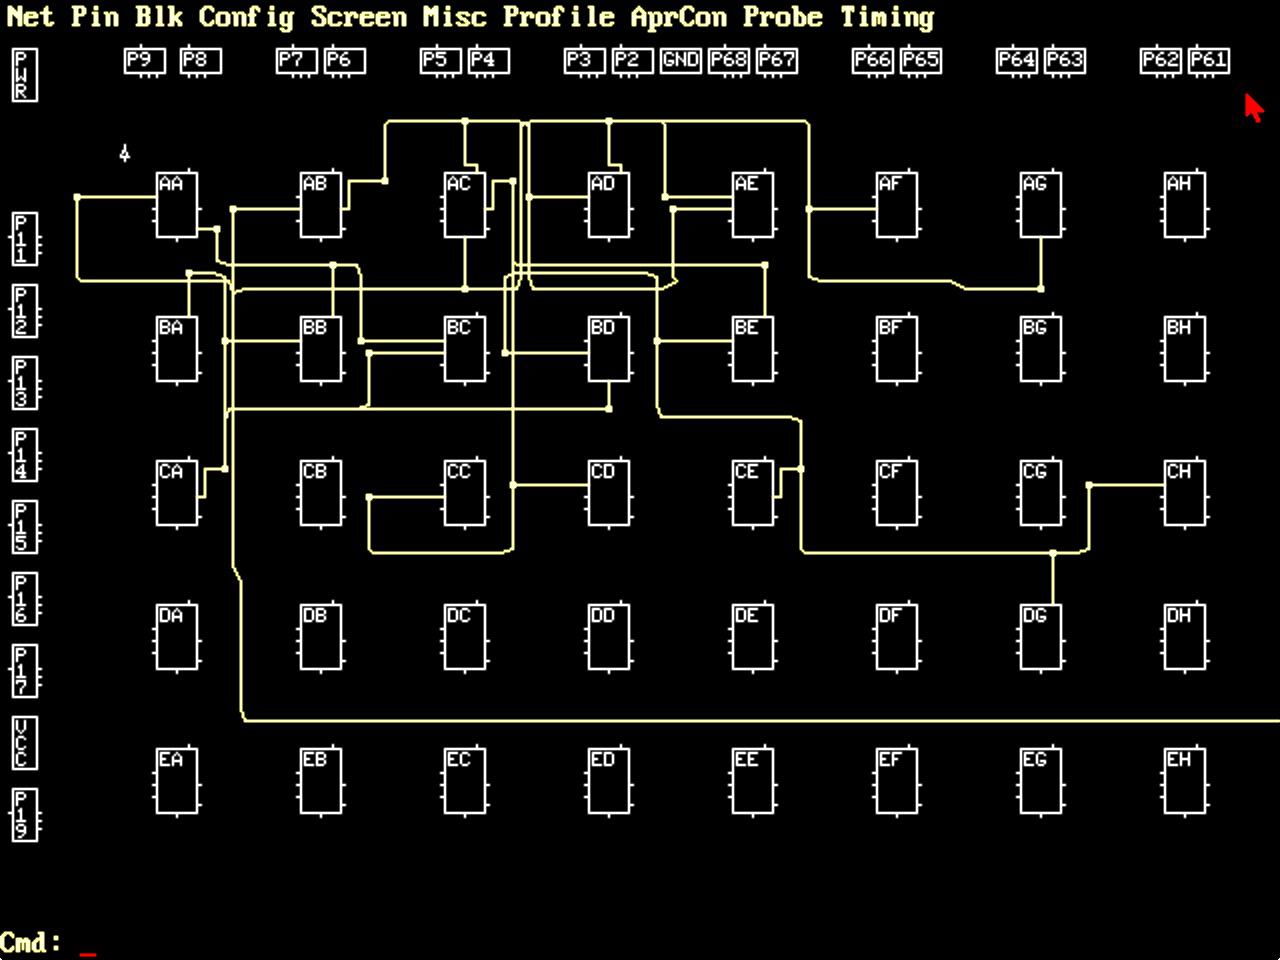
The screenshot below shows what routing looks like in the XACT program. The yellow lines indicate routing between the logic blocks. As more signals are added, the challenge is to route efficiently without the paths colliding. The XACT software package performs automatic routing, but routes can also be edited manually.
Screenshot of the XACT program. This MS-DOS program was controlled via the keyboard and mouse.
The implementation
The remainder of this post discusses the internal circuitry of the XC2064, reverse-engineered from die photos.5 Be warned that this assumes some familiarity with the XC2064.
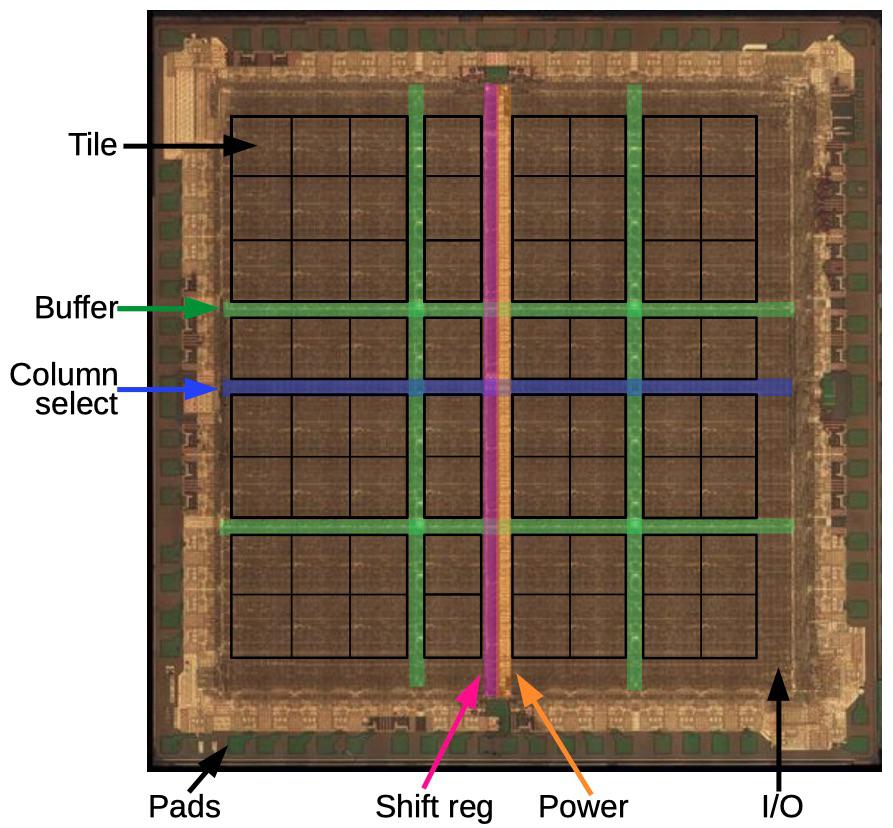
The die photo below shows the layout of the XC2064 chip. The main part of the FPGA is the 8×8 grid of tiles; each tile holds one logic block and the neighboring routing circuitry. Although FPGA diagrams show the logic blocks (CLBs) as separate entities from the routing that surrounds them, that is not how the FPGA is implemented. Instead, each logic block and the neighboring routing are implemented as a single entity, a tile. (Specifically, the tile includes the routing above and to the left of each CLB.)
Around the edges of the integrated circuit, I/O blocks provide communication with the outside world. They are connected to the small green square pads, which are wired to the chip’s external pins. The die is divided by buffers (green): two vertical and two horizontal. These buffers amplify signals that travel long distances across the circuit, reducing delay. The vertical shift register (pink) and horizontal column select circuit (blue) are used to load the bitstream into the chip, as will be explained below.
Inside a tile
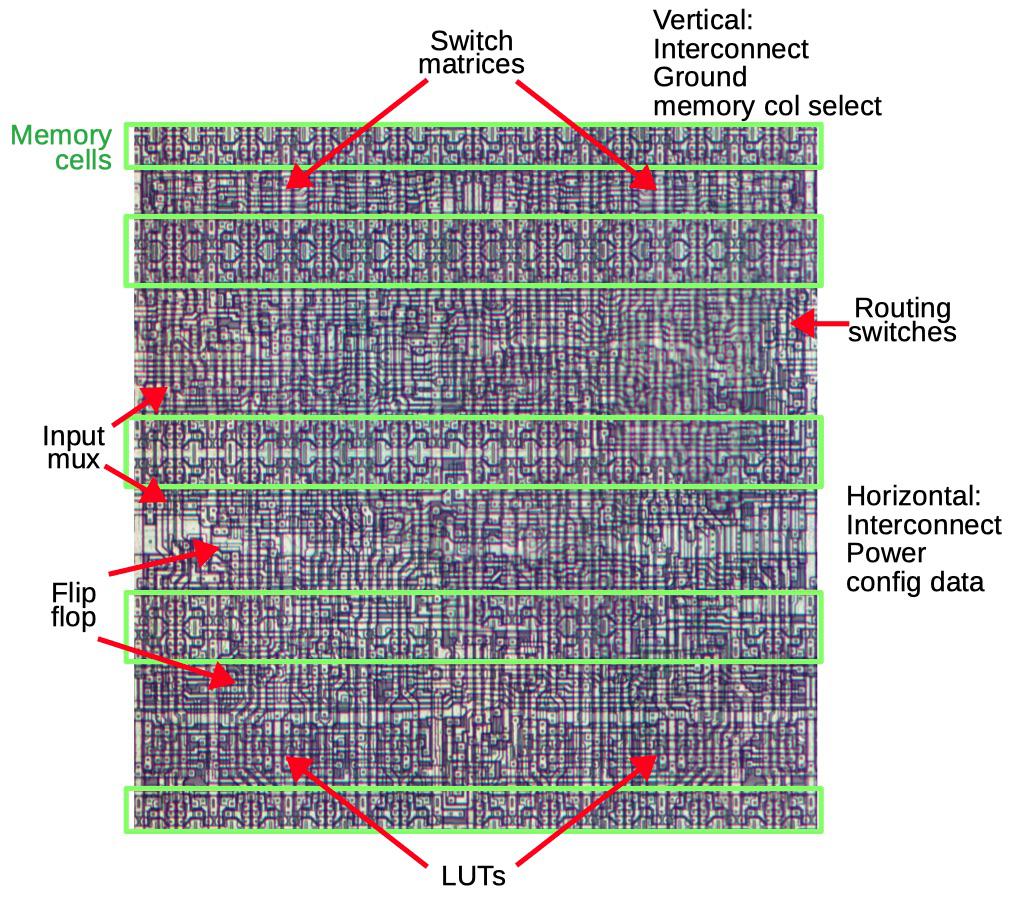
The diagram below shows the layout of a single tile in the XC2064; the chip contains 64 of these tiles packed together as shown above. About 40% of each tile is taken up by the memory cells (green) that hold the configuration bits. The top third (roughly) of the tile handles the interconnect routing through two switch matrices and numerous individual routing switches. Below that is the logic block. Key parts of the logic block are multiplexers for the input, the flip flop, and the lookup tables (LUTs). The tile is connected to neighboring tiles through vertical and horizontal wiring for interconnect, power and ground. The configuration data bits are fed into the memory cells horizontally, while vertical signals select a particular column of memory cells to load.
One tile of the FPGA, showing important functional units.
Transistors
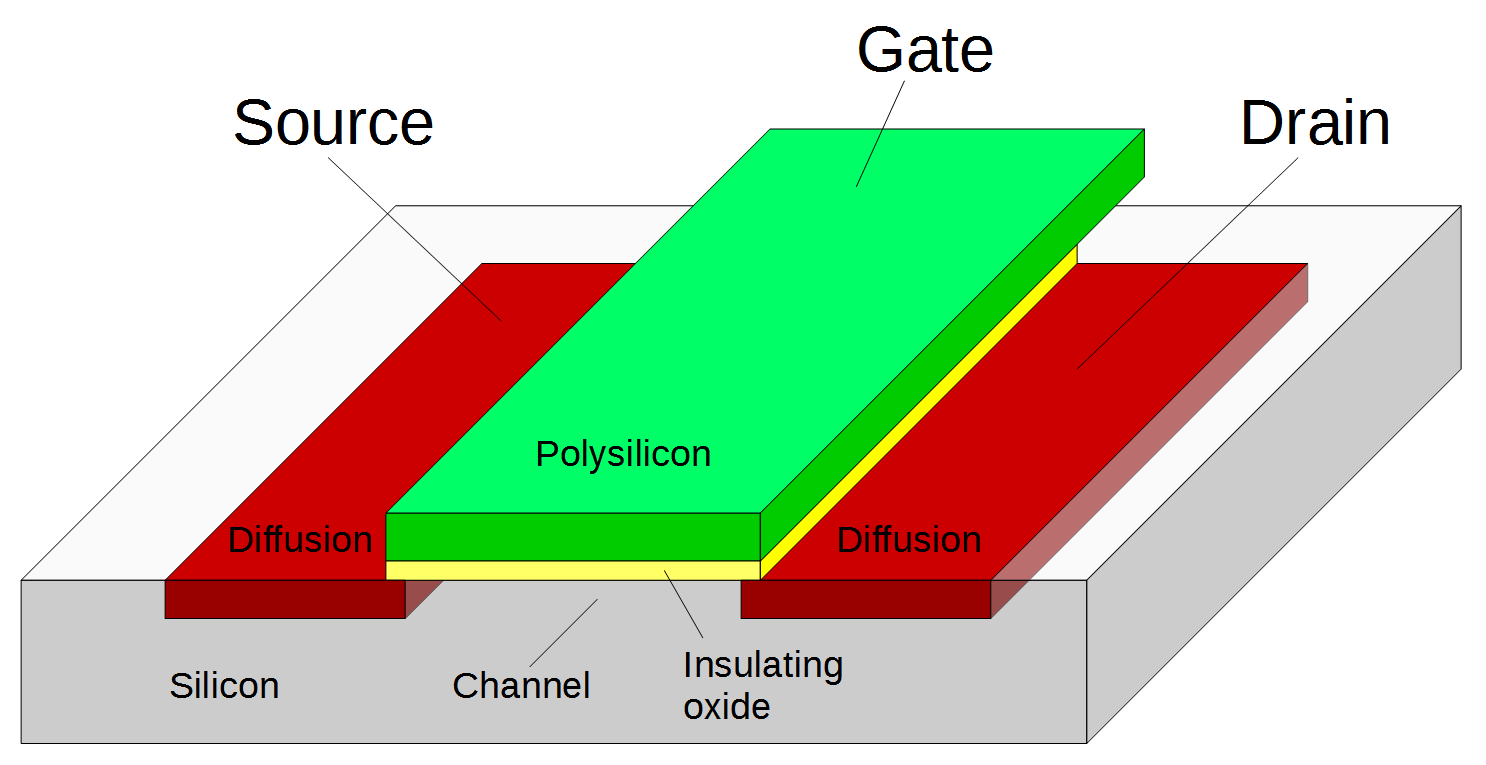
The FPGA is implemented with CMOS logic, built from NMOS and PMOS transistors. Transistors have two main roles in the FPGA. First, they can be combined to form logic gates. Second, transistors are used as switches that signals pass through, for instance to control routing. In this role, the transistor is called a pass transistor. The diagram below shows the basic structure of an MOS transistor. Two regions of silicon are doped with impurities to form the source and drain regions. In between, the gate turns the transistor on or off, controlling current flow between the source and drain. The gate is made of a special type of silicon called polysilicon, and is separated from the underlying silicon by a thin insulating oxide layer. Above this, two layers of metal provide wiring to connect the circuitry.
Structure of a MOSFET.
The die photo closeup below shows what a transistor looks like under a microscope. The polysilicon gate is the snaking line between the two doped silicon regions. The circles are vias, connections between the silicon and the metal layer (which has been removed for this photo).
A MOSFET as it appears in the FPGA.
The bitstream and configuration memory
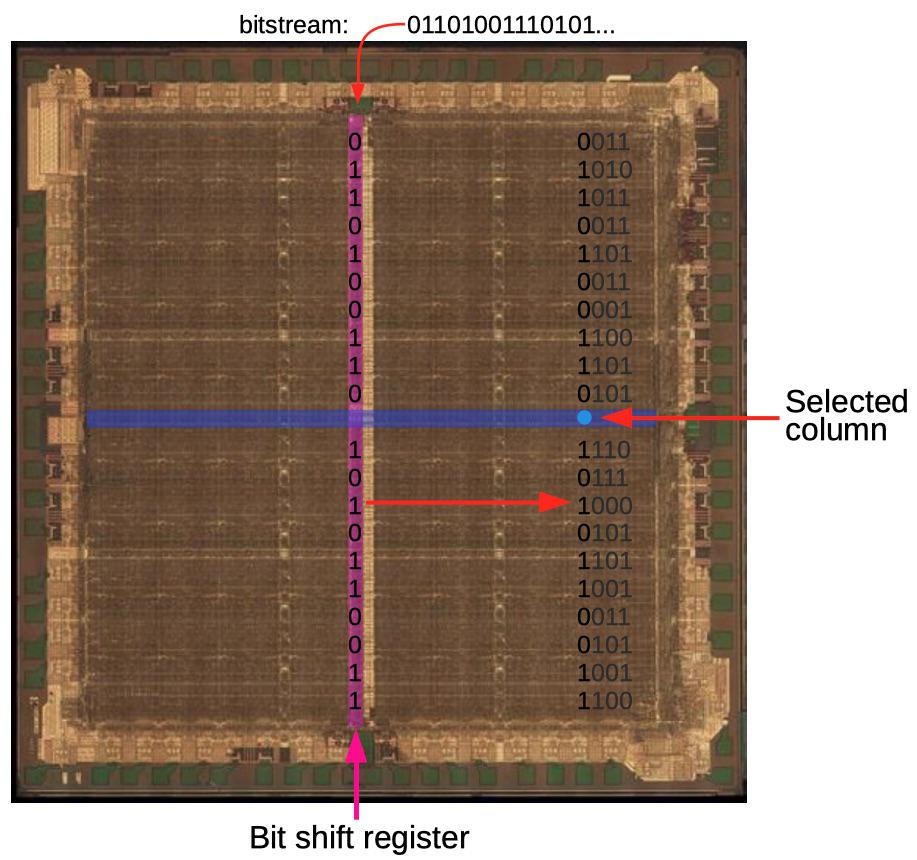
The configuration information in the XC2064 is stored in configuration memory cells. Instead of using a block of RAM for storage, the FPGA’s memory is distributed across the chip in a 160×71 grid, ensuring that each bit is next to the circuitry that it controls. The diagram below shows how the configuration bitstream is loaded into the FPGA. The bitstream is fed into the shift register that runs down the center of the chip (pink). Once 71 bits have been loaded into the shift register, the column select circuit (blue) selects a particular column of memory and the bits are loaded into this column in parallel. Then, the next 71 bits are loaded into the shift register and the next column to the left becomes the selected column. This process repeats for all 160 columns of the FPGA, loading the entire bitstream into the chip. Using a shift register avoids bulky memory addressing circuitry.
How the bitstream is loaded into the FPGA. The bits shown are conceptual; actual bit storage is much denser. The three columns on the left have been loaded and the fourth column is currently being loaded. Die photo from
siliconpr0n.
The important point is that the bitstream is distributed across the chip exactly as it appears in the file: the layout of bits in the bitstream file matches the physical layout on the chip. As will be shown below, each bit is stored in the FPGA next to the circuit it controls. Thus, the bitstream file format is directly determined by the layout of the hardware circuits. For instance, when there is a gap between FPGA tiles because of the buffer circuitry, the same gap appears in the bitstream. The content of the bitstream is not designed around software concepts such as fields or data tables or configuration blocks. Understanding the bitstream depends on thinking of it in hardware terms, not in software terms.7
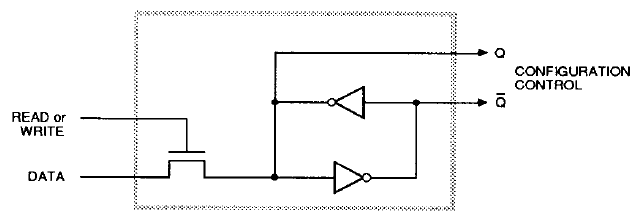
Each bit of configuration memory is implemented as shown below.8 Each memory cell consists of two inverters connected in a loop. This circuit has two stable states so it can store a bit: either the top inverter is 1 and the bottom is 0 or vice versa. To write to the cell, the pass transistor on the left is activated, passing the data signal through. The signal on the data line simply overpowers the inverters, writing the desired bit. (You can also read the configuration data out of the FPGA using the same path.) The Q and inverted Q outputs control the desired function in the FPGA, such as closing a routing connection, providing a bit for a lookup table, or controlling the flip flops. (In most cases, just the Q output is used.)
Schematic diagram of one bit of configuration memory, from the datasheet. Q is the output and Q is the inverted output.
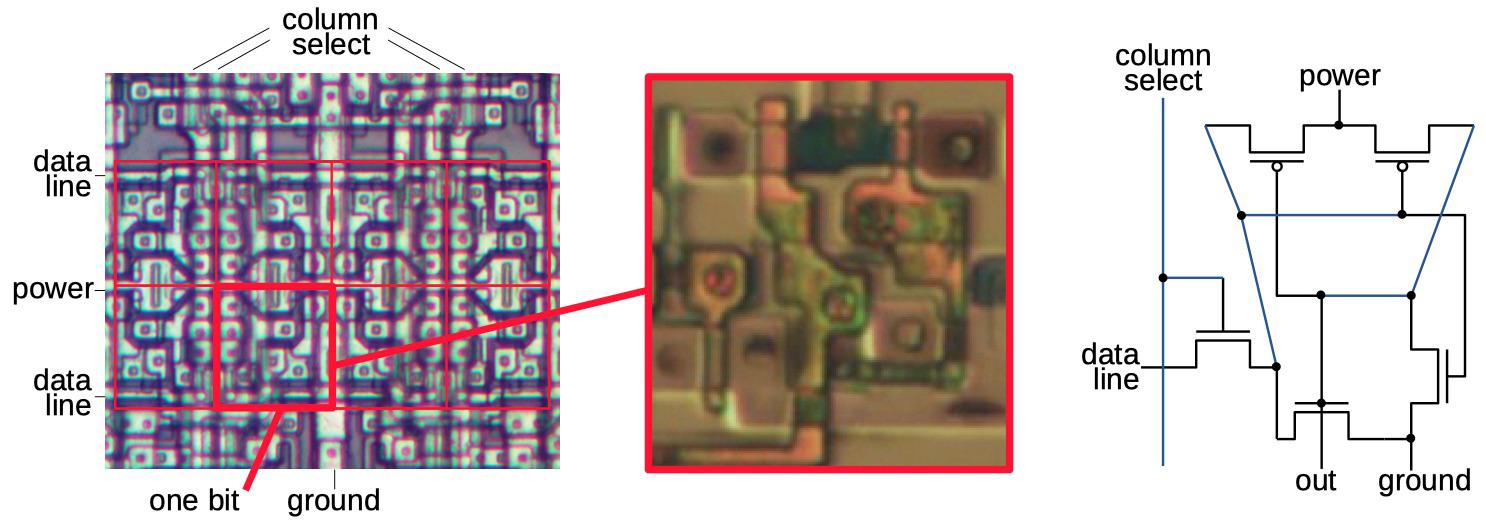
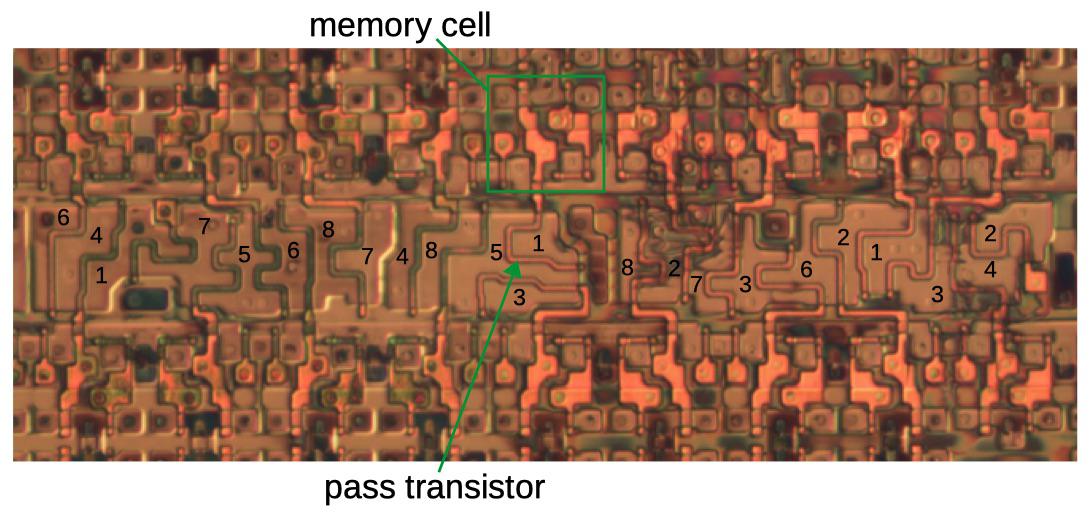
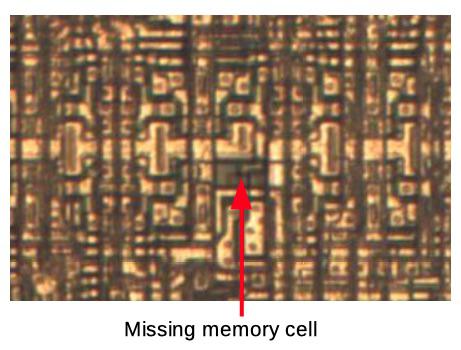
The diagram below shows the physical layout of memory cells. The photo on the left shows eight memory cells, with one cell highlighted. Each horizontal data line feeds all the memory cells in that row. Each column select line selects all the memory cells in that column for writing. The middle photo zooms in on the silicon and polysilicon transistors for one memory cell. The metal layers were removed to expose the underlying transistors. The metal layers wire together the transistors; the circles are connections (vias) between the silicon or polysilicon and the metal. The schematic shows how the five transistors are connected; the schematic’s physical layout matches the photo. Two pairs of transistors form two CMOS inverters, while the pass transistor in the lower left provides access to the cell.
Eight bits of configuration memory, four above and four below. The red box shows one bit. When a column select line is activated, the row data line is loaded into the corresponding cells. The closeup and schematic show one bit of configuration memory. Die photo from
siliconpr0n.
Lookup table multiplexers
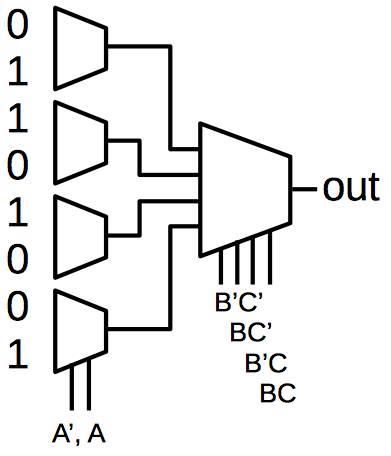
As explained earlier, the FPGA implements arbitrary logic functions by using a lookup table. The diagram below shows how a lookup table is implemented in the XC2064. The eight values on the left are stored in eight memory cells. Four multiplexers select one of each pair of values, depending on the value of the A input; if A is 0, the top value is selected and if A is 1 the bottom value is selected. Next, a larger multiplexer selects one of the four values based on B and C. The result is the desired value, in this case A XOR B XOR C. By putting different values in the lookup table, the logic function can be changed as desired.
Implementing XOR with a lookup table.
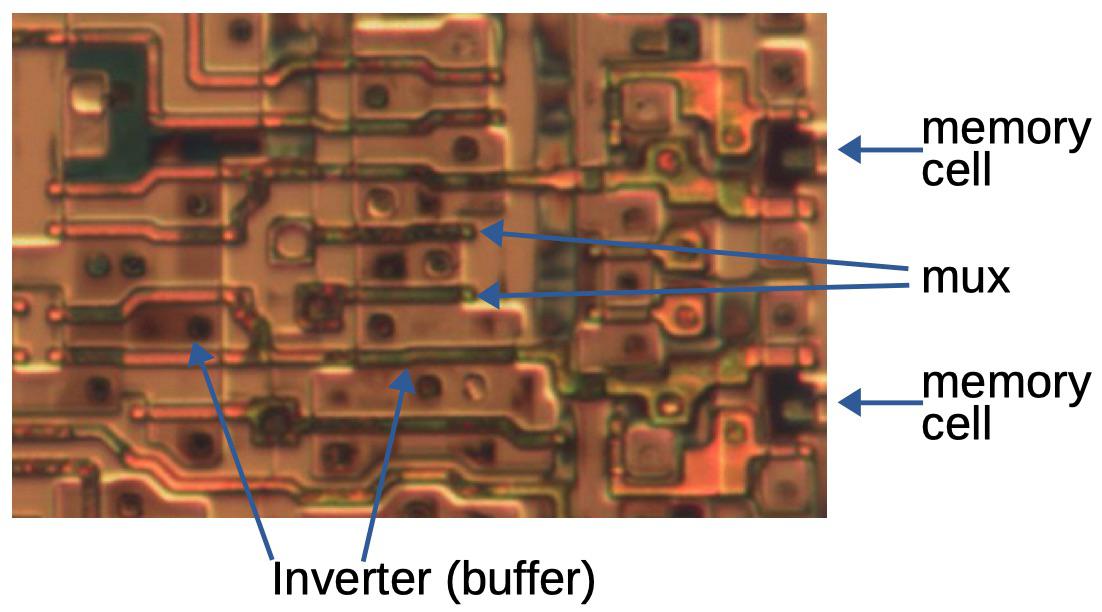
Each multiplexer is implemented with pass transistors. Depending on the control signals, one of the pass transistors is activated, passing that input to the output. The diagram below shows part of the LUT circuitry, multiplexing two of the bits. At the right are two of the memory cells. Each bit goes through an inverter to amplify it, and then passes through the multiplexer’s pass transistors in the middle, selecting one of the bits.
A closeup of circuitry in the LUT implementation. Die photo from
siliconpr0n.
Flip flop
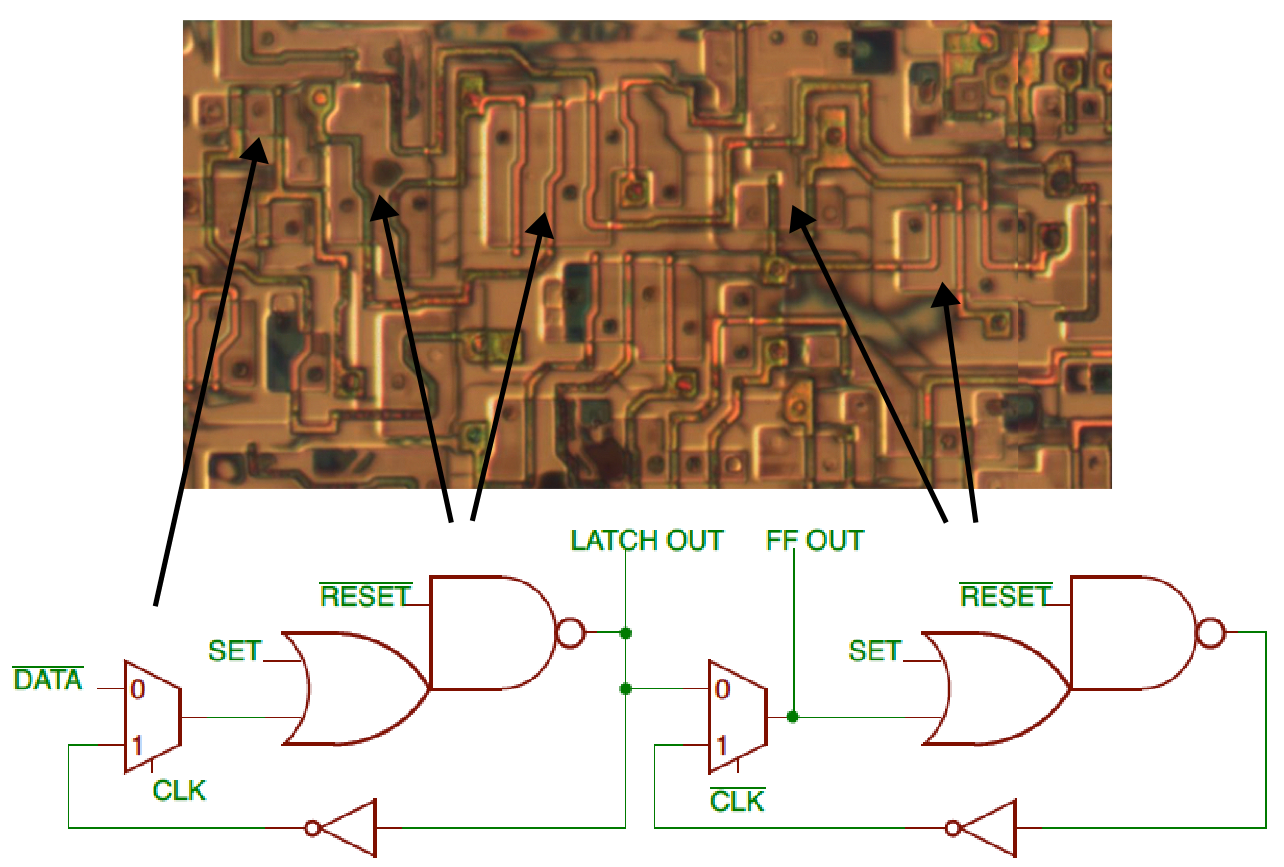
Each CLB contains a flip flop, allowing the FPGA to implement latches, state machines, and other stateful circuits. The diagram below shows the (slightly unusual) implementation of the flip flop. It uses a primary/secondary design. When the clock is low, the first multiplexer lets the data into the primary latch. When the clock goes high, the multiplexer closes the loop for the first latch, holding the value. (The bit is inverted twice going through the OR gate, NAND gate, and inverter, so it is held constant.) Meanwhile, the secondary latch’s multiplexer receives the bit from the first latch when the clock goes high (note that the clock is inverted). This value becomes the flip flop’s output. When the clock goes low, the secondary’s multiplexer closes the loop, latching the bit. Thus, the flip flop is edge-sensitive, latching the value on the rising edge of the clock. The set and reset lines force the flip flop high or low.
Flip flop implementation. The arrows point out the first multiplexer and the two OR-NAND gates. Die photo from
siliconpr0n.
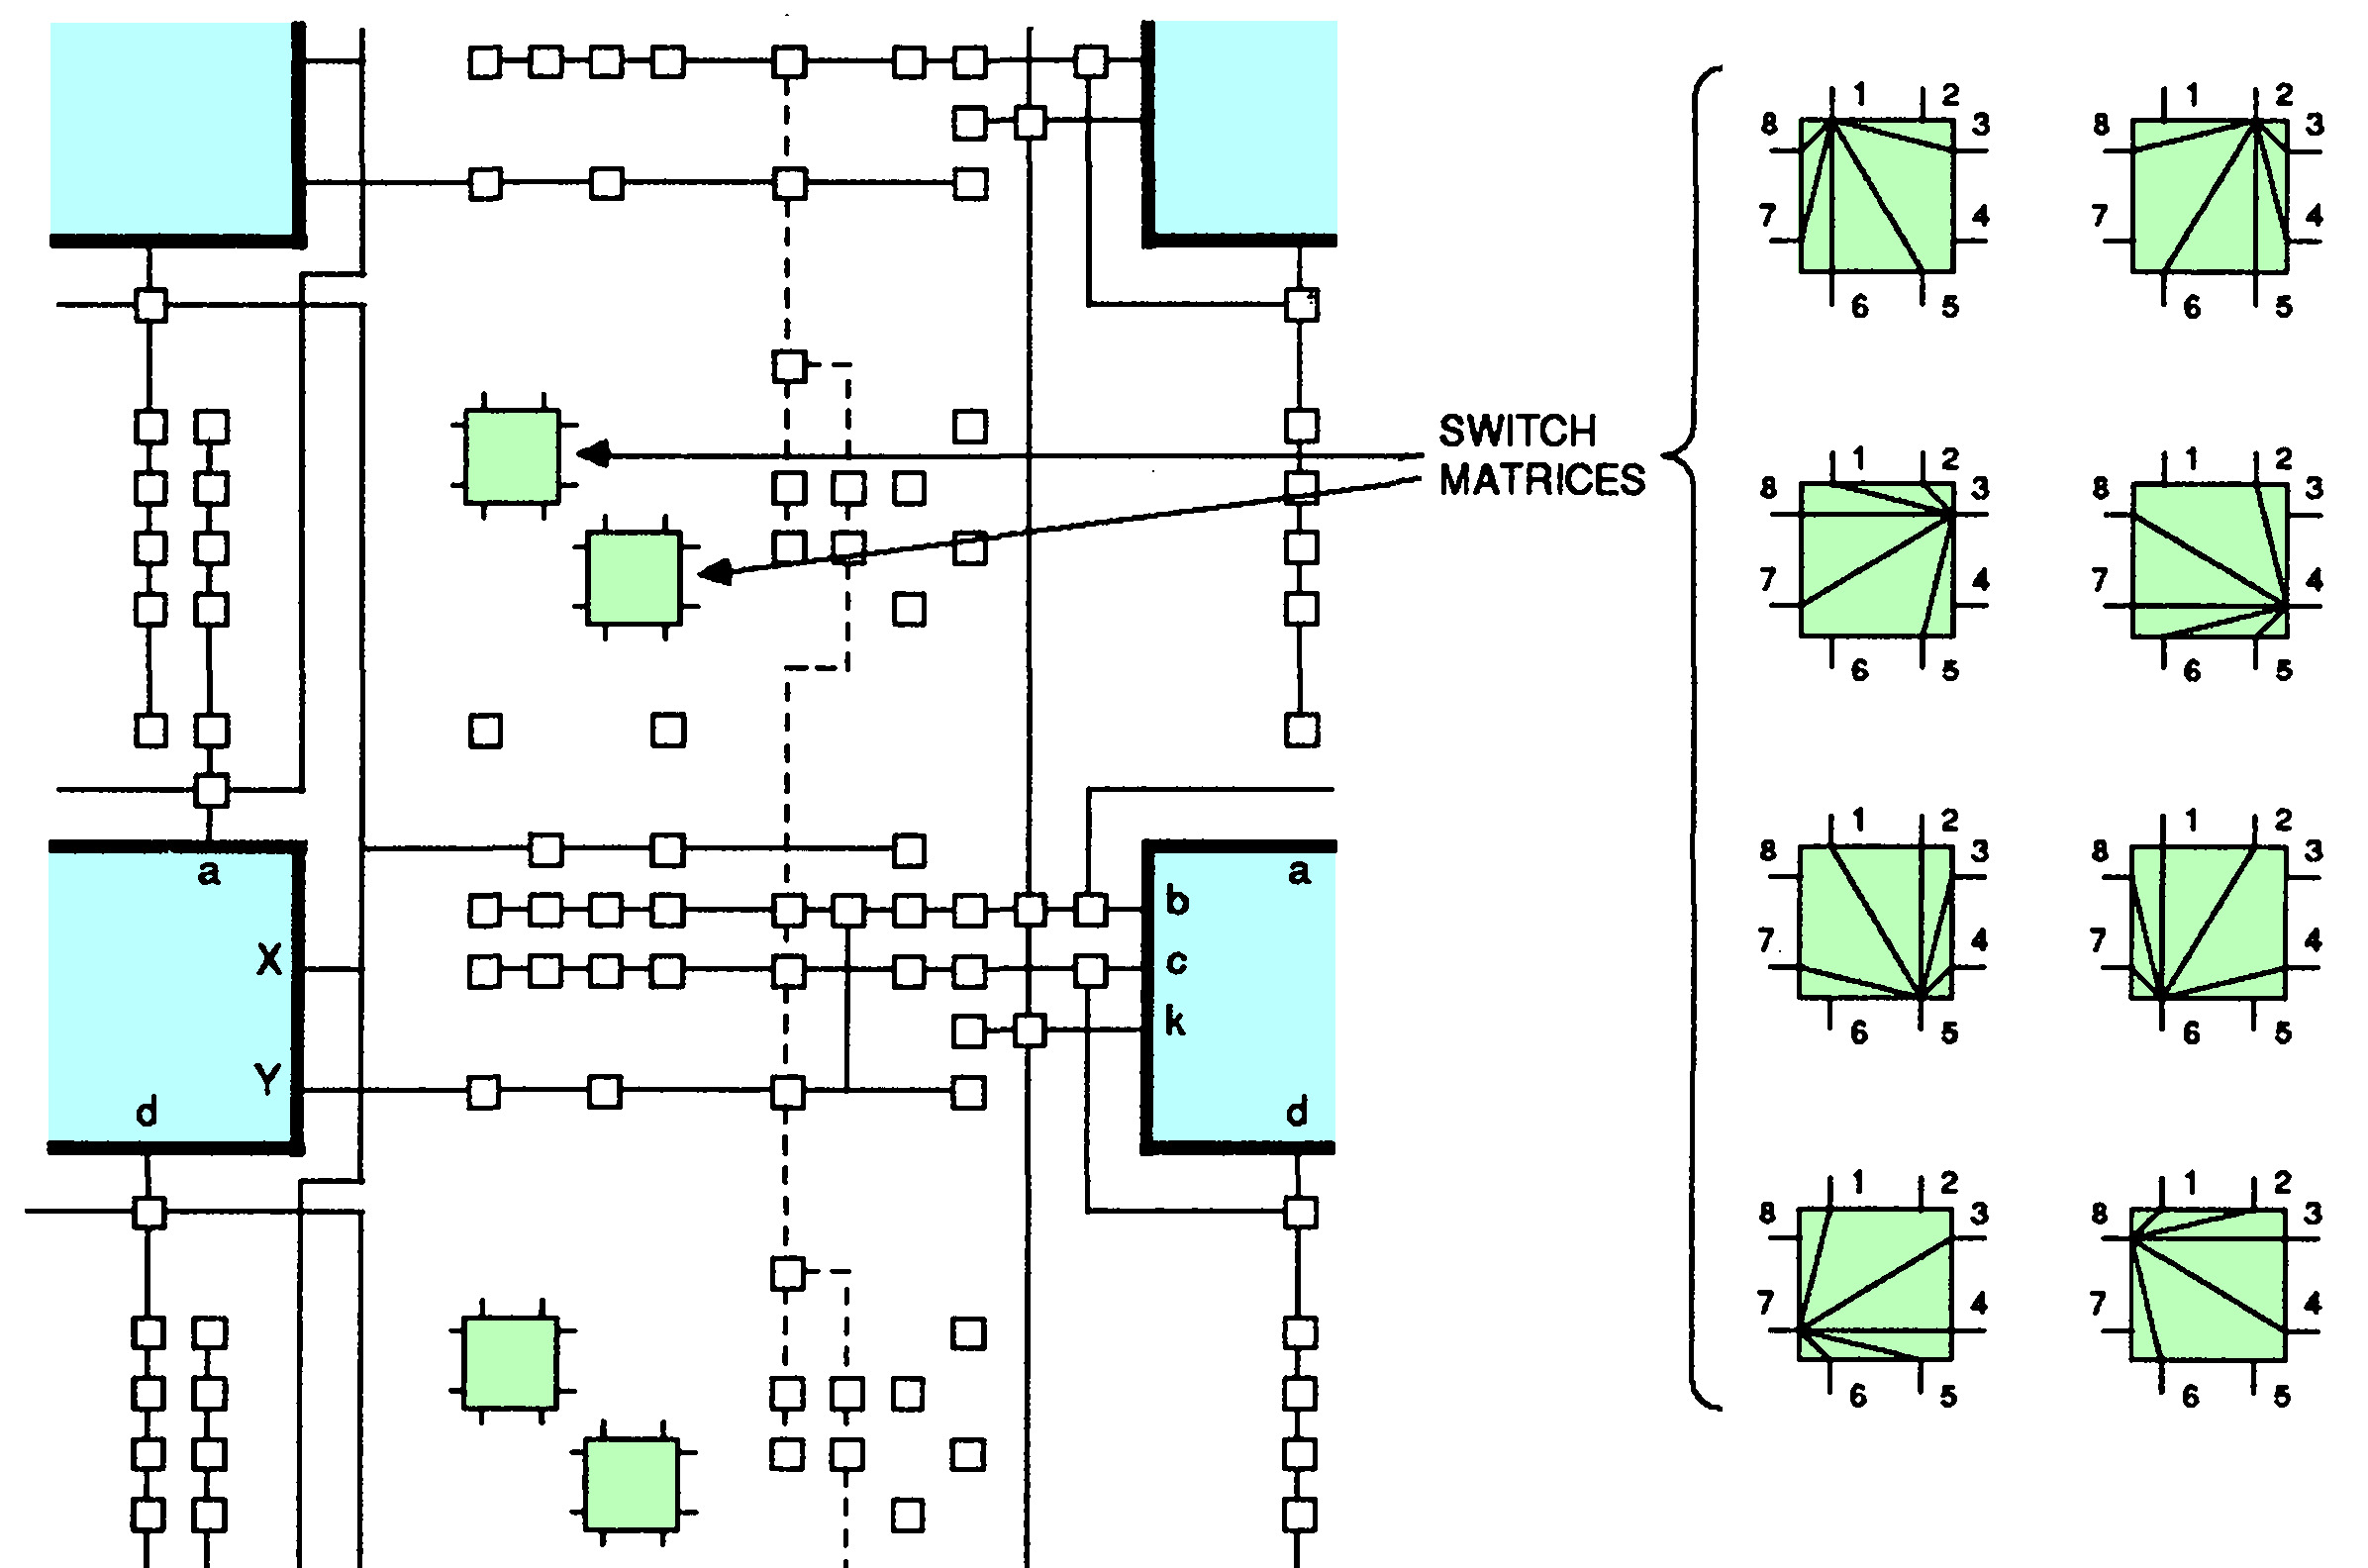
8-pin switch matrix
The switch matrix is an important routing element. Each switch has eight “pins” (two on each side) and can connect almost any combination of pins together. This allows signals to turn, split, or cross over with more flexibility than the individual routing nodes. The diagram below shows part of the routing network between four CLBs (cyan). The switch matrices (green) can be connected with any combination of the connections on the right. Note that each pin can connect to 5 of the 7 other pins. For instance, pin 1 can connect to pin 3 but not pin 2 or 4. This makes the matrix almost a crossbar, with 20 potential connections rather than 28.
The switch matrix is implemented by a row of pass transistors controlled by memory cells above and below. The two sides of the transistor are the two switch matrix pins that can be connected by that transistor. Thus, each switch matrix has 20 associated control bits;9 two matrices per tile yields matrix 40 control bits per tile. The photo below indicates one of the memory cells, connected to the long squiggly gate of the pass transistor below. This transistor controls the connection between pin 5 and pin 1. Thus, the bit in the bitstream corresponding to that memory cell controls the switch connection between pin 5 and pin 1. Likewise, the other memory cells and their associated transistors control other switch connections. Note that the ordering of these connections follows no particular pattern; consequently, the mapping between bitstream bits and the switch pins appears random.
Implementation of an 8-pin switch matrix. The silicon regions are labeled with the corresponding pin numbers. The metal layers (which connect the pins to the transistors) were removed for this photo. Based on die photo from
siliconpr0n.
Input routing
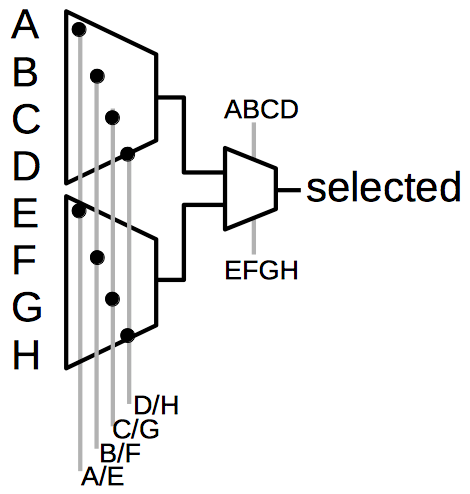
The inputs to a CLB use a different encoding scheme in the bitstream, which is explained by the hardware implementation. In the diagram below, the eight circled nodes are potential inputs to CLB box DD. Only one node (at most) can be configured as an input, since connecting two signals to the same input would short them together.
Input selection. The eight nodes circled in green are potential inputs to DD; one of them can be selected.
The desired input is selected using a multiplexer. A straightforward solution would use an 8-way multiplexer, with 3 control bits selecting one of the 8 signals. Another straightforward solution would be to use 8 pass transistors, each with its own control signal, with one of them selecting the desired signal. However, the FPGA uses a hybrid approach that avoids the decoding hardware of the first approach but uses 5 control signals instead of the eight required by the second approach.
The FPGA uses multiplexers to select one of eight inputs.
The schematic above shows the two-stage multiplexer approach used in the FPGA. In the first stage, one of the control signals is activated. The second stage picks either the top or bottom signal for the output.10 For instance, suppose control signal B/F is sent to the first stage and ‘ABCD’ to the second stage; input B is the only one that will pass through to the output. Thus, selecting one of the eight inputs requires 5 bits in the bitstream and uses 5 memory cells.
Conclusion
The XC2064 uses a variety of highly-optimized circuits to implement its logic blocks and routing. This circuitry required a tight layout in order to fit onto the die. Even so, the XC2064 was a very large chip, larger than microprocessors of the time, so it was difficult to manufacture at first and cost hundreds of dollars. Compared to modern FPGAs, the XC2064 had an absurdly small number of cells, but even so it sparked a revolutionary new product line.
Two concepts are the key to understanding the XC2064’s bitstream. First, the FPGA is implemented from 64 tiles, repeated blocks that combine the logic block and routing. Although FPGAs are described as having logic blocks surrounded by routing, that is not how they are implemented. The second concept is that there are no abstractions in the bitstream; it is mapped directly onto the two-dimensional layout of the FPGA. Thus, the bitstream only makes sense if you consider the physical layout of the FPGA.
I’ve determined how most of the XC2064 bitstream is configured (see footnote 11) and I’ve made a program to generate the CLB information from a bitstream file. Unfortunately, this is one of those projects where the last 20% takes most of the time, so there’s still work to be done. One problem is handling I/O pins, which are full of irregularities and their own routing configuration. Another problem is the tiles around the edges have slightly different configurations. Combining the individual routing points into an overall netlist also requires some tedious graph calculations.
I announce my latest blog posts on Twitter, so follow me at kenshirriff for updates. I also have an RSS feed. Thanks to John McMaster, Tim Ansell and Philip Freidin for discussions.12
Notes and references


