

Recently, the combined market share of the top ten and top twenty semiconductor companies has been increasing, contrary to the trend of the last fifty years. Given the acceleration in mergers and acquisitions that began in 2015, one might assume that, as the semiconductor industry approaches maturity, companies are consolidating to increase their competitive advantage through economies of scale. After all, that’s what many industries, including disk drives and DRAM’s have done in the past. Closer examination of this trend, however, indicates that semiconductor companies are moving toward specialization rather than just bulking up to increase their revenue. Let’s look at the top five largest semiconductor companies, where the consolidation is most evident. The combined market share of these companies has been increasing in recent years as they grow at a 9% compound average growth rate (CAGR) versus a market that grew at 2% CAGR through 2017 (Figure 1). Did they grow by acquisition of other companies? In general, “no”.
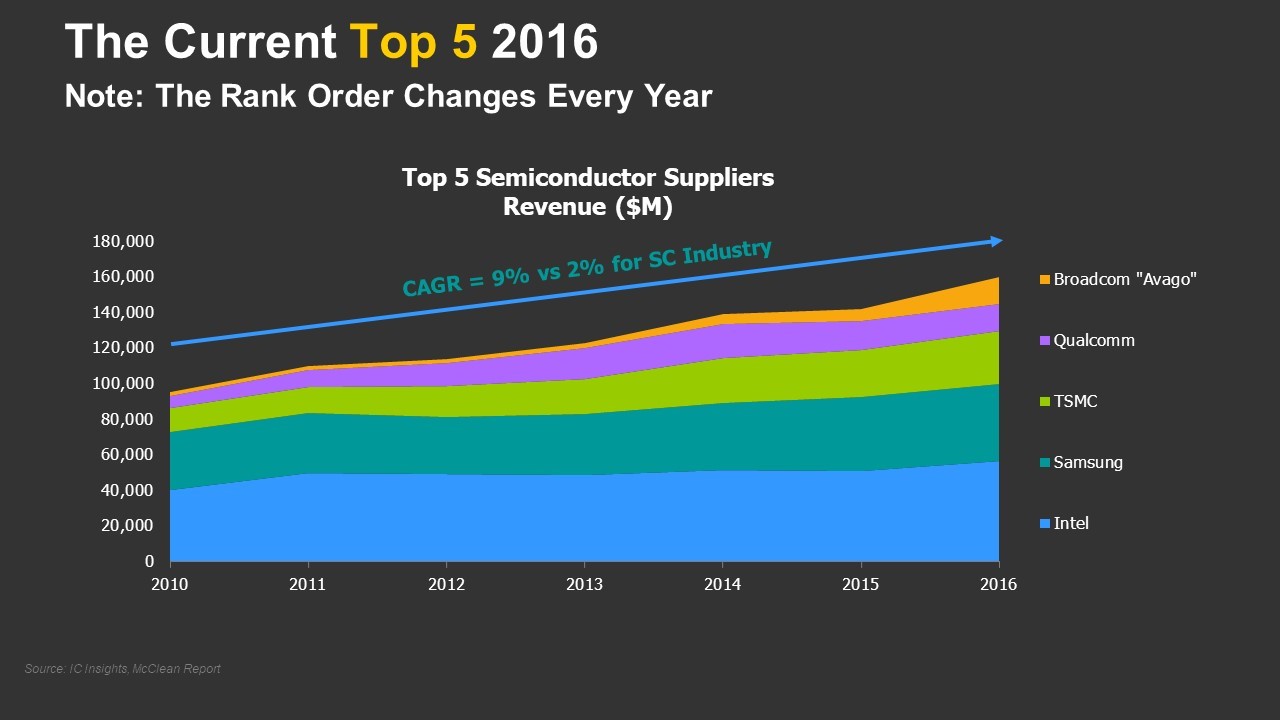
Figure 1. Increasing combined market share of the five largest semiconductor companies
Despite acquisitions like Altera, Intel’s market share over the period from 2010 to 2016 was flat at about 15.5%. Samsung gained market share during the period, moving from 10.2 to 12.1% but this gain was not caused by acquisitions. TSMC, the third largest semiconductor company by revenue, grew its market share substantially during the period, rising from 4.5 to 8.1% with no acquisitions. And Qualcomm’s gain in market share from 3.1 to 4.2% was almost totally driven by the growth of its primary market, wireless telecommunications, rather than any acquisitions. Only Broadcom grew by acquisitions during the period, moving from 0.7 to 4.2% market share.
There were indeed companies that grew economies of scale through acquisitions during the period 2010 through 2016 but they are not a significant share of semiconductor industry revenue. They include the TriQuint/RFMD merger to form QORVO, International Rectifier/Infineon, On Semiconductor/Fairchild, and Linear Technology/Analog Devices, to name some examples. Overall data for the industry suggest that there is no correlation between operating profit and revenue, with a correlation coefficient of only 0.0706 (Figure 2).
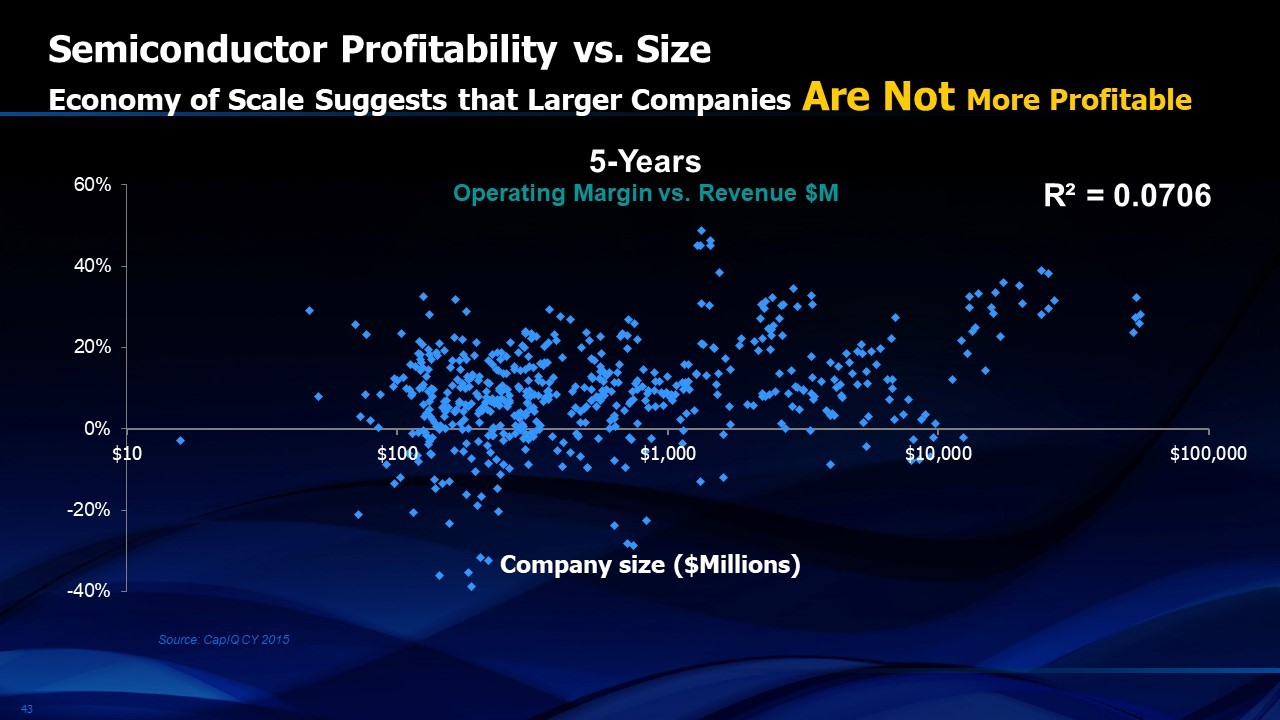
Figure 2. Lack of correlation between semiconductor revenue and operating profit of the largest semiconductor companies 2010 through 2016
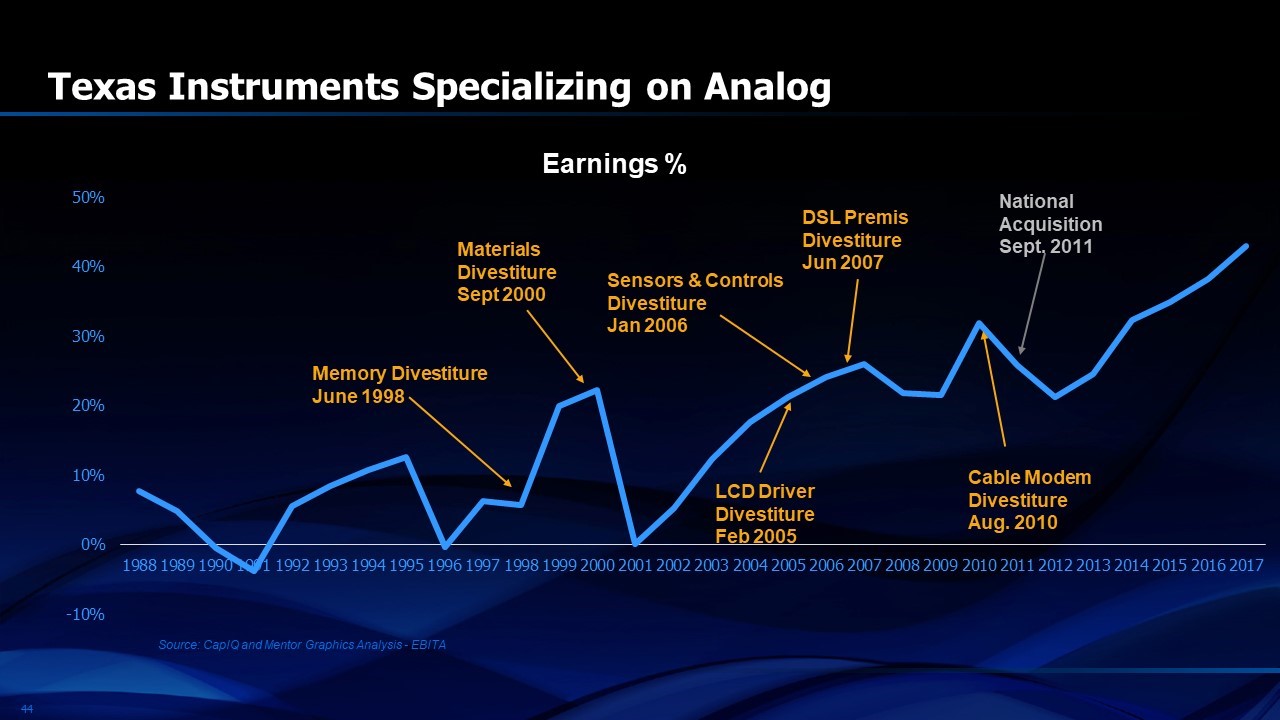
Figure 3. Texas Instruments operating profit percent
Why then is there an accelerated level of semiconductor mergers and acquisitions in 2015 and 2016? It turns out that companies that used acquisitions and divestitures to specialize their businesses usually improved operating profit percent more than those who did not. Texas Instruments is a good example (Figure 3). When I worked at TI in the 1970’s and 80’s, the company made almost every conceivable type of semiconductor component. One could say that TI made everything in the semiconductor business except money. Through a series of acquisitions, divestitures and business terminations since the year 2000, TI has focused its business on analog and power components. As a result, TI has progressed from profitability that averaged less than 10% operating profit to a 40% operating profit in 2017, the highest of the major companies in the semiconductor industry.
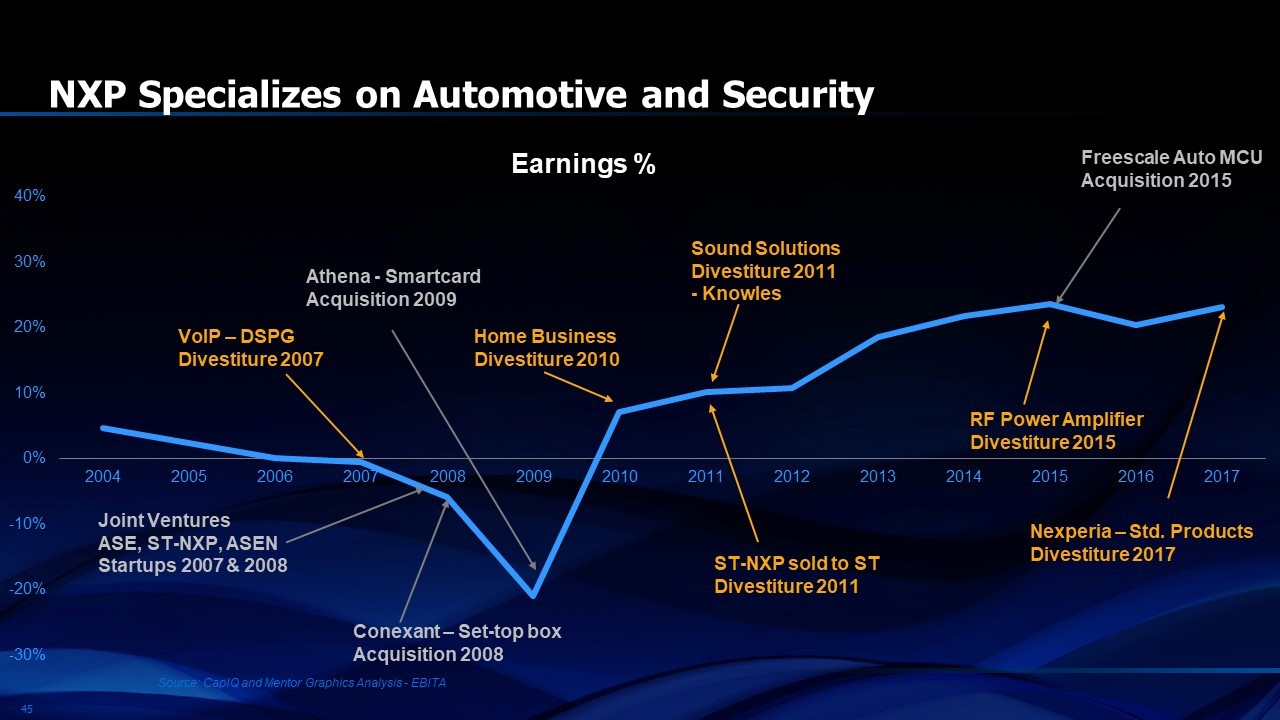
Figure 4. NXP Operating margin after adjustment for extraordinary items
NXP is another good example (Figure 4). In 2014, nearly 30% of its revenue came from “standard products”. Over the next five years, this percentage became negligible and more than 90% of NXP’s revenue then came from two major areas, automotive and security.
AVAGO is a similar story although the specialization was achieved by an aggressive series of acquisitions (Figure 5). Along with the acquisitions came divestitures resulting in very strong market share in wireless communications and networking, a specialization that was particularly good as “East-West” traffic grew in data centers. In addition, the need for improved wireless communications filters in cell phones accelerated the growth of bulk acoustic wave devices.
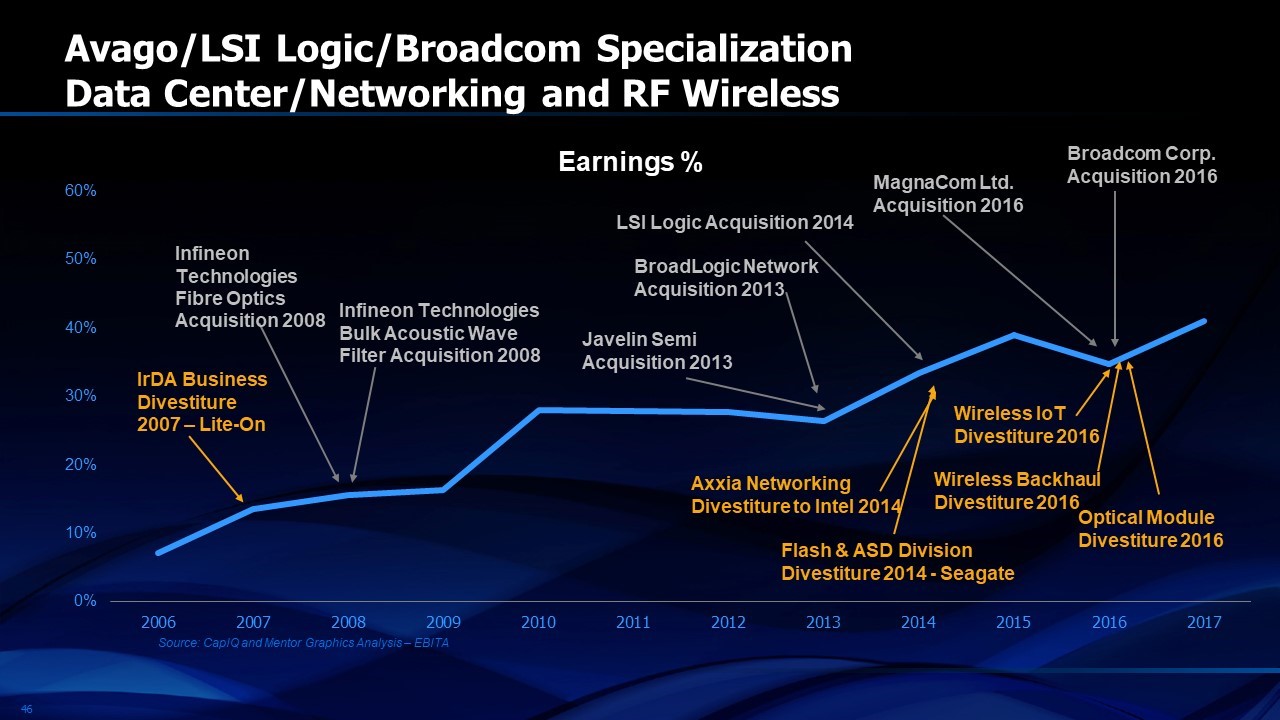
Figure 5. AVAGO specialization through acquisitions
What about companies that did acquisitions in order to grow and diversify their product mix? Intel is a good example of a company that had an extremely high concentration of revenue in the microprocessor business aimed at PC’s and servers (Figure 6). A series of acquisitions in new areas like McAfee for security, Wind River for embedded software, Altera for FPGA’s, as well as an organic diversification thrust with the foundry business, added to revenue but not to profit.
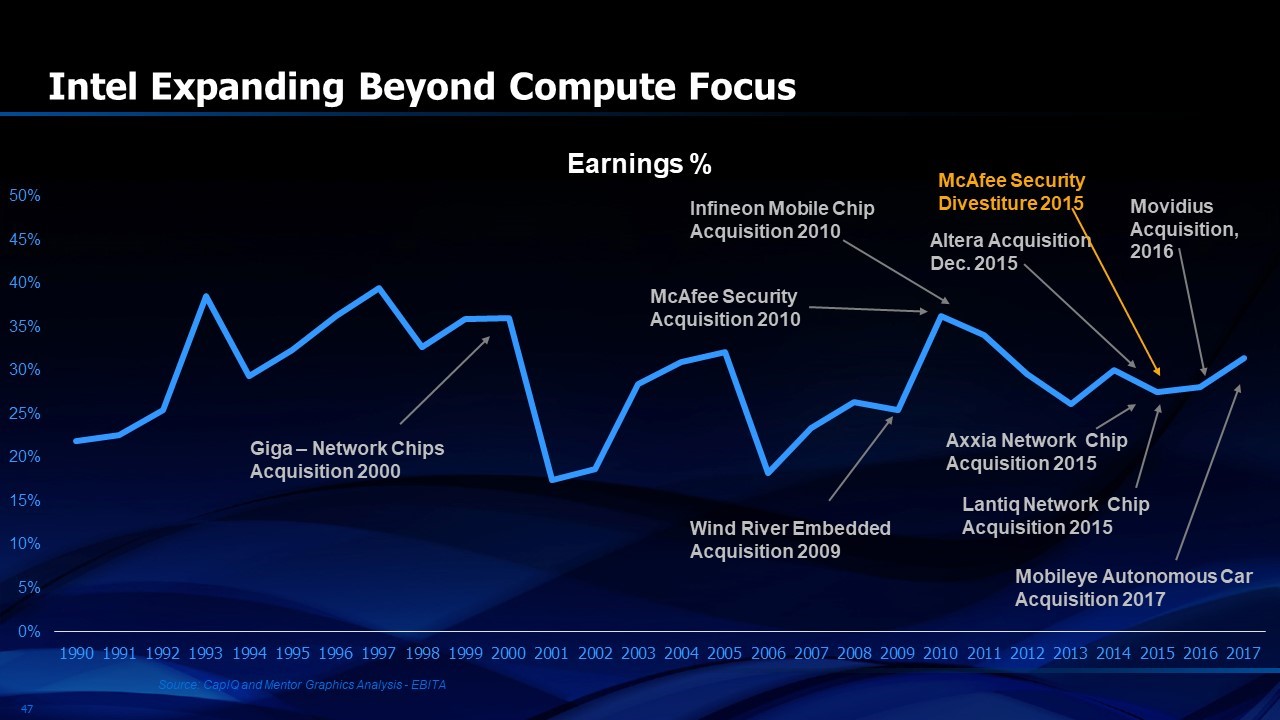
Figure 6. Intel diversification versus profitability
Finally, one might wonder whether this high correlation of specialization with profitability came as a result of reductions in research and development, especially when one examines cases like AVAGO where substantial cost reductions followed each acquisition. If this did happen, it’s not evident for the overall semiconductor industry. The total R&D investment of the semiconductor industry has grown almost every year in history (Figure 7).
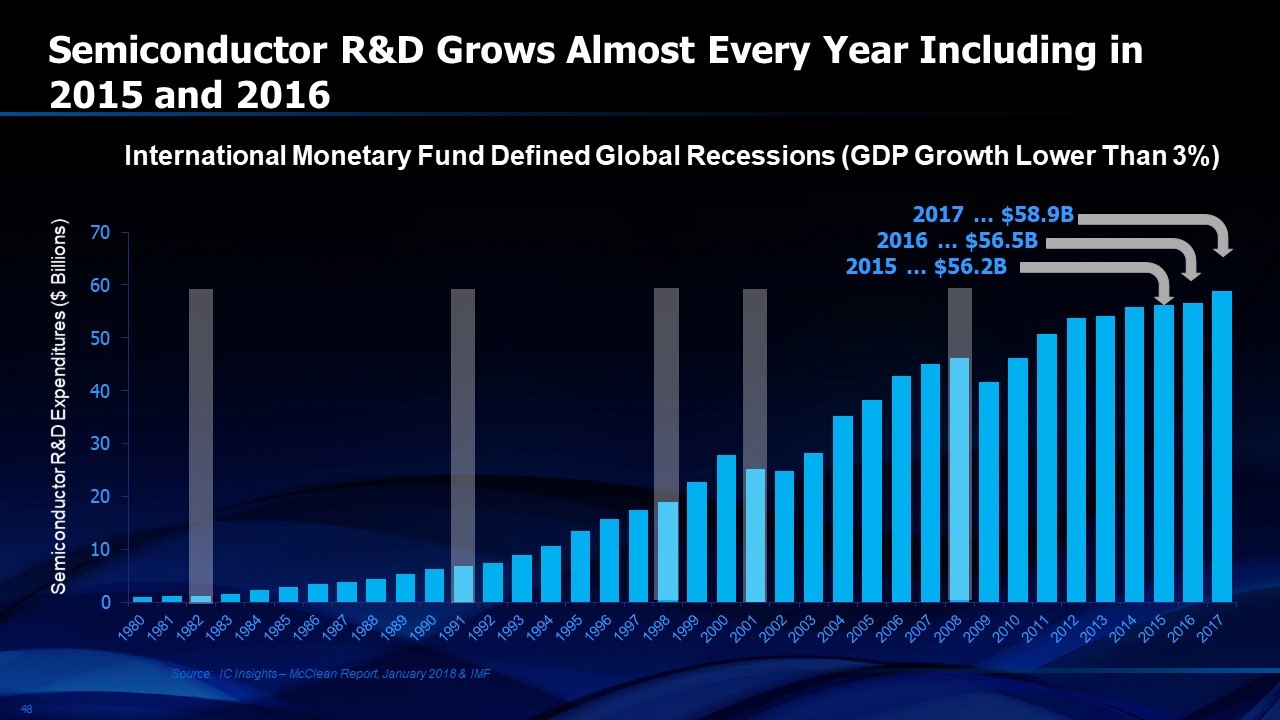
Figure 7. Semiconductor research and development expenditures with recessions shown in gray
Research and development spending of the semiconductor industry has been relatively constant at 13.8% per year (Figure 8 in Chapter 2). It appears that the managers and investors in semiconductor companies don’t believe that their industry is consolidating into a slow growth, mature business. Why would they invest nearly 14% of their revenue each year if they believed that the recent compound average growth rate below 3% was likely to continue? The semiconductor industry has reinvented itself periodically through history as new applications have evolved. These new applications have created opportunities for new companies to emerge and for the total industry revenue to grow. That’s likely to be the case for the foreseeable future.
Share this post via:


Enhancing Multi-Domain System Simulation with FMI Co-Simulation