
Every few months, I touch base with Cristian Amitroaie, CEO of AMIQ EDA, to learn more about how AMIQ is helping hardware design and verification engineers be more productive. Quite often, his answers surprise me. When he started describing their Design and Verification Tools (DVT) Eclipse Integrated Development Environment (IDE), my first reaction was that engineers had plenty of GUIs at their fingertips already. When he talked about Verissimo SystemVerilog Testbench Linter, I said that lint surely must be a solved problem by now. Then I wondered how the Specador Documentation Generator differs from all the shareware solutions available. In my most recent talk with him, the topic was AMIQ EDA’s DVT Debugger, their fourth major product. Given that simulators have built-in debuggers I was curious once again how their tools are differentiated and how they actually make money.
As in our previous discussions, Cristian was clear in describing the limitations of other solutions, including features built into other tools. In the case of interactive debugging of test cases, the major simulators do have some nice capabilities. However, the GUIs are different and proprietary, so moving from an IDE to a simulator for debug is jarring. If the project uses multiple simulators, a not uncommon practice, the engineers are cycling through multiple screens constantly. The DVT Debugger is an add-on to the DVT Eclipse IDE, so users can debug in the same environment that they use to write, analyze, and visualize their design and verification code in SystemVerilog, VHDL, or the e language. The tool supports all major simulators, so even with multiple vendors involved the debug interface is unchanged.
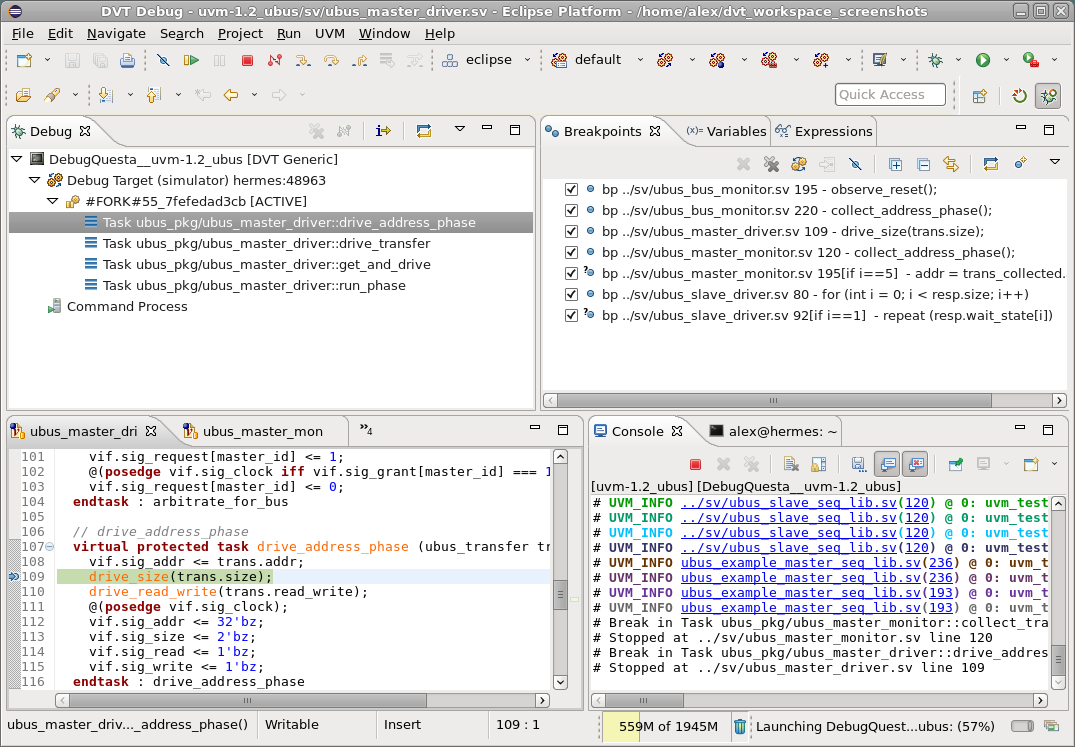
The DVT Debugger provides all the interactive functionality that software programmers enjoy, applied to design and verification code. The debugger can launch a new simulation run or connect to an existing run on the same machine or on the network. Users can insert breakpoints into their code, including conditional breakpoints, and enable or disable them. A breakpoint stops a running simulation to allow examining the values of variables to see what is happening in the design and testbench. It is possible to change variable values before resuming the run or starting a new one. Under user control, the debugger can step line by line through the code, step over (skip) a line of code, or step into or out of a function. The complete call stack is displayed, and users can move up or down. Users can define and watch complex expressions for more insight into the running code. Further, dedicated views display the simulation output and allow typing commands directly to the simulator.
While using all these debugging features, users remain within the IDE. They can take advantage of all the navigation and visualization features for which the DVT Eclipse IDE is known. These include tracing signals, finding usages, generating schematic views, and cross-probing across the wide range of available views. The Debug View and the code editor are always synchronized. For example, when the user moves up and down the call stack, the active line corresponding to the selected stack frame is automatically highlighted. Similarly, the Variables View displays the variables associated with the stack frame selected in the Debug View. These include the arguments of the current function, locally declared variables, class members, and module signals. Users can change variable values at runtime from this view.
A powerful debugger is required for modern hardware designs. Cristian reminded me of the old-fashioned way of debug: adding print statements to the code to trace what’s happening. Well-designed debug messaging is valuable, but iteratively adding temporary statements is tedious and error-prone since engineers must guess the source of a test failure and re-compile every time they change the code. These temporary print statements should be deleted so they do not reduce code readability and clutter simulation output once the bug is fixed, but editing code excessively introduces more risk. Controlling a simulation as a test runs, having full visibility into all variables, and modifying variables to exercise “what-if” scenarios make for a more scalable and more efficient process.
I asked Cristian whether DVT Debugger users ever use the debuggers built into the simulators, and he said that they do. Simulation vendors provide a lot of “hooks” for other tools to link in but there may be features available only in their own debuggers that require proprietary connections. He said that the goal of their tool is not to replace simulator debuggers but rather to offer a rich, software-like debug experience in the same environment where design and verification engineers write their code. As in their other products, AMIQ EDA has taken powerful, proven techniques originally developed for programmers and adapted them to add value to the hardware design and verification flow. As Martha Stewart used to say, it’s a good thing.
To learn more, visit https://www.dvteclipse.com/products/dvt-debugger.
Also Read
Automatic Documentation Generation for RTL Design and Verification
An Important Next Step for Portable Stimulus Adoption
With Great Power Comes Great Visuality
Share this post via:


Comments
There are no comments yet.
You must register or log in to view/post comments.