
“A picture is worth a thousand words” is a widely known adage across the world. Recognizing patterns and cycles becomes easier when data is presented pictorially. Naturally, data visualization technology has a long history from the early days, when people used a paper and pencil to graph data, to modern day visualization platforms. While visualization products have gotten fancier, driven by the data age we are in, the semiconductor industry was among the early industries that needed them. Electronics is all about signals and waveforms. It is easier to comprehend and analyze that data graphically than in the form of a table of data points. While Microsoft Excel has always offered visualization through its graphing feature, visualization solutions received broad market attention after Tableau introduced its visualization platform in 2003.
Visual Studio (VS)
Over the last couple of decades, rapid advances in the field of software have led to the introduction of integrated development environment (IDE) platforms. While there are many development platforms available to software developers, Eclipse and Visual Studio are two well-known and widely used IDE platforms. Is an IDE platform a visualization platform per se? Well. The platform itself is an environment that enables visualization of all sorts through various specific tools that work under that environment. The platform makes this possible through ongoing addition of extensions to support interfacing to various analysis and visualization tools.
So, why is Visual Studio called visual studio? Does it mean Eclipse IDE is not a visualization platform? The Visual Studio name has Visual Basic to thank for it. The developer GUI to Visual Basic earned it the name almost three decades ago. While the development environment has expanded since then, Microsoft has maintained the “visual” prefix for their modern-day IDE. Eclipse IDE is also a visualization platform, even though it does not have “visual” in its name.
Visual Studio (VS) Code
Visual Studio Code is a source code editor developed by Microsoft for Windows, Linux and OS X. It works within the Visual Studio IDE environment and includes support for debugging, embedded Git control and the IntelliSense feature. IntelliSense is a code-completion feature that is context-sensitive to the language being edited. VS Code is also customizable for the editor’s theme, keyboard shortcuts and preferences. In November of 2015, Microsoft released the VS Code source code under the MIT License and posted on GitHub.
A long list of extensions and themes ecosystem is available for VS Code, making it a very popular editor. The open-source nature of the source code is also attracting a large section of the developer community. The speed performance of the editor is not shabby either.
Semiconductor Design and Verification
Design and verification of semiconductors involves code development too. While VHDL and Verilog are not the standard software languages, they are programming languages nonetheless. Design and verification tasks can benefit from an IDE just as software coding and testing do. As such, there has been interest and a push for IDE offerings to support the semiconductor community.
AMIQ EDA
AMIQ EDA provides software tools that enable hardware design and verification engineers to improve productivity and reduce time to market. Prior to its spinoff from AMIQ Consulting, the team had observed three recurring challenges semiconductor companies faced: developing new code to meet tight schedules, understanding legacy or poorly documented code, and getting new engineers up to speed quickly. In the software world, IDEs are commonly used to overcome such challenges. But in the early 2000s, no IDE was available for design and verification languages such as Verilog, VHDL, e and SystemVerilog. So, they developed an IDE for internal use.
In 2008, AMIQ EDA was spun off from AMIQ Consulting and Design and Verification Tools (DVT) Eclipse IDE was launched. They launched DVT Debugger in 2011, Verissimo SystemVerilog Testbench Linter in 2012, and Specador Documentation Generator in 2014. As a company that strongly believes in user-driven development and building solutions based on real-life experiences, they recently launched DVT IDE for VS Code. You can read their press announcement here.
AMIQ EDA’s products help customers accelerate code development, simplify legacy code maintenance, speed up language and methodology learning, and improve source code reliability.
DVT IDE for VS Code
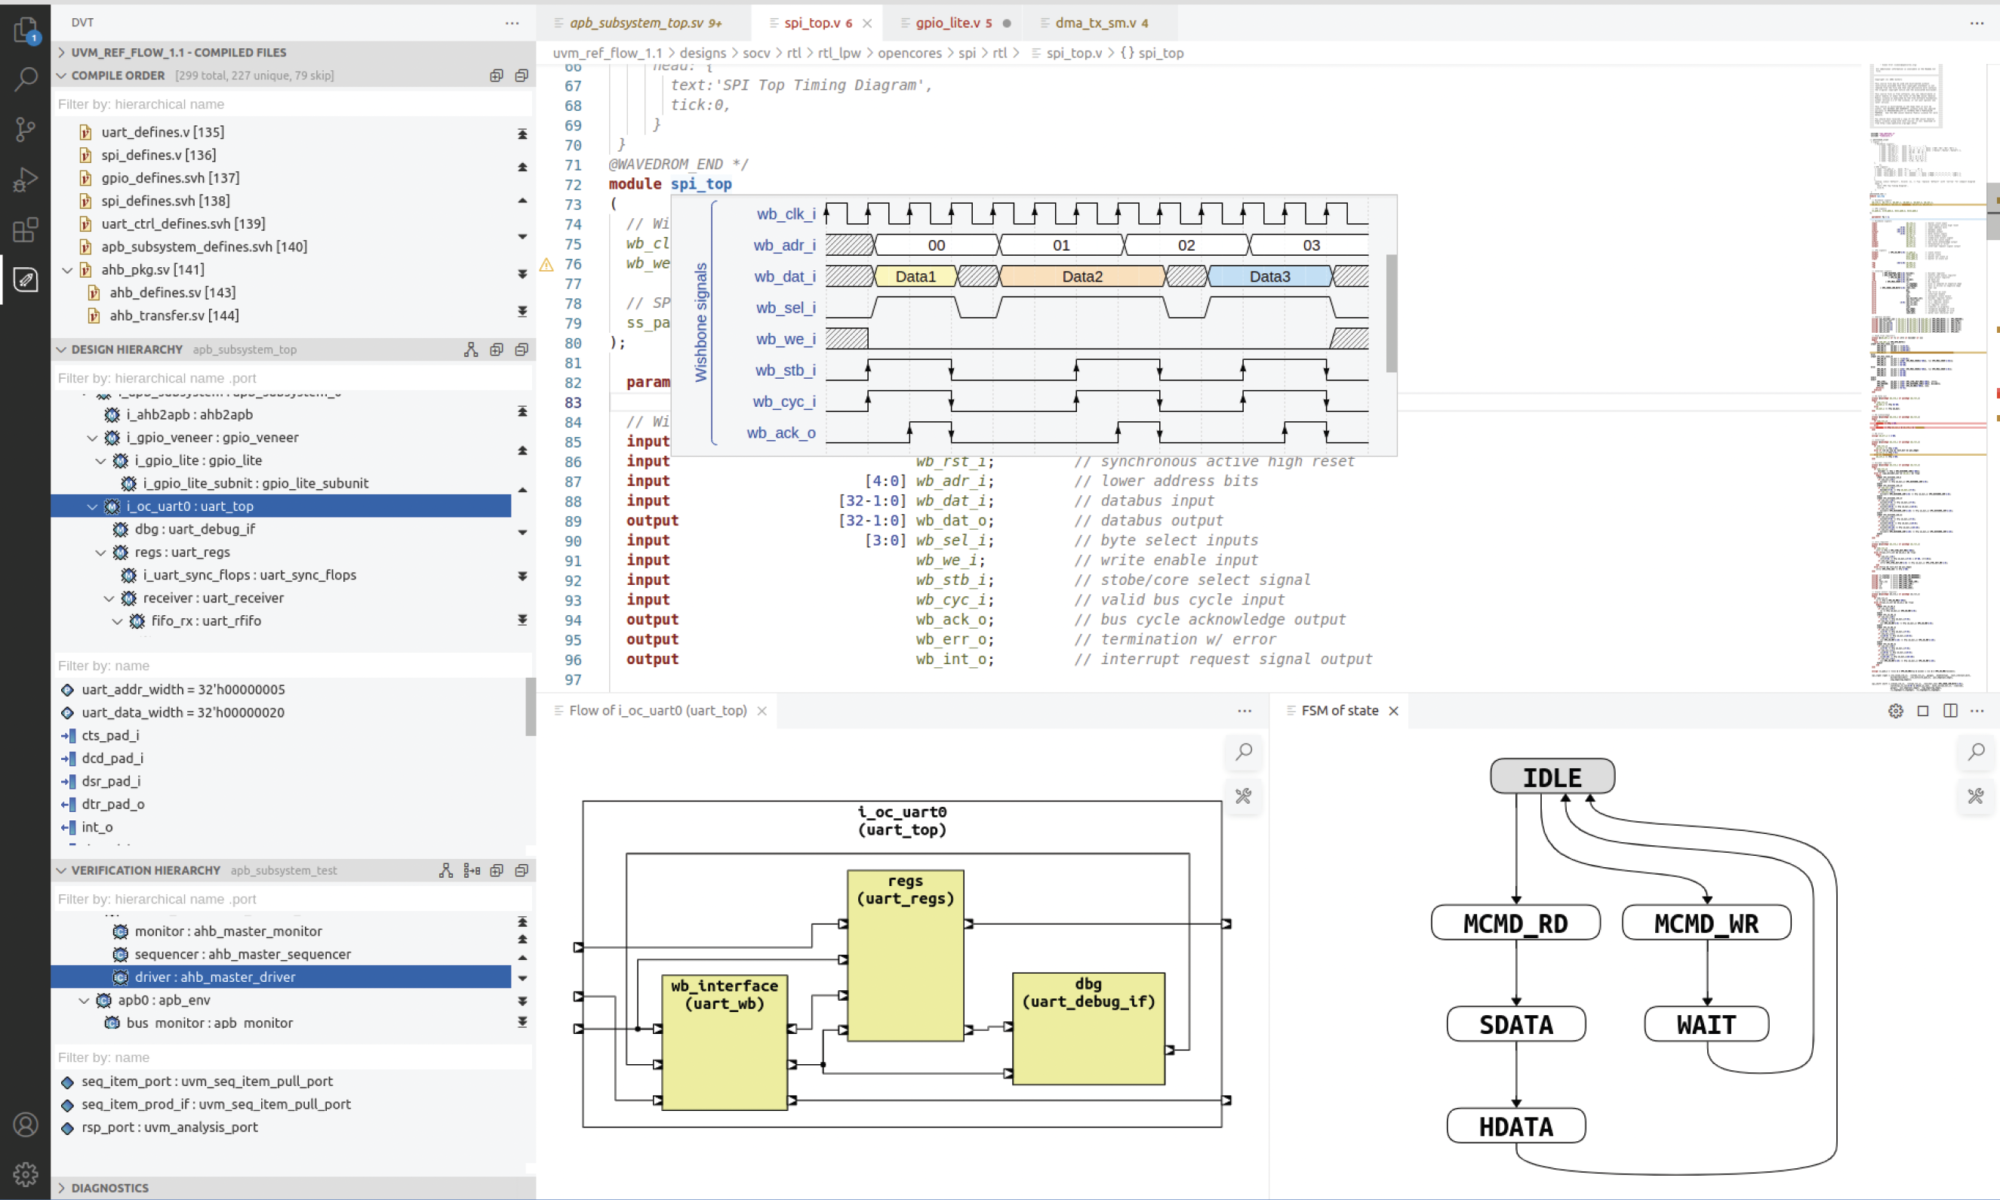
DVT IDE for Visual Studio Code (VS Code) is an integrated development environment (IDE) for SystemVerilog, Verilog, Verilog-AMS, and VHDL. The DVT IDE consists of a parser, the VS Code (editor), an intuitive graphical user interface, and a comprehensive set of features that help with code writing, inspection, navigation, and debugging. It provides capabilities that are specific to the hardware design and verification domain, such as design diagrams, signal tracing, and verification methodology support. The VS Code platform’s extensible architecture allows the DVT IDE to integrate within a large extension ecosystem and work flawlessly with third-party extensions.
DVT IDE for VS Code shares all the analysis engines with DVT Eclipse IDE, that is field proven since 2008. The product enables engineers to inspect a project through diagrams. Designers can use HDL diagrams such as schematic, state machine, and flow diagrams. Verification engineers can use UML diagrams such as inheritance and collaboration diagrams. Diagrams are hyperlinked and synchronized with the source code and can be saved for documentation purposes. Users can easily search and filter diagrams as needed, for example, visualizing only the clock and reset signals in a schematic diagram. Both tools also have important non-visualization features such as hyperlinked navigation, auto-complete, code refactoring, and semantic searches for usages, readers, and writers of signals and variables.
For a couple of screenshots showing the DVT IDE for VS Code in action, refer to the Figures below.


DVT IDE for VS Code is available for download from the VS Code marketplace. For more details, refer to the product page.
Also read:
Automated Documentation of Space-Borne FPGA Designs
Continuous Integration of RISC-V Testbenches
Continuous Integration of UVM Testbenches
Share this post via:


Comments
There are no comments yet.
You must register or log in to view/post comments.