

Each quarter, the EDA Consortium publishes the Market Statistics Service (MSS) report containing detailed revenue data for the EDA industry. The report compiles data submitted confidentially by both public and private EDA companies into tables and charts listing the data by both EDA category and geographic region. This newsletter highlights the results for the first quarter of 2011. Additional details are available in the press release, or by subscribing to the EDA Consortium MSS report.
Overall, first quarter 2011 EDA revenues increased 16% compared to the same period in 2010. Total revenue for Q1 was $1446.4 million. Figures 1 and 2, below, summarize the revenue growth for Q1 2011 compared to Q1 2010, detailed by category (figure 1) and geographic region (figure 2). The MSS report contains many additional sub-categories, allowing subscribers to perform a more detailed analysis of revenues affecting their business. A complete list of categories for 2011 is available here.

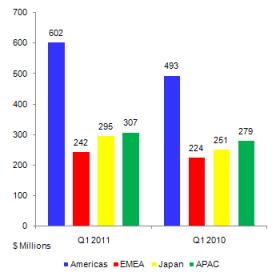
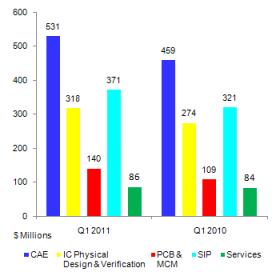
Figure 1: Q1 2011 EDA revenue growth by category Figure 2: Q1 2011 EDA revenue growth by region
Tables 1 and 2, below, show the percentage growth for the EDA industry by major category and region. (Negative growth is listed in parentheses).
Category Revenue
($ Millions) % Change
CAE 530.6 15.7
IC Physical Design & Verification 318.5 16.1
PCB & MCM 140.4 28.3
SIP 371.4 15.7
Services 85.6 2.2
Region Revenue
($ Millions) % Change
Americas 602.4 22.2
EMEA 241.8 7.8
Japan 295.3 17.7
APAC 307.0 10.0
Table 1: Q1 2011 EDA revenue growth by category Table 2: Q1 2011 EDA revenue growth by region
Figure3 (below) shows the EDA revenue percentages by major category. As the chart shows, CAE remains the largest category, followed by Semiconductor IP and IC Design and Verification tools. Geographically, the Americas is the largest consumer of EDA tools, with the remainder divided amongst Europe, Middle East, and Africa (EMEA), Japan, and Asia Pacific (APAC), as shown in Figure 4.
Figure 3: Q1 2011 EDA revenue percentage by category Figure 4: Q1 2011 EDA revenue percentage by region
Figure 5 shows the historical EDA revenue for the major categories (CAE, PCB & MCM, IC Physical Design and Verification, SIP and Services) from Q1 1996 through Q1 2011. Each quarter’s MSS report contains detailed data for the current year as well as the previous 3 years quarterly data in both tabular and graphical formats.
Figure 5: EDA revenue history, 1996 – present
Data is reported confidentially to an independent accounting firm, which allows both public and private companies to report revenue data by detailed category. Individual company data is not reported, and steps are taken to further protect individual data for categories with a small number of reporting companies. Contributing data is free, and contributors will receive the quarterly MSS executive summary report. The full report is available via subscription, and contains substantially more detailed information for EDA revenues by category and region, providing the information subscribers need to analyze trends in EDA.
For more information on the MSS report, including information on subscribing to the report and the benefits of joining the EDA Consortium, please visit the EDAC web site, or email mss11@edac.org.


Consolidation and Competition: Who is Winning the $4.5 Billion Interface IP Race?