Steve Bailey entertained us during lunch on Tuesday with a talk on debug and visualization in the Mentor 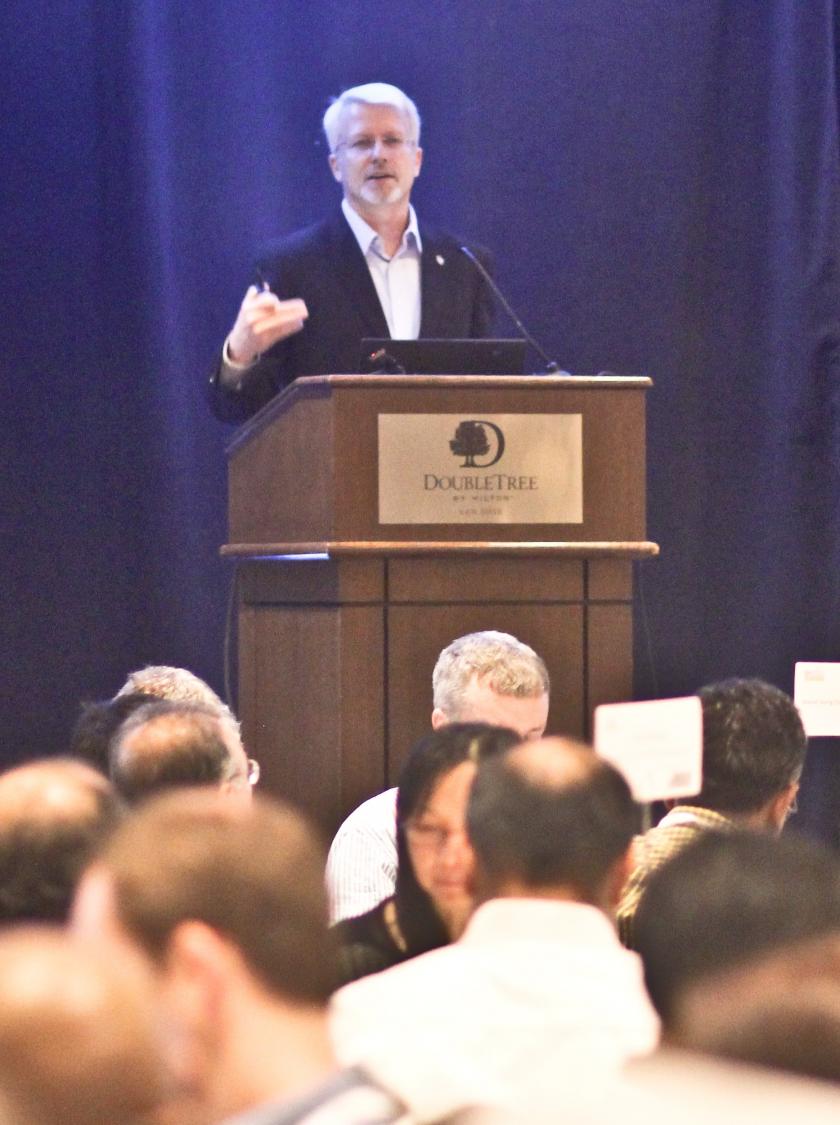 platform. Steve is based in Colorado, so had to spend the first part of his talk gloating about their Super Bowl win, but I guess he deserves that.
On a more technical note, he showed us a familiar survey they had completed with the Wilson Group in which 37% of verification time, the largest part of the cycle, is spent in debug. So whatever vendors do to improve verification, it better have a big impact on improving debug. For Mentor that means four things:
· A single debug solution to cover the whole flow
· Get to more data, faster, the first time
· Root cause failure symptoms faster
· Strong navigation of design and activity
On a single solution to cover the whole flow, Visualizer Debug is the common debug interface whether you are using Vista Virtual Prototype, Questa Formal, Questa Simulation, Veloce Emulation or FPGA prototyping, or any combination of these. To get to the right data, faster, you can now start with a minimum trace set to run fast and small and still be able to reconstruct untraced signals quickly. Mentor has a 2X improvement in time to debug with Veloce and 4x improvement in debug performance.
Mentor does a nice job on root cause traceback and the standard navigating capabilities (hierarchy – rtl – schematic – activity cross-probing) but I’d like to focus on three features that I found to be leading-edge – testbench debug, CodeLink and post-silicon debug.
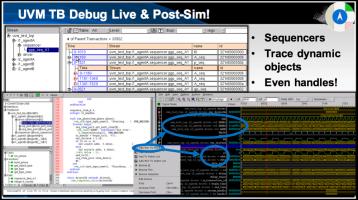
I’m not sure what the stats are on typical time spent debugging a testbench versus time spent debugging the design, but I’m pretty sure testbench debug consumes a sizeable percentage. So you need just as much debug support for the testbench as you do for the design. But UVM or similar standards look a lot more like software than design, so you need the kind of capabilities you would expect to find in a state-of-art software debugger: component hierarchy browsers, class browsers, object browsers and more. Then you want to be be able to probe values and objects and view transactions in a waveform or a stripeview, and debug around the problem. Visualizer gives you all of this.
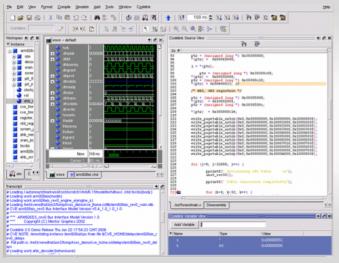
CodeLink ™ takes the next obvious step by allowing you to debug hardware and software together. Now you have a software debugger which can reach all the way down into the underlying hardware, which is important in all sorts of ways. In one talk I heard a user expert mentioning the need to cycle through firmware just to get out of reset. Power management controllers straddle the line between hardware and software. Then there’s multi-threading, cache-coherency – it has really become impossible to draw a sharp line between hardware and software. Debug platforms like CodeLink have become essential to manage this blurring of domains.
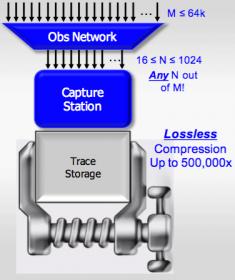
Finally there’s silicon debug. Certus™ is most commonly used with FPGA designs and FPGA prototypes. I find the prototyping use most interesting in its role to complete the flow of engines to functionally model design. FPGA prototyping is enormously valuable in providing software developers a platform which can run at speeds acceptable enough to support early software development. But debugging prototype hardware is not easy – there’s a lot less visibility into internal nodes than you would have in simulation or emulation. Certus provides a way to instrument your FPGA prototype so you can capture very deep internal traces for review in debug through the JTAG port.
You can learn more about Visualizer , CodeLink and Certus HERE.
Share this post via:


Comments
There are no comments yet.
You must register or log in to view/post comments.