When it comes to debugging a design testbench organized in object-oriented style with objects, component hierarchies, macros, transactions and so on, it becomes an onerous, tasteless, and thankless task for RTL verification engineers who generally lag in software expertise. Moreover, class-based debugging tools have lagged simulators ability to simulate these testbenches. However, modern testbenches are most likely to be class-based using object-oriented programming concepts. They are generally developed using SystemVerilog and UVM. In such a situation, how about having an automated, GUI driven, post-simulation debugging environment which becomes a fun to operate with for RTL verification engineers without needing software expertise? Yes, such class-based debugging tools and environment have come up to make debugging of SoC design testbenches easy, interesting and productive.
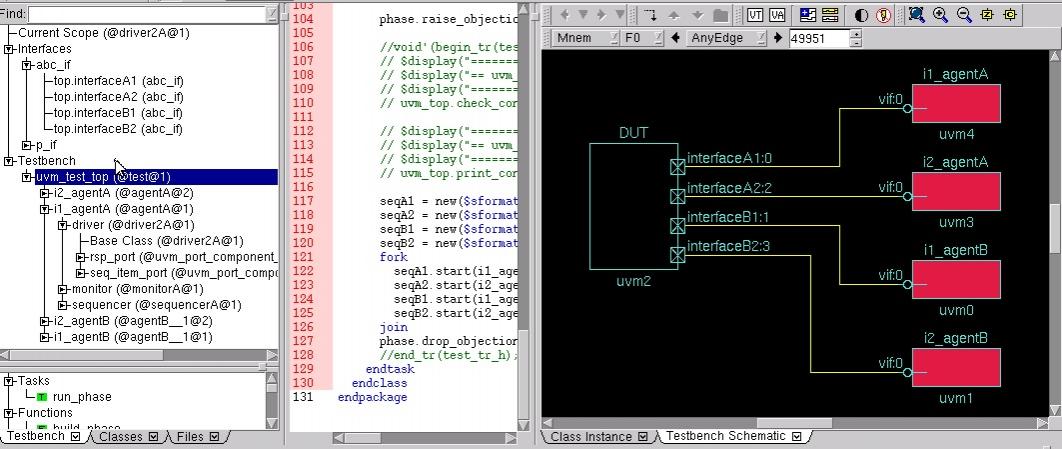
Mentor’sVisualizer along with Questa simulation provides an excellent class-based debugging environment. In the above diagram, there is a simple UVM schematic with a DUT and four interfaces. Each interface is connected to an agent. Traversing down the hierarchy, we can see that each agent has a sequencer, a driver, and a monitor. Although the UVM-based testbench can always be explored through schematics, a faster and convenient approach for debugging large circuits can be to debug directly through objects in the testbench.
The UVM component hierarchy can be traversed to any level. Any object selected in the component hierarchy window will have its corresponding source code displayed in the source code window. In the source code, the value of any member variable inside an instance of an object can be displayed by just hovering over the variable. In the post-simulation mode, all objects that existed during simulation and recorded by Questa are accessible for investigation into their class member variables. Similarly virtual interfaces of the objects can be explored. For post-simulation exploration, there are easier ways to display all member variables of an object at once at any instance of time.
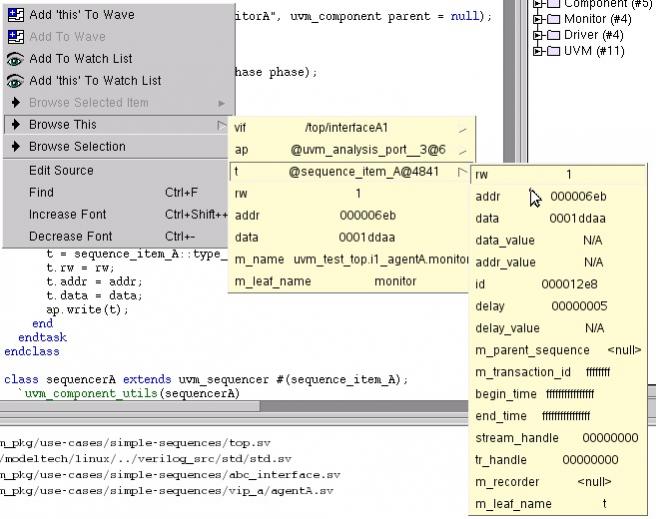
By pressing the right-mouse-button in the source code of an object, selecting ‘Browse This’, and then selecting ‘t’, one can see the complete object pointed to by ‘t’ at the current time. The ‘t’ points at the object ‘@sequence_item_A@4841’ in the above example. A still shorter way to see the object could be by selecting ‘t’, pressing right-mouse-button, and then selecting ‘Browse (t)’.

By pressing the right-mouse-button and selecting ‘Add ‘this’ To Wave’, one can add the current object to the waveform window and display all the transactions that the object has created. That’s really powerful.
The Class Instance Window provides another way of exploration for UVM testbenches. It is organized by base class. By expanding and selecting particular objects we can change the current context to a required object. The creation times of different objects are displayed in this window. A search can be created to find objects created between two times. Also, instances can be searched based on a regular expression.
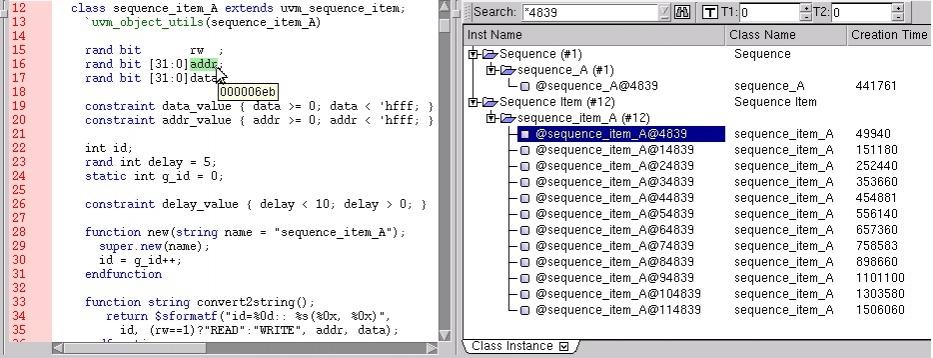
In the above window, a search is created based on any object ending in ‘4839’. The regular expression “*4839” has been entered in the search field. A selection of the first sequence_item_A has also displayed the source code for that object. Hovering over the ‘addr’ field shows the address for that transaction (that sequence item). Similarly, the other sequence_item_A objects can be investigated.
Also, the expressions can be created on particular address values for checking transactions on those addresses.

A StripeViewer is opened above and expression ‘32’h000006eb’ entered in the ‘addr’ field. A search then shows the above transactions.
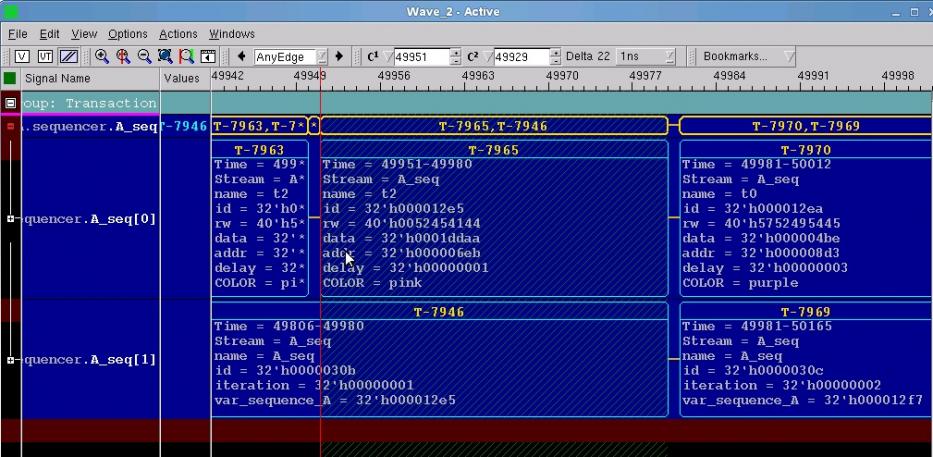
On a click on ‘Add to Wave’, the transaction stream enters the wave window. A selection of any transaction in the StripeViewer highlights the same in the wave window. For example, the transaction selected, as shown in green in the StripeViewer, moves the cursor to the particular transaction in the wave window as shown above.
This kind of post-simulation class-based debugging brings a new dimension to modern SoC verification and debugging. The designers can have full visibility into the design with little effort and RTL verification engineers can easily debug the design. Read a whitepaperwritten by Rich Edelman at Mentor Graphics for a detailed and interesting tour over these methods. They have applied this approach for debugging real customer designs with great success!
Pawan Kumar Fangaria
Founder & President at www.fangarias.com


Comments
0 Replies to “Never Imagined So Easy Class-based Testbench Debugging”
You must register or log in to view/post comments.