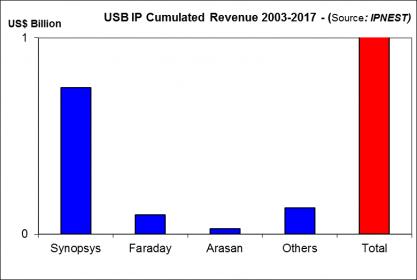
Despite the strong consolidation in the semiconductor industry, the Design IP market is going well, very well with YoY growth of 12%+ in 2017, according with the “Design IP Report” from IPnest. If we look at the Interface IP category (20% growth in 2017) and analyze the IP revenues by protocols, we can see that USB IP is amazingly healthy, showing a 31% YoY growth for USB 3.x IP. It’s amazing because the USB protocol was first released in the 1990’s and USB 3.0 in 2008.

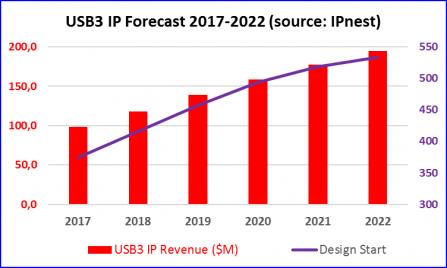
If you look at the above picture, you realize that USB protocol (USB 3.x, USB 2 and before) has generated 1 billion of IP revenues since 2003. Ipnest is closely following the wired interface IP category since 2008, I can confirm that USB IP yearly revenues have grown every year since 2003, again in 2017 and the 5 years forecast (2017-2022) is also exhibiting YoY growth. If you consider USB 3.x only, the attached 5 year CAGR is similar to the other protocols like PCIe, memory controller, MIPI or Ethernet, in the mid-ten points of percentage.
Now, if you integrate all the USB functions like USB 2 and below, the overal USB IP revenue is higher by 40%, but the growth rate lower. In fact, IPnest has splitted USB 3.x and USB 2 IP business since the begining in order to provide more accurate analysis. These two families have a different behavior, addressing different type of application. This split is unique if you consider the various wired interface protocols. Taking PCI Express as an example, when the version 2 was released, the chip makers who adopted PCIe 1.0 decided to move to PCIe 2.0 with no exception, the same again for the release 3.
If we consider USB adoption, the behavior is completely different in respect from USB 3.0 adoption. In many application integrating USB, the need was for a standard interconnect technology, allowing to plug and play with no burden, not for always more bandwidth capacity (like for PCIe). We have separately monitored USB 2 and USB 3.x IP revenues since 2008, and we can confirm that USB 2 IP revenues have grown up to 2014, althought USB 3.0 has been released in 2008. In 2017, the trend is clear, USB 2 is declining with revenues 30% lower than in 2013, when USB 3.x is growing, with IP revenue almost reaching $100 million and 31% YoY growth.

For every protocol, IPnest build 5 years forecast, like you can see on the above picture (except for USB, where we build two distinct forecast). To build a forecast, the analyst has two options. The first is to be an excellent Excel user, introduce a certain equation, and delegate your intelligence to the tool. That’s why you frequently see this type of forecast result: “$2142.24 million in 2027, with 23.45% CAGR” …
As far as I understand, the author thinks “the most digits after the comma, the best the forecast”.
The other option gives less impressive results, but hopefully more accurate. In fact, you need to consider all the parameters that make sense in our industry. Like the market trends by segment (data center, storage, PC, PC peripherals, mobile, wired networking, wireless networking and so on). You need to evaluate the number of designs starts where the protocol will be integrated, and the target technology node (if you look at the above picture, we have evaluated this number to be 500 in 2020 for USB 3.x. They can’t be all on 7nm, right?). You also need to have an accurate idea of the average license pricing, for the digital part (the controller) and for the PHY. Moreover, you need to be accurate when forecasting this license ASP over 5 years.
At this stage, forget that you may have learned during your MBA, the wired protocol license ASP is GROWING, not declining with time (like commodity pricing would do).
At the end, you may use Excel, in fact you need to, but the best tool, by far, is your market intelligence and your experience in the semiconductor business (I have started in 1983, have seen many downturns, bubbles and heard enough stupid statement to stay reasonable…).
I must confess that IPnest has an advantage over the competition in term of forecast. Because we have started in 2009, we can confront a forecast made in 2010 with actual results 5 years later! And the difference is below 10%, and sometimes even below 5%…
The next picture shows that I am very proud to be part of the DAC IP committee (since 2016), where I really enjoy to discuss with other IP experts and confront our ideas. By the way, last DAC was great, and we have seen that the booths left empty by the lack of EDA start-up have been filled by IP start-up!

I will propose later in September a detailed analysis for another protocol (PCIe? Memory controller? Very High Speed SerDes?… you may suggest which one in a comment). If you’re interested by the complete analysis of the wired interface IP market and 5 years forecast, the “Interface IP Report” will be released at the end of September, just contact me: eric.esteve@ip-nest.com .
Eric Esteve from IPnest
Share this post via:


The Intel Common Platform Foundry Alliance