Josefina Hobbs, a solutions architect at Synopsys, demonstrates protocol debug made easy using the Synopsys Protocol Analyzer. This gives users a graphical view of the transfers, transaction, packets and handshaking of a protocol. The video also shows the integration of Synopsys Protocol Analyzer with SpringSoft’s Verdi using the Verdi Interoperability Apps (VIA) which gives open access to the Verdi KDB and FSDB databases.
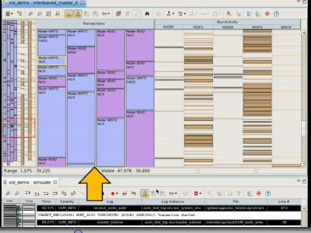
Analyzing the implementation of modern protocols is complex. Transactions on buses are interleaved and so the relationship between the transactions themselves, which ones are happening concurrently, and which bus activity is associated with which transaction is not obvious. The Synopsys Protocol Analyzer makes this clear. In the screenshot below, the leftmost part of the window shows the transactions, the middle part (with the arrow) shows the concurrent transactions and the right part (brown) shows the bus activity. By clicking on any of these, the corresponding other pieces of the puzzle are highlighted.

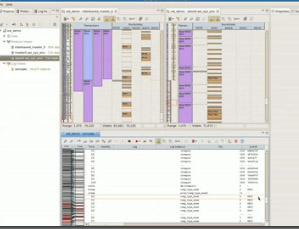
This makes it easy to unravel the complex behavior of highly interleaved traffic, understand activity, identify bottlenecks and debug anything unexpected. The Protocol Analyzer also links with simulation logfiles, as in the screenshot below, so that timelines in the protocol are linked to the same point in the simulation logfile, making it easy to investigate issues by moving up and down the different levels of abstraction.
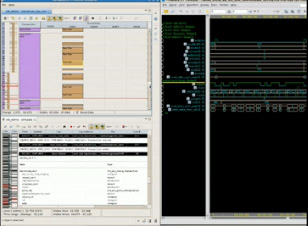
Protocol Analyzer can also be linked to SpringSoft’s Verdi so that the raw waveforms can be examined, and still have all the links to the higher level representations, and synchronized timelines, as in the screenshot below.
The video is hosted by Synopsys here and by SpringSoft here.


Comments
There are no comments yet.
You must register or log in to view/post comments.