The Silicon Catalyst Angels investment group recently announced the completion of three years of operation. There are great statistics associated with the organization and its financial results. This includes an over 4X increase in members since inception and an impressive list of investments. One of the noteworthy attributes of the Silicon Catalyst organization is its ability to build a collaborative ecosystem to nurture the startups in the incubator. Silicon Catalyst Angels has a similar DNA, which is quite unique in the investment community. Read on to better understand the remarkable backstory of this semiconductor focused investment group.
The Angel group is a separate corporate entity from Silicon Catalyst, with membership by accredited investors that have deep strategic and operational experience from their many years in the semiconductor industry. You can learn more about Silicon Catalyst on SemiWiki. Recently, I had the opportunity to explore the history and accomplishments of Silicon Catalyst Angels with some of its leadership. I was able to speak with Pete Rodriguez, CEO of Silicon Catalyst, and the board of directors at Silicon Catalyst Angels, a rather impressive team. What follows is a summary of our discussion.
The Beginning
Pete explained that when he joined Silicon Catalyst in 2017 the organization was focused on helping to craft a strong business plan for the early-stage companies in the incubator. Another goal was to provide In-Kind Partner services to remove the immediate use of scarce funds for EDA and TSMC shuttles. As is the case, the need for working capital to cover the operational costs of startups is always front and center – true then and even more so in today’s markets.
Early in the history of Silicon Catalyst, there were 20 investment groups (institutional and corporate VCs) in their ecosystem. Among them was Sand Hill Angels. Laura Swan, one of the partners at Silicon Catalyst, was also part of Sand Hill Angels, as were several other partners at Silicon Catalyst and its advisor network. Building on the procedures developed by the established Silicon Valley investment groups, Sand Hill Angels and Band of Angels, in early 2019 the board of managers at Silicon Catalyst decided to create an angel investment group, based on the plan that was developed by Richard Curtin, one of the managing partners at Silicon Catalyst. Silicon Catalyst Angels (SCA) investment group was then launched in July 2019, as a separate corporate entity, to enable accredited investors to help fund the semiconductor startups.
The SCA board of directors includes Amos Ben-Meir as president, a long-time member of Sand Hill Angels, bringing deep investment experience, with over 200 angel investments under his belt. Additional board members include Raul Camposano and Michael Joehren, along with Laura Swan, as VP of operations. The deal flow was initially targeted to hear pitches from the companies in the Silicon Catalyst Incubator but has now expanded to selectively invite other semiconductor startups not currently in the Incubator. These organizations pitch for seed funding from Silicon Catalyst Angels members. With low membership investment commitments and low annual dues, the Silicon Catalyst Angels investment group was off and running.
Building Momentum
The initial challenge was to attract new members to the investment group. The feeling was that many of the technology investors in the Silicon Catalyst ecosystem didn’t get involved with other angel groups because the fees and investment requirements were too high and, most importantly, they would rarely see a semiconductor company as a candidate, the area that this community knew a lot about. The laser focus of the Silicon Catalyst Angels group on semiconductor investments seems to have paid off. While most of the investments have been for Silicon Catalyst incubator companies, startups outside the organization have approached Silicon Catalyst Angels because of its reputation as being semiconductor savvy. This becomes another avenue for the startups to explore joining the incubator, as well as to pursue seed funding.
As any savvy investor understands, whether in semis or elsewhere, due diligence is key. With the extensive semiconductor industry expertise of the members, the Silicon Catalyst Angel group uniquely offers a level of drill-down to assist in de-risking potential investments.
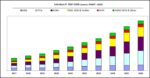
The syndication of investments by angel groups is a potent strategy that is rare elsewhere, but common for Silicon Catalyst Angels. At present, this group has made multiple rounds of investments in 12 companies, with an above-industry-average IRR. The investments from the syndication of these SCA deals are an even greater dollar amount – heavily leveraging the investor ecosystem to the benefit of the startup.
Laura Swan, VP of business operations at Silicon Catalyst Angels, provided additional perspective on this during her time at Sand Hill Angels, prior to joining Silicon Catalyst. As an “outsider” at that time, there were several reasons to join a deal associated with Silicon Catalyst and its angel investment group:
- Laser-focus on semiconductors, a complex and difficult subject to master for an investment team who typically looks at software deals
- Silicon Catalyst’s advisor network further reduces risk
- The Silicon Catalyst In-Kind Partner program delivers substantial monetary value, reducing the amount of investment capital needed and increasing investment leverage
All members of Silicon Catalyst Angels also get access to the Angel Capital Association, a highly respected and valuable resource to help educate angel investors and to ensure that industry best practices are well understood by its members.
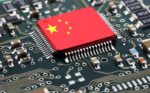
Thanks to the chip shortage and responses at the political level, such as the CHIPS Act, semiconductors have become more mainstream and more widely known. It turns out Silicon Catalyst Angels is at the epicenter of this renewed interest.
What’s Next?
We also touched on the type of deals being looked at by Silicon Catalyst Angel members. To borrow from the Silicon Catalyst tagline, it’s about what’s next. And Silicon Catalyst Angels sees the very newest ideas which suggest what’s next. As an R&D solutions architect at Renesas Electronics, Silicon Catalyst Angels board member Michael Joehren was able to offer an industry view. The group is seeing far more measurement technology that leverages MEMS advances. Generally, the focus is on the blending of biotech and healthcare with a dose of high-performance bandwidth for information delivery.
Michael explained that while there is continued interest in things like glucose meters, semiconductor-assisted measurement is expanding. Chemical analysis for air quality is a good example. There are many new standards in this area and vast networks of sensors are the only practical way to achieve compliance. Raul Camposano, another board member, explained that materials research is focused on other areas such as battery design. He also offered that the ability to literally print molecules takes massive compute capability that drives a lot of new work as well, with interesting investment opportunities at the intersection of life sciences and semiconductors.
I concluded my discussion with a “crystal ball” question. What impact will the current financial climate have on the future of semis and the associated technology? There was a lot of perspectives offered, but the general feeling was that the semiconductor industry is cyclic in nature. We are just experiencing another cycle. Yes, and now there are geopolitical aspects to also consider. At the end of the day, the growing combination of semiconductors and life sciences will continue to drive innovation, growth and the opportunity for financial and social gain.
So, there’s a bit of the remarkable backstory of this semiconductor focused investment group. There are exciting times ahead. If you’re interested, to learn more about membership details or for startups looking to pitch, contact Silicon Catalyst Angels.