

This is the nineteenth in the series of “20 Questions with Wally Rhines”
When I moved from the semiconductor industry to Mentor, I expected most of my technology and business experience to apply similarly in EDA software. To some extent, that was correct. But there was a fundamental difference that required a change in thinking. Product inventory, especially for semiconductors, must be minimized because it has both real and accounting value. We used to say that semiconductor finished goods are like fish; if you keep them too long, they begin to smell. Software inventory doesn’t even exist. When the order is placed, the actual copy of the software is quickly generated and shipped.
EDA customers are aware of this “software inventory” phenomenon. There is no deadline for purchases that takes into account the lead time for manufacturing, as there is when ordering semiconductor components; an EDA order placed near the end of a quarter can be filled within that quarter. Negotiations for large EDA software purchase commitments tend to drag on until near the end of the quarter when customers suspect they will get the best deal. To counter that, EDA companies provide incentives, or other approaches, to minimize the last minute pressure.
If negotiated terms are not satisfactory, why don’t the EDA companies just let the orders slide into the next quarter? Sometimes they do. But, unlike the semiconductor industry (or any other manufacturing industry), EDA software is between 90% and 100% gross margin. Profit is therefore asymetric. In a semiconductor business, a dollar of cost reduction improves profit by one dollar and a dollar of incremental revenue increases profit by typically 35 to 55 cents. So cost reduction has a larger impact on profitability than revenue growth. In the EDA industry (or most software businesses), a dollar of cost reduction has nearly the same profit impact as a dollar of incremental revenue. The conclusion: working on incremental revenue growth is just as productive, and a lot more pleasant, than working on cost reduction. In addition, a 5% miss in revenue produces about a 25% miss in profit (if the company’s operating profit is normally 20%) so it’s very disturbing to shareholders when an EDA company misses its revenue forecast because the accompanying profit miss will be large.
During the last decade or so, another profit leverage phenomenon has been important. With interest rates at very low levels, acquisition of another profitable company using cash is very accretive to earnings, i.e. cash that is sitting on the balance sheet collecting very little interest now becomes a profit generating asset that increases overall earnings for the acquiring company. A variety of industry analysts and investors have even taken the position that a company that doesn’t fully utilize its borrowing power is under-utilizing a corporate asset. That ignores the risk element associated with borrowing but it has encouraged lots of acquisitions, especially in high technology. Although there has been some consolidation in the semiconductor industry, the primary change has been a higher degree of specialization. Companies like TI that once produced nearly every type of semiconductor and very little profit now produce primarily analog and power devices and consistently among the highest profit in the semiconductor industry. Similarly for NXP moved from a broad mix of products to specialization in automotive and security components.
For EDA, there seems to be something stable about oligopolies. In the 1970’s, Computervision, Calma and Applicon had the largest combined share of the computer automated design industry. In the 1980’s, it was Daisy, Mentor and Valid. In the last three decades, it’s been Mentor, Cadence and Synopsys. The “Big Three” of EDA in recent years have had a combined market share between 70 and 85% and most of that time it was 75% plus or minus five percent. One reason that may have led to this phenomenon is that EDA tools are very sticky; there is typically a de facto industry standard for each specialization, like logic synthesis, physical verification, design for test, etc. It’s very hard to spend enough R&D and marketing cost to displace the number one provider of each of these types of software so changes occur mostly when there are technical discontinuities that absolutely force adoption of new methodologies and design tools. I suspect that most EDA companies make most of their profit from the software products where they are number one in a design segment (GSEDA analyzed nearly seventy such segments for the industry that are over $1 million per year in revenue).
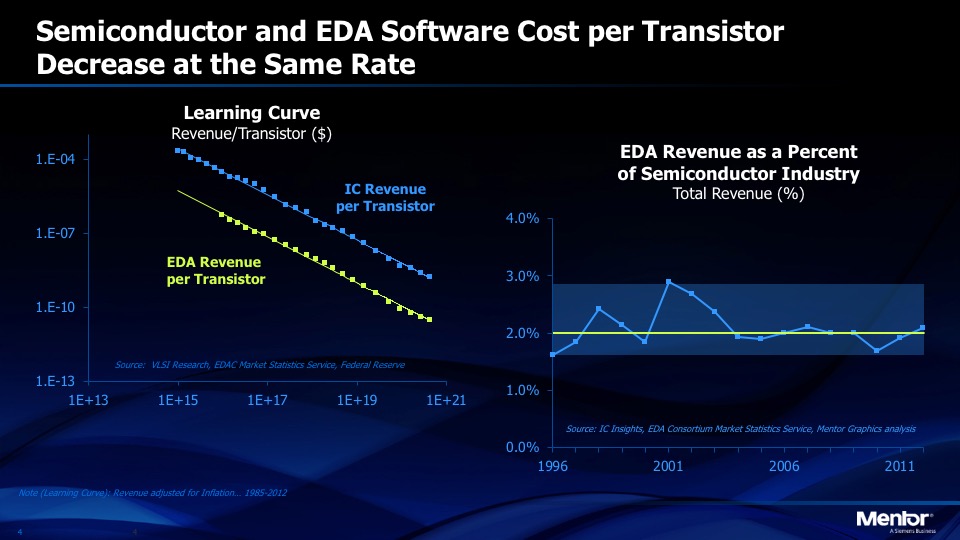
Finally, I find it interesting to look at the EDA cost from the perspective of the companies purchasing the software. Frequently, I hear the complaint that EDA companies never lower the price of their software while semiconductor companies have to reduce the cost per transistor of their chips by more than 30% per year. To analyze this complaint, we used published data to look at the “learning curves” for semiconductors and EDA software (see Figure One).
A semiconductor learning curve is a plot of the log of cost (or price) per transistor on the vertical axis and the log of the cumulative number of transistors ever produced on the horizontal axis. For free markets like semiconductors, the result is a straight line, presumably forever. Semiconductor industry analysts publish data on the number of transistors produced each year as well as the revenue of the industry. The Electronic System Design Alliance publishes the revenue of the EDA industry. When you plot the semiconductor industry revenue per transistor and the EDA industry revenue per transistor on a learning curve, as in Figure One, the straight lines are exactly parallel. That means that the EDA software cost per transistor is decreasing at the same rate as the semiconductor revenue per transistor. Is that a surprise? It shouldn’t be. Just as the semiconductor industry has spent 14% of its revenue on R&D for more than the last thirty years, it has spent 2% of its revenue on EDA software for nearly twenty-five years. If EDA companies failed to reduce their price per transistor at the same rate that the semiconductor industry must reduce its cost per transistor, then EDA would become a larger percentage of revenue for the semiconductor companies, exceeding the 2% average and forcing reduction of other semiconductor input costs.
It turns out that the total semiconductor ecosystem behaves similarly, reducing costs to provide better products and a six order of magnitude decrease in the cost per transistor over the last thirty-five years.
The 20 Questions with Wally Rhines Series
Share this post via:


TSMC CoWoS versus Intel EMIB Semiconductor Packaging