
If you’ve spent any time at all in the semiconductor industry, you’ve heard the statement that verification consumes two-thirds or more of the total resources on a chip project. The estimates range up to 80%, in which case verification is taking four times the effort of the design process. The exact ratio is subject to debate, but many surveys have consistently shown that verification dominates chip development. Less widely known is that many of these same surveys identify debug as the dominant verification task. Sure, it takes a lot of time to write testbenches, tests, monitors, scoreboards, assertions, and so on. Modern verification methodologies are quite effective at using these elements to find bugs. But investigating every test failure, determining the root cause, fixing the bug, and verifying the fix takes even more time than development. Further, the large number of bugs early in the development process and the many thousands of error messages generated can be completely overwhelming. In recent years, EDA vendors have focused more on speeding up debug with more precise error messages and better management of large numbers of warnings and errors.
In a recent talk with Cristian Amitroaie, CEO of AMIQ EDA, he mentioned that this is an area of great interest among his customers. His team has put considerable thought and effort into this challenge, producing some valuable new features. Cristian mentioned specifically a comparison and filtering mechanism recently added to AMIQ’s Verissimo SystemVerilog Testbench Linter. You may remember that we discussed this tool about a year ago; it checks SystemVerilog verification code using more than 500 rules. Verissimo finds erroneous and dubious code constructs, enforces consistent coding styles across projects, and fosters reuse. It can be run from a command line or within AMIQ’s flagship product, the Design and Verification Tools (DVT) Eclipse Integrated Development Environment (IDE). Users can easily enable and disable rules, add custom rules, execute the checks, and debug the errors within the IDE’s graphical environment.
AMIQ encourages users to run the testbench lint checks early in the verification process, often before all the code is written. If a user runs Verissimo early and often, code development can be an orderly process. However, it is rare that the results will cover only new code personally written by the user running the tool. Many designs are based on previous generations of chips, with extensive reuse of testbench code. Multiple engineers may also work on the same parts of the testbench. The result may be that running lint checks produces a lot of failure messages, and many of these may not be relevant to the changes being made and the new code being added. Users need ways to filter the messages and focus on the right areas. As they analyze the rule violations, debug the failures, and make fixes in the code, they want to be able to confirm these fixes without being distracted by all the other messages that are deliberately being ignored. It is also common to enable and disable rules as the project evolves, adding another level of possible confusion to the debug process. These are exactly the sorts of challenges that the lint compare and filter feature is intended to address.
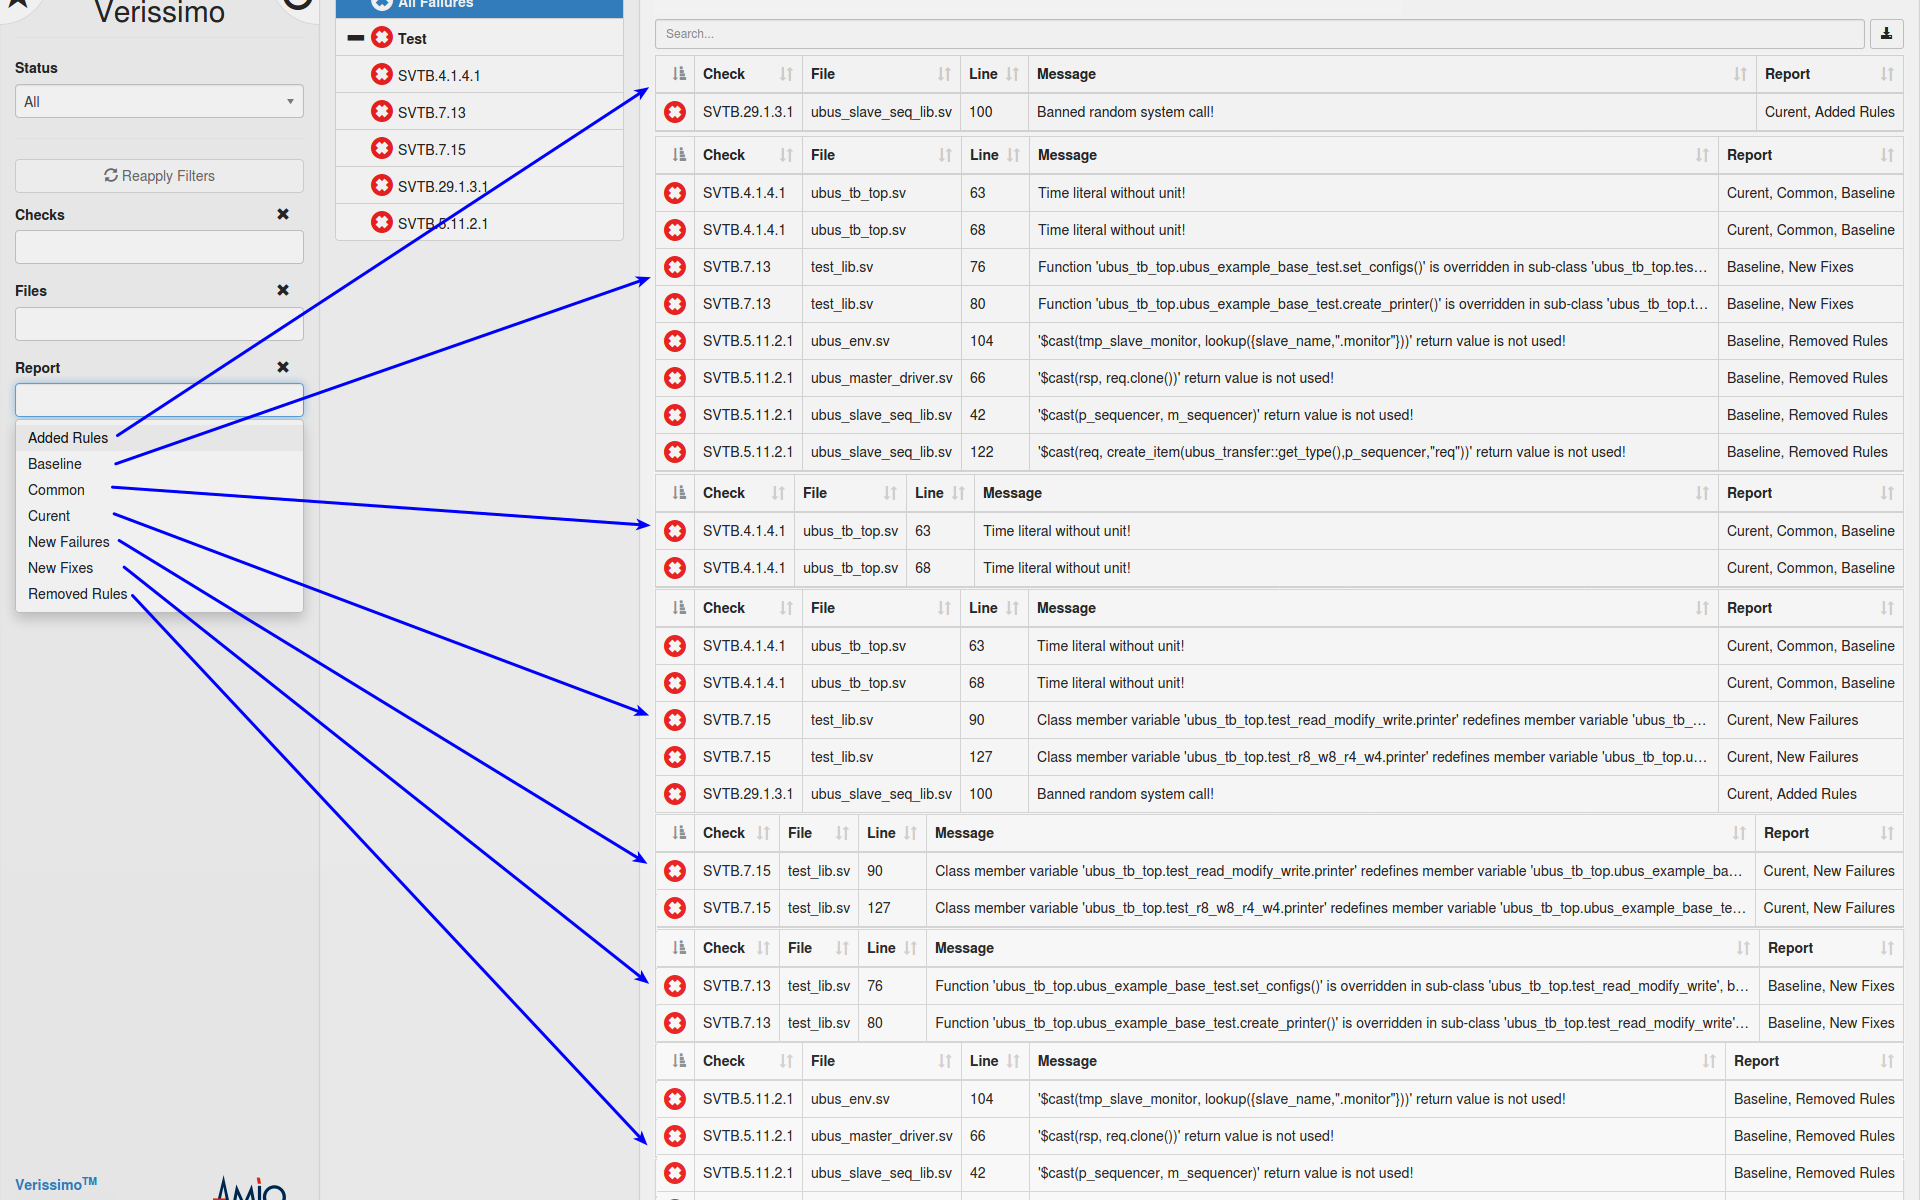
As Cristian explains it, the concept is easy to understand. Users run the Verissimo linter on the testbench code to establish a “baseline” report that may have a whole bunch of violation messages. After some violations of particular interest are debugged and fixed or after some new code is added, the lint checks are run again, and a “current” report is generated. In most cases, this new report will also have many messages, so it’s hard to see whether the code has improved or degraded after the changes. The compare step examines the baseline and current reports using a clever algorithm that clusters failures into several categories. Users can then use filters to intelligently look as what changed from one run to the next. Showing violations present in the baseline but not in the current report is a quick and easy way to verify that the intended fixes worked. Similarly, showing violations in the current report but not in the baseline reveals new problems introduced by the code changes. In either case, the hundreds or thousands of violations common to the two reports are filtered out. Some of these may be addressed later in the project or by other engineers working on the testbench, but in the meantime they are “noise” and ignoring them is a big productivity boost.

The filters also make clear the effects of changing lint rules. If a rule from the baseline run is disabled in the current run, users can filter to view the associated violation messages. If a rule is added for the current run, users can view just the associated new violations. Users can save all the reports and all the compare results generated throughout the project to show verification progress over time. This is surely of interest to managers, who want to ensure that testbench linting is adding value while not forcing reviews of working old code that they do not want to touch. The net effect is that engineers can focus on linting only their own testbench code without being distracted by issues in reused code or code being developed by others. Cristian points out that filtering is a much safer approach than waiving violations not of immediate interest. It’s easy to leave waivers in place and therefore never examine the deferred results. Filtering hides these issues to speed debug, but they can be viewed at any time by looking specifically at the violations common to the baseline and current reports.
You can see how the lint compare and filter feature works with a demo movie. I didn’t really appreciate how valuable this is until I saw Verissimo in action. I congratulate the AMIQ team for taking this step to remove a significant barrier in the verification and debug process. As always, I thank Cristian for his time and his insight.
To learn more, visit https://www.dvteclipse.com/products/verissimo-linter.
Also Read
Debugging Hardware Designs Using Software Capabilities
Automatic Documentation Generation for RTL Design and Verification
An Important Next Step for Portable Stimulus Adoption
Share this post via:


Comments
One Reply to “An Important Step in Tackling the Debug Monster”
You must register or log in to view/post comments.