Naturally, chips that fail test are a curse, however with the advent of Scan Logic Diagnosis these failures can become a blessing in disguise. Through this technique information gleaned from multiple tester runs can help pin down the locations of defects. Initially tools that did Scan Logic Diagnosis relied on the netlist to filter locations for various faults. This made it possible to exclude a number of potential locations. In the push to improve the so called “resolution” of the diagnosis, the tools started considering layout information. This went a long way toward narrowing down the list of potential fault locations.
When layout information was added to the mix, there was enough information to use the same data for yield analysis. However, even with the improved resolution in the number of suspects, the results from the diagnosis-driven yield analysis were not good enough. The engineers at Mentor realized that there was more information to be gleaned from the root cause analysis that comes from the test data and the design itself. What normally happens is that a number of potential root causes are identified and the probability of each one is reported. Each different failure will have a unique distribution of these potential root causes.
 Mentor developed a technique called Root Cause Deconvolution (RCD) to help improve the fault location prediction. Mentor has a white paper on how RCD works and what kind of results it can provide. For a baseline, they conducted a simulated experiment to show how effective root cause prediction normally is. They injected two different types of single defects in different locations in a total of 470 devices. Without RCD the predicted root causes included 49 types of faults. Even the prediction of the second most probable root cause was not correct. They saw 47 probable root causes that did not correspond to any actual root cause.
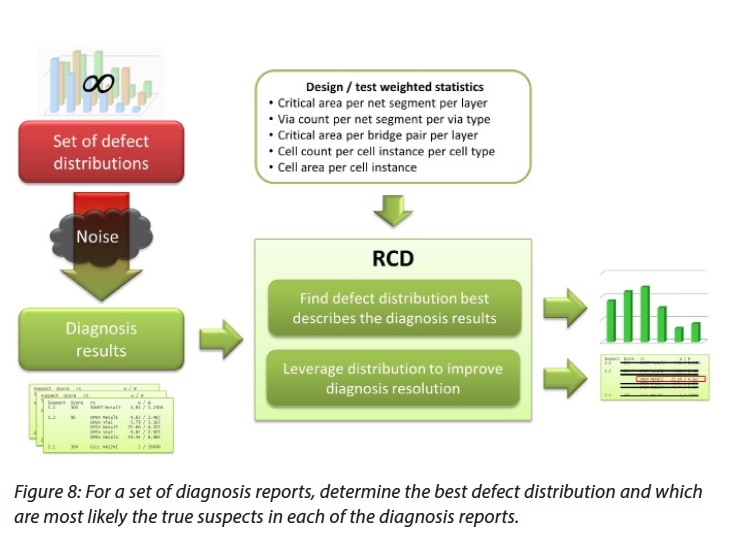
When they ran with RCD the predictions narrowed dramatically down to just three root causes. This is a pretty significant improvement. RCD uses critical area information and then examines the design in detail to come up with probable root causes and their defect distributions. This data is then used to compare observed defects with the statistical information computed from the design. For realistic numbers of actual root causes the computation needed can rapidly explode. When using direct computation, even when considering only a few hundred root causes, the computational needs approach infinity. However, Mentor realized that machine learning can be used to help determine the number of relevant defect distributions that are worth looking at. It should be pointed out that machine learning is continuously finding new applications in the EDA space. This is not the first time that Mentor has decided to rely on machine learning to solve tough problems to deliver breakthrough results.
What is most interesting about RCD, as incorporated into their Tessent Diagnosis and Tessent YieldInsight, is that no additional data is required beyond what is normally needed for layout aware diagnosis. Also, in cases where diagnosis reports are encoded to protect proprietary information, the flow still works. Whenever RCD is used there are fewer probable root causes to look at, making resolving yield issues a much faster process. Because RCD’s design analysis actually can predict failure distributions in advance of failure analysis, it can open doors to more proactive yield enhancement. To learn more about how the entire process works, read the white paper entitled Leveraging Volume Scan Diagnosis Data for Yield Analysis that is available from the Mentor website.
Share this post via:


Comments
There are no comments yet.
You must register or log in to view/post comments.