RVN! 26 Banner revised (800 x 100 px) (600 x 100 px)

IP to SoC Flow Critical for ISO 26262

IP to SoC Flow Critical for ISO 26262
by Tom Simon on 12-17-2019 at 6:00 am

IP integration flow for functional safety

In thinking about automotive electronics safety standards, such as ISO 26262, it is easy to jump to the conclusion that they are in reference to systems such as autonomous driving, which are entering the marketplace. In reality, functional safety in automotive electronics plays a significant role in many well-established automotive systems, not just exotic emerging applications. ISO 26262 breaks down system failures into categories, known as Automotive Safety Integrity Levels (ASIL). They range from ASIL A to ASIL D, where D denotes failures that can have the highest potential for causing harm or death. Each of these potential failure types has well defined detection and response specifications.

Let’s consider some of the types of failures that might exist and are necessary to manage in today’s cars without fancy self-driving capabilities. Engine management and control fall within this category. Engine failure during critical driving maneuvers, such as crossing busy roads or merging onto a freeway could lead to injury. Likewise, uncommanded acceleration could prove extremely dangerous. More subtle failures such as premature or failed airbag deployment can lead to human injury. The same goes for braking and traction control systems, where erroneous or missed activation can lead to serious consequences. The truth of the matter is that cars now have dozens of systems that use sophisticated electronics to manage their operation – where failures can lead to big problems.

Many of these systems contain SoCs that integrate multiple IPs for processing, data communication, storage, sensor or actuator operation, etc. Designers of these SoCs need to rely on externally developed IP for portions of them. The issue that arises is that ISO 26262 requirements contemplate whether the IP is developed with the final application in mind, so system level consequences of low-level failures can be understood. There is a concept called Safety Element out of Context (SEooC) that enables us to discuss and deal with IP like this.

Technical safety flow at IP or SoC levels

Synopsys has released a technical paper that discusses how externally developed IP can be properly integrated into automotive systems that must be ISO 26262 compliant. It is still necessary to develop SEooC IP correctly for it to be considered for use in ISO 26262 compliant systems. The paper outlines the extra processes and development steps needed to properly build and document these IPs. Failure modes for the IPs must be identified and methods for verifying correct operation and detecting the failures must be defined.

There is a clear process for SoC developers to use when integrating externally developed IP. At the system level, when a fault is detected the system must be informed to transition into emergency operation or safe state to avoid a hazardous event. Monitoring, detection and response require bidirectional linkage amid the safety requirements between top level and lower level blocks in the system. The safety integration process needs to also consider the safety aspects, when performed with the proper deliverables ensures that danger from failures is minimized.

Synopsys has a keen interest in this because they are a provider of many automotive-grade IP components that are intended for use in ISO 26262 compliant systems. After summarizing the process for developing and integrating IP for these systems, they outline key deliverables that are essential for the process to proceed efficiently. Test cases and test environments are at the top of their list. Part of ISO 26262 is real-time fault injection to test during operation to see if the system can respond to failures. Fault locations and observation points are important deliverables. IP developers also need to document and transmit their SEooC assumptions. In addition to documentation, formal assertion checkers, test benches and test cases need to be provided as part of this. Finally, a full suite of hardware-software integration validation deliverables should be included. This is a broad set of pre and post silicon verification test method documentation and information.

The process is not a simple one, neither for the IP developer or the integrator. The paper is very helpful in identifying areas where attention should be paid in the overall process. This information is useful in determining if IP has adequate collaterals and was designed with the proper consideration for integration into automotive electronic systems. The paper also is useful for helping identify the work needed in taking properly built IP and integrating it into SoCs for automotive systems. The full paper, titled “Aligning Automotive Safety Requirements Between IP and SoCs” is available for download on the Synopsys website.


IEDM 2019 – TSMC 5nm Process

IEDM 2019 – TSMC 5nm Process
by Scotten Jones on 12-16-2019 at 10:00 am

IEDM is in my opinion the premiere conference for information on state-of-the-art semiconductor processes. In “My Top Three Reasons to Attend IEDM 2019” article I singled out the TSMC 5nm paper as a key reason to attend.

IEDM is one of the best organized conferences I attend and as soon as you pick up your badge you are handed a memory stick with all the conference papers (unlike some other conferences where there are no proceedings). It is very useful to get the papers before seeing them, I typically review a paper, see it presented, and then review it again. I quickly previewed the TSMC paper in advance of the presentation and I have to say I was very disappointed with the lack of real data in the paper, there were no pitches and most of the results graphs were in normalized units. At the 2017 IEDM conference Intel and GLOBALFOUNDRIES (GF) presented their 10nm (7nm foundry equivalent) and 7nm processes respectively and both companies provided critical pitches and electrical results in real units. You can see my previous write up on these papers here.

I would like to take this opportunity to call on TSMC to provide more transparency with respect to their processes. 

At the press lunch on Monday many of the IEDM session chairs were available and I asked them about this paper and whether they ever push back on companies to provide more data or reject a paper for lacking enough detail. The answer I got back was yes and in fact they turned down a platform paper from another leading logic company this year for lack of data and said they debated whether to let the TSMC paper in. It is a difficult position for the organizers, this is the kind of headline paper that attracts attendees but at the same time the conference must maintain a standard of quality.

In the balance of this article I will discuss what TSMC disclosed and then try to fill in some of the details they didn’t disclose based on my own investigations. I have read the paper, seen the paper presented, and asked the presenter a question at the end of the presentation and discussed this process with a wide range of industry experts.

TSMC’s disclosures
The key bullet points from the TSMC paper and presentation are:

  • Industry leading 5nm process.
  • Full fledged EUV, >10 EUV layers replacing >3 immersion layers each resulting in a reduction in mask count improving cycle time and yield. The paper says >4 immersion layers for each EUV layer but in the presentation the presenter said >3.
  • High mobility channel FETs.
  • 021µm2 high density SRAM.
  • ~1.84x logic density improvement, ~1.35x SRAM density improvement and ~1.3x analog density improvement.
  • Gate contact over diffusion, unique diffusion termination, EUV based gate patterning for logic and SRAM.
  • ~15% speed gain or 30% power reduction.
  • Low resistance and capacitance interconnect with enhanced barrier lines and etch stop layer (ESL) with copper reflow gap fill. The Back-End-Of-Line (BEOL) also features a high resistance resistor for analog use and super high-density Metal-Insulator-Metal (MIM) capacitors
  • 5 and 1.2 volt I/O transistors.
  • True multi-threshold voltage process with 7 threshold voltages over a >250mv range supported and an extreme low Vt transistor 25% faster than the previous generation. Presumably only around 4Vts are available at a time.
  • Passed qualification.
  • High yielding test chip with 256Mb SRAM and CPU/GPU/SOC blocks and D0 ahead of plan with a faster yield ramp than any previous process. 512Mb SRAM has ~80% average yield and >90% peak yield.
  • In risk production now with 1st half 2020 planned high volume production.

Density and pitches
At 7nm Samsung and TSMC have similar process densities. Moving from 7nm to 5nm Samsung has disclosed a 1.33x density improvement and TSMC has disclosed a ~1.84x density improvement. Clearly TSMC will have a far denser process than Samsung and with Intel’s 7nm (5nm foundry equivalent process) not due until 2021, TSMC will have the process density lead in 2020.

In terms of specifics other than an SRAM cell size of 0.021µm2 TSMC didn’t provide any. SRAM density is certainly important for SOC designs where SRAM can often make up over half the device area.

Logic designs are created with standard cells. The height of a standard cell is the Metal 2 Pitch (M2P) multiplied by the track height (TH) and the width is defined by the Contacted Poly Pitch (CPP), cell type and whether the process supports single or double diffusion break. For the TSMC 7FF process M2P is 40nm and the TH is 6. The CPP is specified as 54nm although 57nm is seen in standard cells, however since TSMC stated their density improvement we will assume 54nm as a starting point and the process supports a double diffusion break (DDB). Running these dimensions through the Intel density metric we have discussed before yields 101.85 million transistor/mm2.

I have heard that TSMC is going to use a very aggressive 28nm M2P at 5nm and I also believe they will stay with a 6-track cell. A 5-track cell requires Buried Power Rails (BPR) and TSMC did not disclose that as part of the process, I also believe it is too early to see BPR in a process. I also expect this process to support Single Diffusion Break (SDB), SDB was added with the 7FFP version of TSMC’s 7nm process and I believe they will maintain that. The net result is for a 1.84 density improvement CPP is between 49 and 50nm. If I assume 50nm I get 185.46 MTx/mm2 a 1.82x improvement in density.

Figure 1 presents a 7FF versus 5FF process comparison.

Figure 1. TSMC 5FF Process Density.

EUV usage
As I stated previously, the paper mentions a single EUV layer replaces >4 immersion layers although the presentation revised this to >3 immersion layers. The paper and presentation both report 5nm using >10 EUV layers and that would imply >30 immersion layers will be replaced. This is presumably versus the number of immersion layers required if 5FF were done with multi patterning instead of with EUV.

In the article a graph of mask layers is presented with normalized units where 16FFC is 1.00, 10FF ~1.30, 7FF ~1.44 and 5FF ~1.30. I believe TSMC’s 7FF process is 78 masks and the 5FF is 70 masks. When I use my mask estimates for 16FFC, 10FF, 7FF and 5FF I reproduce the graph from the paper nicely.

I also believe TSMC’s 7FFP process has ~5 EUV masks and 5FF will have ~15 EUV masks.

Another interesting EUV comment, I am hearing Samsung has a very high dose for their EUV process for critical layers and I have heard TSMC’s EUV dose is much lower with TSMC a >2x throughput advantage over Samsung> This is also consistent with reports that Samsung is having trouble getting enough wafers through their EUV tools. At another conference I saw an IBM presentation where they discussed developing the 5nm process with Samsung. They said that they turned up the EUV dose until they got good yield and transferred the process to Samsung with the idea that Samsung would then work on reducing the dose. It sounds like the process may have been rushed into production before reducing the EUV dose.

High mobility channels
I have been expecting for some time that Silicon Germanium (SiGe) High Mobility Channels (HMC) will be introduced at 5nm for pFETs.

When I got the TSMC paper and read through it they talk about HMCs plural and even have a figure that says HMC and show both nFET and pFET results, they further show HBC on silicon with no interface buffer layers. The only answer that fits this in my view would be if TSMC had implemented Germanium channels for both nFET and pFET devices, but I thought that was an advance that wasn’t ready yet. If that were the case this would be similar to Intel introducing High K Metal Gates (HKMG) at 45nm or FinFETs at 22nm.

After the TSMC talk I asked the presenter whether the nFET and pFET devices were both HHC or just the nFET or just the pFET. The presenter responded that only one of the device types had HMC although he wouldn’t say which one. I believe it is almost certain that the pFET is a SiGe channel as expected.

Conclusion
In conclusion TSMC has developed a high density 5nm process that will provide the industries highest process density in 2020 and establishes TSMC as the current leader in logic process technology.


Why is the Press Giving AMD a Free Pass?

Why is the Press Giving AMD a Free Pass?
by Daniel Nenni on 12-16-2019 at 6:00 am

The Intel versus AMD rivalry is legendary amongst us Silicon Valley AARP members and is one of the reasons why the semiconductor industry is as competitive as it is today, absolutely.

AMD’s boisterous corporate culture started with AMD’s co-founder and long time CEO Jerry Sanders. Jerry was the ultimate showman but his credo “People first, products and profit will follow!” really did set AMD up for the success that followed. Jerry also negotiated the second source deal with IBM for the Intel based PC which created the Intel vs AMD rivalry we still enjoy today.

Unfortunately, one of the mantras that Jerry is also famous for “Real men Have Fabs” not only proved to not be true, it was also proved not to be his. Jerry retired in 2000 and AMD has had CEO issues ever since, including today, my opinion.

Over the last 20 years AMD’s corporate culture has changed but engineering hasn’t. AMD still has very strong engineering teams for both CPUs and GPUs. Unfortunately, AMD marketing is well known for outpacing engineering and that still stands today.

A recent example is the UBS interview with Ruth Cotter AMD’s Senior Vice President of Marketing, HR, and IR. Ruth has spent her entire semiconductor career at AMD which is one problem. The other problem is that a semiconductor marketing executive that also heads up human resources and investor relations is just absurd.

The interview was very fluffy as you would expect but there were some key points worth commenting on:

In regards to datacenters: “We’re at about 7% share today Tim, if you look at the IDC TAM of about 20 million units. We also are — it’s our goal over time to get back to the historical levels which was 26%.”

This seems like a pretty low market share considering Intel cannot meet current customer demand, is priced higher, and AMD continues to brag about architectural and roadmap superiority.

In regards to TSMC 7nm vs Intel 10nm: “We’re at 7-nanometer. We have a leadership position there that we’re very pleased about. And we expect to continue to drive that moving forward in partnership with TSMC.”

This is not true of course. Intel 10nm is a better high performance process (tuned for Intel CPUs) than TSMC 7nm. Intel 10nm and TSMC 7nm are equivalent on density though but for CPUs and GPUs performance is key.

In regards to TSMC: “I think given our size, two foundry partners is plenty for us to manage within the supply chain. So we’re very happy with TSMC on the leading edge and GlobalFoundries more on the trailing edge as our customer set. If we were to introduce a third partner into that mix, it would just be too much given our size.”

This is true and for one really big reason. If AMD partners with both TSMC and Samsung they will not be part of TSMC’s trusted inner circle. Leading edge recipe secrets are even more protected now than ever before. If your team is the first to design on TSMC they will not be first to design on Samsung.

Companies can brag all they want about roadmaps, architecture, and process technology but revenue is where the rubber meets the semiconductor highway:

AMD annual revenue for 2016 was $4.319B
AMD annual revenue for 2017 was $5.253B
AMD annual revenue for 2018 was $6.475B
AMD estimated annual revenue for 2019 is $6.7B

While these numbers do not look too bad you must remember that Intel is a $70B+ company with a new CEO, pumped up executive staff, and new purpose.

Bottom line: I’m still not convinced that AMD has crossed the chasm from the single digit “Cheaper than Intel” dig to the double digit “Better than Intel” gold mine, just my opinion of course.


The Tech Week that was December 9th 2019

The Tech Week that was December 9th 2019
by Mark Dyson on 12-15-2019 at 6:00 am

In a week that finally saw some good news in the trade war between US & China, here is a summary of all the key semiconductor and technical news from around the world that you may have missed.

On Friday, US and China announced agreement on the so called phase one agreement, as a result the extra tariffs due to be imposed on S180billion of Chinese goods from Dec 15th will now not be implemented and the tariffs already imposed on $120billion of goods from 1st September have been halved from 15% to 7.5%. This is particularly good news for the semiconductor sector as these tariffs impacted laptops, smartphones and many other electronic goods. For now the 25% tariffs on another $250billion worth of goods will remain in place. In return China has committed to purchase $32billion more farm products and other exports in the next 2 years..

According to Trendforce, foundry revenue in Q4 is due to increase 6% QoQ. TSMC has increased it’s market share by 2.2% since Q3 with 52.7% of the market due to strong demand for it’s advanced nodes. Samsung is second with 17.8% and Globalfoundries third with 8% market share.

November revenue figures for Taiwanse foundries and subcons have been released.  TSMC increased it’s monthly revenue 1.7% in November compared to October, whilst it’s 2 other Taiwan rivals UMC and Vanguard (VIS) saw sequential drops in revenue of 4.8% and 7.6% respectively.

TSMC’s reported November revenue of US$3.6billion, up 1.7% on October and up 9.7% yoy due to strong demand from it’s 7nm technology driven by high-end smartphones, initial 5G deployment and HPC-related applications. For the year to date TSMC has recorded revenue of US$32billion, up 2.7% on the same period a year ago.

UMC reported revenues of US$460million, down 4.8% sequentially but up 20% on a year ago. Despite the drop in November, UMC expects Q4 shipments to be up 10% compared to Q2, reporting sustained demand from new product deployment across communications and computing market segments. For the year to date UMC have recorded revenue of US$4.5billion down 3.6% on the same period a year ago.

Vanguard International Semiconductor (VIS) reported November sales of US$75million, down 7.6% sequentially and down 12.2% on year ago. Shipments were down due to high inventory levels at customers. For the year to date revenue VIS has recorded US$850million down 2.5% for the same period in 2018.

For the Backend assembly test suppliers the ASE ATM group which includes both ASE and SPIL subcons, reported revenues of US$751million, up slightly sequentially and up 7.3% yoy.

Broadcom reported it’s 4th quarter earnings this week. For the full year Broadcom’s revenue was a record US$22.6billion growing 8% despite the trade war however this was mainly due to growth from the software solutions sector. Semiconductor solutions revenue was US$17.4billion for the full year, down 8% YoY.   For Q4, overall revenue was US$5.8billion of which S4.6billion was from semiconductor solutions, this was up 5% QoQ but down 7% YoY. Looking ahead they forecast overall revenue to be US$25billion of which semiconductor solutions will be approx. $18billion.

According to IHS Markit, Samsung has clear lead in the 5G smartphone market holding 74% market share. Samsung is reported to have shipped 3.2million 5G handsets in Q3 2019. In second place was LG with 10% market share having shipped 400,000 units.

To support the expected recovery of the memory segment next year, Samsung is reported to be planning to increase it’s NAND memory capacity at it’s Fab in China. According to reports it is expected to spend $8billion to boost production in China.

Finally, according to research firm IDC, wearable device shipments grew 94.6% in Q3 compared to a year ago. Leading this market is Apple with a 35% market share due to it’s Apple watch and Airpod sales, having shipped 29.5million devices in Q3. 2nd is Xiaomi followed by Samsung and Huawei as smartphone makers dominate this market. The biggest category is earwear which grew 240% yoy, followed by wristband and smartwatch catagories which both grew around 48% yoy.


Useful Skew in Production Flows

Useful Skew in Production Flows
by Tom Dillinger on 12-13-2019 at 6:00 am

The concept of applying useful clock skew to the design of synchronous systems is not new.  To date, the application of this design technique has been somewhat limited, as the related methodologies have been rather ad hoc, to be discussed shortly.  More recently, the ability to leverage useful skew has seen a major improvement, and is now an integral part of production design flows.  This article will briefly review the concept of useful skew, its prior implementation methods, and a significant enhancement in the overall design optimization methodology.

What is useful skew?

The design of a synchronous digital system requires the distribution of a (fundamental) clock signal to state elements within the digital network.  A specific machine state is “captured” by an edge of this clock signal at state element inputs.  Concurrently, the transition to the next machine state is “launched” by a change in the state values through fanout logic paths, to be captured at the next clock edge.  The collection of logic and state elements controlled by this signal is denoted as a clock domain, which may encompass multiple block designs in the overall SoC hierarchy.

Current SoC designs incorporate many separate clock domains associated with unrelated clocks.  The signal interface between domains is thus asynchronous, requiring specific logic circuitry (and electrical analysis) to evaluate the risk of anomalous metastable network behavior.  (Clock domain crossing analysis, or CDC, is applied to the network to ensure the metastable design requirements are observed.)

The subsequent discussion will utilize the simplest of examples – i.e., a single clock frequency with a common capture edge to all state elements, and a clock edge-based launch time.  Advanced SoCs would often include domain designs with:  both rising and falling clock edge-sensitive state elements (with half-cycle timing paths);  reduced clock frequencies by dividing the fundamental clock signal;  and, latch-based synchronous timing where the launch time could be a state element data input transition while the latch clock is transparent.  This discussion does not address clocking considerations common in serial interface communications, unique cases of asynchronous domains with “closely related” clocks – e.g., mesochronous, plesiochronous domains.  This discussion also assumes the clock domain is isochronous, although there may be instantaneous deviations in the clock period at any state element input due to jitter – in other words, there is a single fundamental clock frequency throughout the domain over time.

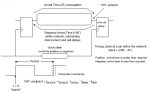
The figure below is the typical timing representation used for a synchronous system.  A clock distribution network is provided on-chip from the clock source (e.g., an external source, an on-chip PLL), through interconnects and buffering circuitry to state elements.

The figure also includes a definition of the late mode timing slack, measured as the difference between the required arrival time and the actual logic path propagation arrival time.

The interconnects present from the clock source and between buffers could consist of a variety of physical topologies – e.g., a (top-level metal) grid, a balanced H-tree, a spine plus balanced branches (aka, a fishbone).  The buffers could be logically inverting or non-inverting signal drivers or simple gating logic with additional enable inputs to suspend the clock propagation for one or more cycles.

The time interval between the clock launch edge and subsequent (next cycle) capture edge is based on the fundamental clock period, adjusted by two factors – jitter and skew.

The jitter represents the cycle-specific variation in the clock period.  It originates from the time-variant conditions at the clock source, such as dynamic voltage and temperature at the PLL circuitry and/or thermal and mechanical noise from the reference crystal.

The skew in the arrival of the launch (cycle n) and capture (cycle n+1) clock edges also defines the time interval for the allowable path delays in the logic network.  The skew is due to a combination of dynamic and static factors.  Dynamic factors include:  voltage and temperature variations in clock buffer circuitry, temperature variations in interconnects, capacitive coupling noise in interconnects.  The static factors include process variation in the buffer circuits and interconnects, plus physical implementation design differences between the clock endpoints.  More precisely, the skew is the difference in clock edge arrival at the two endpoints due to factors past the shared clock distribution to the endpoints, removing the common path from the source.

The time interval for logic path evaluation is the clock period adjusted by the design margins for jitter and (static and dynamic) arrival skew.  From the launching clock edge through the state elements and logic circuit delays, the longest path needs to complete its evaluation prior to the capture edge, accounting for the jitter plus skew margins and the setup data-to-clock constraint of the capture state element.

To accommodate a long timing path, one of the potential optimization solutions would be to intentionally extend the static skew to the capture state element(s) through the physical implementation of the buffer and interconnect distribution differences between launch and capture.  Correspondingly, the time interval for logic path evaluation from the delayed clock to its capture endpoints is reduced.  This is the foundation of applying useful skew.

Traditional Methods

The conventional methodology for timing closure utilizes distinct tools for logic synthesis, construction of the clock physical distribution, and cell netlist placement and routing (adhering to any existing clock implementations).  For synthesis, a set of clock constraints are defined – e.g., period, jitter, max skew implementation targets, distribution latency target from the block clock input to state endpoints.  These targets were applied uniformly throughout the synthesis model (i.e., no arrival skew variation).  Long timing paths were presented to various optimization algorithms focused on logic netlist and interconnect updates – e.g., higher drive strength cell swaps, signal fanout repowering buffer topologies, place-and-route directives to preferentially use metal layers with lower R*C characteristics.  The figure below illustrates some of the potential repowering strategies employed during synthesis.

For state element hold time clock-to-data transition timing tests, the skew target was added to the same clock edge between short launch and capture paths, to ensure sufficient logic path delays and stability of the data input capture.  Algorithms to judiciously add delay padding to short paths not meeting the skew plus hold-time constraint would be invoked.

The timing analysis reports from synthesis provide feedback on the relative success of these (long and short) logic path timing optimizations.  Designs with a large number of failing timing tests were faced with the difficult decision on whether to proceed to the P&R flows with additional physical constraints to try to optimize paths, or to update the microarchitecture.  The introduction of physical synthesis flows improved the estimated timing for the synthesized netlist, but the timing optimizations were still based on uniform clock distribution to logic paths.

In addition to the limited scope of logic path timing optimizations, an additional critical issue has arisen with this methodology.  In a synchronous system, the vast majority of the switching activity occurs in the interval from the clock edge plus a few logic stage delays – thus, the peak power and the dynamic (L * di/dt + I*R) power/ground distribution network voltage drop are both maximized.  For advanced process node designs seeking to aggressively scale the supply voltage (and related cost of power distribution), this dynamic current profile of low-skew synchronous systems is problematic.

Useful Skew in Production

At the recent Synopsys Fusion Compiler technical symposium, several customer presentations described how the incorporation of useful skew into the full synthesis plus physical implementation flows has been extremely productive.

Haroon Gauhar, Principal Engineer at Arm, offered some interesting insights.  He indicated, “The Arm Cortex core architecture contains numerous imbalanced paths, by design.  This enables the timing optimization algorithms in synthesis to apply concurrent clock and data (CCD) assumptions directly during technology netlist mapping.  The corresponding clock tree implementation assumptions become an integral part of the physical design flows.”  Synopsys refers to this strategy as CCD Everywhere.  (“Arm” and “Cortex” are registered trademarks of Arm Limited.)

Haroon continued, “This useful skew strategy is applied to both setup and hold timing tests, in full multi-corner, multi-mode timing analysis.”  Haroon showed an enlightening chart from the Fusion Compiler output data, illustrating the number and magnitude of useful skew clock distribution modifications that were made, both “postponing” and “preponing” clock edges relative to the nominal latency arrival target within the block.

He said, “We evaluate the post-synthesis negative slack timing report data with the CCD postpone and prepone results.  It may still be appropriate to look at microarchitectural changes – the additional postpone/prepone information provides insights into where RTL updates would be the most effective for realizable performance improvements.”

Raghavendra Swami Sadhu, Senior Engineer at Samsung, echoed similar comments in his presentation.  “We have enabled CCD optimizations in our compile_fusion and clock_tree_synthesis flows.  Fine-tuning iterations with CCD may be required to find an optimal balance of useful skew for the goals of both setup and hold timing paths.”

Another presenter at the Fusion Compiler technical symposium offered the following summary, “We are seeing reductions in setup and hold TNS, and thus fewer iterations to close on timing.  There are fewer hold buffers in the design netlist, resulting in better block and die sizes.  For our products, even a small percentage area reduction is of tremendous value.”

Summary

The net takeaway is that the application of useful skew is now available in production flows.  This additional optimization has the potential to guide microarchitectural updates, improve netlist size (less buffering and repowering cells), and reduce design iterations to timing closure.  Dynamic I*R voltage drop issues are reduced, as well.  The figure below illustrates a switching profile based on traditional flows (“baseline”) and for a design incorporating useful skew.

The Synopsys Fusion Compiler platform provides a direct integration of useful skew (CCD) optimizations across the implementation methodology.

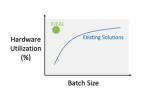
There is a caveat – useful skew is best viewed as another design option in the design optimization toolbox.  Thinking again of the Arm Cortex architecture, the success of this approach relies upon the availability of imbalanced path lengths.  A very useful utility that I have seen deployed is to provide a distribution plot of logic path lengths for a synthesized netlist exported right after logic reductions (e.g., constant propagation, redundancy removal), before any timing-driven algorithms are invoked.  A design with a broad path length distribution would be a good candidate for useful skew.  A design with “all paths at maximum length” (corresponding to the target clock period) or with a bimodal distribution of primarily long paths and very short paths would likely be more problematic – a solution of postpone and prepone skews may not easily converge.

For more insights into useful skew and CCD Everywhere, here are some links to additional information from Synopsys:

CCD Everywhere video — link.

Fusion Compiler home page — link.

-chipguy


Another Smart EDA Merger Adds RF Tools

Another Smart EDA Merger Adds RF Tools
by Daniel Payne on 12-12-2019 at 10:00 am

Cadence acquires AWR

Mergers and acquisitions are just a fact of modern business life, so the semiconductor, IP and EDA industries all can benefit, but only when the two companies have complementary products with some actual synergy. Cadence acquired OrCAD back in 1999, adding a Windows-based PCB tool to their product lineup, and here in 2019 some 20 years later the OrCAD product line continues to live on because it serves a loyal marketing segment.

Cadence recently acquired another Windows-based EDA vendor called AWR, adding RF/Microwave design and analysis tools, but the twist this time is that AWR used to be part of National Instruments.

I spoke by phone with two people at Cadence to understand more about this particular deal:

  • Glen Clark, Corporate Vice President, R&D in the Custom IC & PCB Group
  • Wilbur Luo, Vice President, Product Management in the Custom IC & PCB Group

Eight years ago AWR was acquired by NI for about $58M, and then Cadence acquired AWR for some $160M, so that tells me that this segment is growing in value. AWR users are RF/microwave engineers using EDA tools on IC and PCB for:

This deal helps Cadence build out their portfolio for RF/microwave users on the Windows platform. Typical segments that use these tools include the antenna portion of smart phones, where the goal is to simulate and analyze antennas in software before implementation. Industries like aerospace, military and radar all use AWR tools, and the popular 5G needs analysis.

Cadence does offer Linux-based RF design and analysis, so the AWR tools being Windows-based reach a different set of users, plus AWR tools are being used on III-V technologies like GaAs.

The 3D field solvers for EM analysis now include AXIEM and Clarity. Frequency domain simulations are done with S parameters for PCB and packaging analysis in AXIEM or Clarity, while IC designers would use RC parasitics in a time-based simulation with Clarity. AWR users could start PCB analysis, then move their design over to Allegro for example to complete a project.

The AWR team started out in El Segundo, CA then added sites in Boulder, CO,  WI (3D) and Finland (Circuit simulation). AWR is a pure EDA software vendor, with some services around PDK development.

Expect this deal to be finalized in early Q1 2020, and over time we’ll learn how the AWR group reports into Cadence and if there are any pricing or packaging changes.

Cadence will continue to work closely with NI as part of a strategic system innovation alliance, with reusable testing IP. There’s integration between Cadence Virtuoso and Spectre tools and the data for NI LabVIEW and PXI modular instrumentation systems.

Summary

Just like the OrCAD acquisition made sense for Cadence by adding a Windows-based PCB tool, this new deal adding AWR’s Windows-based RF/microwave tools is a smart move because it’s both complimentary and has synergy.


Autonomous Driving Still Terra Incognita

Autonomous Driving Still Terra Incognita
by Bernard Murphy on 12-12-2019 at 6:00 am

Whither self-driving?

I already posted on one automotive panel at this year’s Arm TechCon. A second I attended was a more open-ended discussion on where we’re really at in autonomous driving. Most of you probably agree we’ve passed the peak of the hype curve and are now into the long slog of trying to connect hope to reality. There are a lot of challenges, not all technical; this panel did a good job (IMHO) of exposing some of the tough questions and acknowledging that answers are still in short supply. I left even more convinced that autonomous driving is still a hard problem needing a lot more investment and a lot more time to work through.

Panelists included Andrew Hopkins (Dir Systems Tech, Arm), Kurt Shuler (VP Mktg, Arteris IP), Martin Duncan (GM of ADAS, ASIC Div at ST) and Hideki Sugimoto (CTO NSITEXE/DENSO). Mike Demler of the Linley group moderated. There was some recap of what we do know about functional safety, with a sobering observation that this field (as understood today) started over a decade ago. Through five generations of improvements we now feel we understand more or less what we’re doing for this quite narrow definition of functional safety. We should keep this in mind as we approach safety for autonomous drive, a much more challenging objective.

That led to the million-dollar question – how do you know what’s good enough? Even at a purely functional safety level there is still anxiety. We’re now mixing IPs designed to meet ASIL levels with IPs designed for mobile phones, built with no concept of safety. Are there disciplined ways to approach this? I heard two viewpoints; certainly safety islands and isolation are important, and modularity and composability are important. However if interactions between subsystems are complex you still need some way to tame that complexity, to be able to analyze and control with high confidence. Safety islands and isolation are a necessary but not sufficient requirement.

In case you’re wondering why we don’t force everything to be designed to meet the highest safety standards, the answer is ROI. Makers of functions in phones have a very healthy market which doesn’t need safety assurance. They’re happy to have those functions also used in self-driving cars but they’re not interested in doubling their development costs (a common expectation for safety standards) in order to serve that currently tiny and very speculative market. And no-one can afford to build this stuff from scratch to meet the new standards.

The hotter question is how safety plays with AI, which is inherently non-deterministic and dependent on training in ways that are still uncharacterized from a safety perspective. ISO 26262 is all about safety in digital and analog functionality; as in much of engineering we know how to characterize components, subsystems and systems, we can define metrics and methods to improve those metrics. We’re much less clear on any of this for AI. The “state-of-the-art” in autonomy today seems to be proof by intimidation – we’ll test over billions of miles of self-driving and that will surely be good enough – won’t it? But how do you measure coverage? How do you know you’re not testing for similar scenarios a billion times over rather than billions of different scenarios? And how do you know that billions of scenarios would be enough for acceptable coverage? Should you really test trillions,  quadrillions, ..  ?

This led on to SOTIF (safety of the intended function) an ISO follow-on to 26262 intended to address safety at the system level. Kurt’s view is that this is more of a philosophical guide rather than a checklist, useful at some level but hardly an engineering benchmark. There’s a new emerging standard from Underwriters Labs (UL) called UL 4600 which as I understand it is primarily a  very disciplined approach to documenting use-cases and the testing done per use-case. That seems like a worthwhile and largely complementary contribution.

Getting back to mechanisms, one very interesting discussion revolved around a growing suspicion that machine learning (ML) alone is not enough for self-driving AI. We already know of a number of problems: non-determinism, the coverage question, spoofing, security issues and issues in diagnosis. Should ML be complemented by other methods? A popular trend in a number of domains is to make more use of statistical techniques. This may sound odd; ML and statistics are very similar in some ways, but they have complementary strengths. For example statistical methods are intrinsically diagnosable.

Another mechanism drawn from classical AI is rule-based systems. Some of you may remember ELIZA, a very early natural language systems based on rules. Driving is to some extent a rules-based activity (following the highway code for example) so could be a useful input. Of course simply following rules isn’t good enough. The highway code doesn’t specify what to do if a pedestrian runs in front of the car, or how to recognize a pedestrian in the first place. But it’s not a bad starting framework. On top of that a practical system needs flexibility to make decisions around situations not seen before, and the ability to learn from mistakes. We should also recognize that complex rulesets may have internal inconsistencies; intelligent systems need to be able to work around these.

The panel closed with a discussion on the explosion in different AI systems and whether this is compounding the problem. The general view was that yes, there are a lot of solutions but (a) that’s a natural part of evolution in this domain, (b) some difference is inevitable between say audio and vision solutions and (c) some will likely be essential between high-end, high-complexity solutions (say vision) and lower complexity solutions (say radar).

All in all, a refreshing and illuminating debate, chasing away some of the confusion shed by the popular pundits.

Circling back to our safety roots, if you’re looking for a clear understanding of ISO 26262 and what it means for chip design teams, a great place to start is the paper, “Fundamentals of Semiconductor ISO 26262 Certification:  People, Process and Product.”


Characteristics of an Efficient Inference Processor

Characteristics of an Efficient Inference Processor
by Tom Dillinger on 12-11-2019 at 10:00 am

The market opportunities for machine learning hardware are becoming more succinct, with the following (rather broad) categories emerging:

  1. Model training:  models are evaluated at the “hyperscale” data center;  utilizing either general purpose processors or specialized hardware, with typical numeric precision of 32-bit floating point for weights/data (fp32)
  2. Data center inference:  user data is evaluated at the data center;  for applications without stringent latency requirements (e.g., minutes, hours, or overnight);  examples include: analytics and recommendation algorithms for e-commerce, facial recognition for social media
  3. inference utilizing an “edge server”:  a derivative of data center inference utilizing plug-in hardware (PCIe) accelerator boards in on-premises servers;  for power efficiency, training models may be downsized to employ “brain” floating point (bfloat16) with a truncated mantissa representation from 23 to 7 bits and the same exponent range as fp32;  more recent offerings include stand-alone servers solely focused on ML inference
  4. inference accelerator hardware integrated into non-server edge systems:  applications commonly focused on models receiving sensor or camera data requiring “real-time” image classification results – e.g., automotive data from cameras/radar/LiDAR, medical imaging data, industrial (robotic) control systems;  much more aggressive power and cost constraints, necessitating unique ML hardware architectures and chip-level integration design;  may invest additional engineering resource to further optimize the training model down to int8 for inference weights and data, accuracy-permitting (or, a network using a larger data representation for a Winograd convolution algorithm)
  5. voice recognition-specific hardware for voice/command recognition:  relatively low computational demand;  extremely cost-sensitive

Hyperscale data center hardware

The hardware opportunities for hyperscale data center training and inference are pretty well-defined, although research in ML model topologies and weights + activation optimization strategies is certainly evolving rapidly.  Performance for hyperscale data center operation is assessed by the overall throughput on large (static) datasets.  Hardware architectures and the related software management are focused on accelerating the evaluation of input data in large batch sizes.

The computational array of MAC’s and activation functions is optimized concurrently with the memory subsystem for evaluation of multiple input samples – i.e., batch >> 1.  For large batch sizes provided to a single network model, the latency associated with loading network weights from memory to the MAC array is less of an issue.  (Somewhat confusingly, the term batch is also applied to the model training phase, in addition to inference of user input samples.  In the case of training, the term batch refers to the number of supervised testcases evaluated and error accumulated before the model weight correction step commences – e.g., the gradient descent evaluations of weight value sensitivities to reduce the error.)

Machine Learning Inference Hardware

The largest market opportunities are for the design of ML accelerator cards and discrete chips for categories (3) and (4) above, due to the breadth of potential applications, both existing and yet to evolve.  What are the characteristics of these inference applications?  What will be the differentiating features of the chip and accelerator boards that are integrated into these products?  For some insight into these questions, I recently spoke with Geoff Tate, CEO at FlexLogix, designers of the InferX X1 machine learning hardware.

Geoff provided a very clear picture, indicating: “The market today for machine learning hardware is mostly in the data center, but that will change.  The number one priority of the product developers seeking to integrate inference model support is the performance of batch=1 input data.  The camera or sensor is providing real-time data at a specific resolution and sampled frame rate.  The inference application requires model output classification to keep up with that data stream.  The throughput measure commonly associated with data center-based inference computation on large datasets doesn’t apply to these applications.  The goal is to achieve high MAC utilization, and thus, high model evaluation performance for batch=1.”

Geoff shared the following graph to highlight this optimization objective for the inference hardware (from Microsoft, Hot Chips 2018).

“What are the constraints and possible tradeoffs these product designers are facing?”, I asked.

Geoff replied, “There are certainly cost and power constraints to address.  A common measure is to reference the performance against these constraints.  For example, product developers are interested in “frames evaluated per second per Watt’ and “frames per second per $’, for a target image resolution in megapixels and a corresponding bit-width resolution per pixel.  There are potential tradeoffs in resolution and performance that are possible.  For example, we are working with a customer pursuing a medical diagnostic imaging application.  A reduced resolution pixel image will increase batch=1 performance, while providing sufficient contrast differentiation to achieve highly accurate inference results.”

I asked, “The inference chip/accelerator architecture is also strongly dependent upon the related memory interface – what are the important criteria that are evaluated for the overall design?”

Geoff replied, “The capacity and bandwidth of the on-die memory and off-die DRAM need to load the network weights and store intermediate data results to enable a high sustained MAC utilization, for representative network models and input data sizes.  For the InferX architecture, we balanced the on-die SRAM memory (and related die cost) and the external DRAM x32 LPDDR4 DRAM interface.”  The figures below illustrate the inference chip specs and performance benchmark results.

“Another tradeoff in accuracy versus performance is that a bfloat16 computation takes two MAC cycles compared to an int8 model.”   

I then asked Geoff, “A machine learning model is typically represented in a high-level language, and optimized for training accuracy.  How does a model developer take this abstract representation and evaluate the corresponding performance on inference hardware?”

He replied, “We provide an analysis tool to customers that compiles their model to out inference hardware and provides detailed performance estimation data – this is truly a critical enabling technology.”  (See the figure below for a screenshot example of the performance estimation tool.)

The FlexLogix InferX X1 performance estimation tool is available now.  Engineering samples of the chip and PCIe accelerator card will be available in Q2’2020.  Additional information on the InferX X1 design is available at this link.

-chipguy


The First Must-Have in 5G

The First Must-Have in 5G
by Bernard Murphy on 12-11-2019 at 6:00 am

Bulk acoustic wave filter

If I was asked about must-have needs for 5G, I’d probably talk about massive MIMO and a lot of exotic parallel DSP processing, also perhaps need for new intelligent approaches to link adaptation and intelligent network slicing in the infrastructure. But there’s something that comes before that all that digital cleverness, in the RF front-end, which has also become pretty exotic. This is the filter(s). These are the devices that pluck out an RF channel of interest from the surrounding radio cacophony and ignore everything else.

Filters at this level look nothing like conventional circuits, either analog or digital. They operate on a piezoelectric substrate; an electric transducer (driven by the input radio signal) at one end stimulates mechanical action and thus an acoustic wave. This travels to the other end where that wave triggers a second transducer, converting the acoustic signal back into an electrical signal.

Might seem like a lot of work to accomplish not very much, however the magic is in managing those acoustic waves. Like a tiny musical instrument, the filter (plus a cavity underneath) has a narrow band of resonant frequencies; everything outside that frequency range is damped into non-existence. And as for musical instruments, the resonance range depends on the mechanical design of the device – dimensions, thicknesses, material and the cavity.

2G, 3G and 4G front-ends have used surface acoustic wave (SAW) filters in which the wave travels along the surface of the device. These are apparently very cost effective but are limited to frequencies below ~2GHz, where filter selectivity begins to decline. This is fine for 3G, on the edge for 4G and not good enough for 5G. That’s pushed a switch to bulk acoustic wave (BAW) filters which can support higher frequencies, at somewhat higher costs.

One reason for that cost may be the complexity of designing such filters. You see, these are really MEMS devices since they’re electromechanical; even though you don’t see anything moving, the acoustic waves are mechanical distortions in the piezoelectric (PE) structure. A typical filter is a thin film of PE between two electrodes, sitting on top of the cavity. I’ve talked before about the challenges in designing MEMS – no pre-characterized cells or nicely defined PDKs from which you can reliably model.

There’s a second problem. Acoustic waves go where they want to go. While a square or rectangular structure might seem like the logical way to build these things, waves can reflect off ends, and can also run in the surface. Either effect may contaminate the ideal bulk behavior. So structures are built with interesting shapes like irregular pentagons (see above), to damp out undesired behaviors. Also it’s common to build networks of resonators, each of which can have a different geometry.

Now you see the problem – electromechanical 3D modeling (because you’re modeling bulk and surface acoustic waves), through strange geometries with little reference data to guide your models. I was told that some of the leading companies producing these filters are still using a design-fab-analyze-correct loop to get to optimized designs. There has been no better way. But it’s still been worth it because the volumes for these devices are huge – one (or more?) in every 5G edge device, including cellphones.

But now there is a better way, and that’s important because that development loop also affects time to market in what are commonly winner-take-all markets (at least per model release). That is to virtually prototype these devices, starting from a custom-characterized PDK.

Which is what the Mentor/Tanner-SoftMEMS-OnScale solution does well. You design the device, layer by layer in Ledit (which incidentally does well at handling strange shapes like irregular pentagons), convert that to a 3D model by adding materials definitions, piezo properties through matrices, thicknesses, process data, mechanical properties and boundary conditions, then model the whole thing, or just a part of it, in the cloud using the scalable FEA analytics from OnScale. Mary Ann (SoftMEMS) told me they can even model a full wafer, looking for behaviors and yield hits around the edges.

Better virtual modeling and better analytics, all the way up to wafer-scale analysis. That should help reduce time-to-market. You can learn more about this flow HERE.


The ESD Alliance Honors Mary Jane Irwin

The ESD Alliance Honors Mary Jane Irwin
by Randy Smith on 12-10-2019 at 10:00 am

The Phil Kaufman Award has been given annually since 1994 to individuals who have had a significant impact on Electronic System Design. I have attended several of the award dinners during that time. Most of the time (roughly 70%), the award recipients were either people I knew or people whose textbooks I had read. The award goes to people of many different contribution areas that have given substantial service to the industry. Award recognition may come for academic and research achievements, or substantial business/organization leadership, or some combination of these activities. In November this year, the award was given to Dr. Mary Jane Irwin. I was happy to be there for that presentation.

Having not met Dr. Irwin before, my interest was piqued to learn about her contributions to the industry. I knew I had heard her name before, but I could not recall in what context that had happened. I now realize that I had heard of Dr. Irwin when she was the Design Automation Conference (DAC) chair in 1999 though she has also been on the DAC Executive Committee for many years. But, as I learned at the award dinner, her contributions are so much more.

On the technical side, Dr. Irwin’s credentials are flawless. Dr. Irwin received her Master of Science and Ph.D. degrees in computer science from the University of Illinois, Urbana-Champaign, and is the recipient of an Honorary Doctorate from Chalmers University in Sweden. Her areas of significant academic contributions include several advances in power analysis and developing VLSI architectures for signal and image processing for the discrete wavelet transform. She has been a prolific writer, authoring or co-authoring more than 200 technical publications. She has received many awards for her papers, as well.


While these are significant contributions, what struck me most at the presentation was Dr. Irwin’s influence and mentorship of others. While the effect may be difficult to measure directly, the scope of her influence on helping others advance the state of the electronic system design industry is abundantly obvious. Dr. Irwin advised more than 25 Ph.D. students. Along with Marie Pistilli, she co-founded the organization now known as Women in Electronic Design. As mentioned before, she has been a significant leader and contributor to DAC for many years. To make even more clear Dr. Irwin’s mentorship of others, we also saw a presentation by Dr. Valeria Bertacco from the University of Michigan. Dr. Bertacco showed many photographs of a seemingly endless list of students that Dr. Irwin has led and inspired to contribute to the electronic system design industry. We should be truly grateful for Mary Jane’s gifts to us from her efforts in electronic system design as it has been expressed through her service to our community.

I should also mention that some credit should be given to Pennsylvania State University. The university has supported Dr. Irwin’s considerable research and her copious number of publications. They gave her a platform to develop unique technology while also developing future contributors to our industry.

For more information on the Kaufman Award, see http://esd-alliance.org/phil-kaufman-award/.