For the last decade, semiconductor industry analysts have been writing articles and giving presentations that predict the increasing consolidation of the industry to the point where a few large companies dominate worldwide sales of semiconductor components. In recent years there has been some justification for this view as the combined market share of the top five companies in the industry has increased, as has the combined market share of the top ten.
The general thesis of these discussions of semiconductor industry consolidation is the widely accepted model of growth and maturation of an industry. Industries like steel, automobiles and others that have propelled decades of economic expansion in the world should grow rapidly in their youth and then slow down as their markets saturate and stabilize. During this period approaching maturation, revenue growth is not large enough to drive increased profit and enterprise value so the focus becomes cost reduction. By becoming more efficient, these mature industries reduce their labor and material costs, acquire competitors to achieve better economies of scale and reduce their research and development expenses since their industry is no longer evolving rapidly and there are fewer opportunities for new product and technology innovations. The acquisition process eventually leads to an oligopoly of a few large surviving companies that can achieve the required economies of scale to prosper despite their slow or declining revenue.
There are at least two problems with this kind of analysis. First, the assumption that industries mature and consolidate down to a few large enterprises may be the exception rather than the rule. Second, the analysis of the semiconductor industry as a candidate for this model in 2016 is probably premature since we’re seeing new growth in revenue and profits and innovation despite the sixty year age of the semiconductor electronics industry.
Consider first the assumption that most industries eventually consolidate.
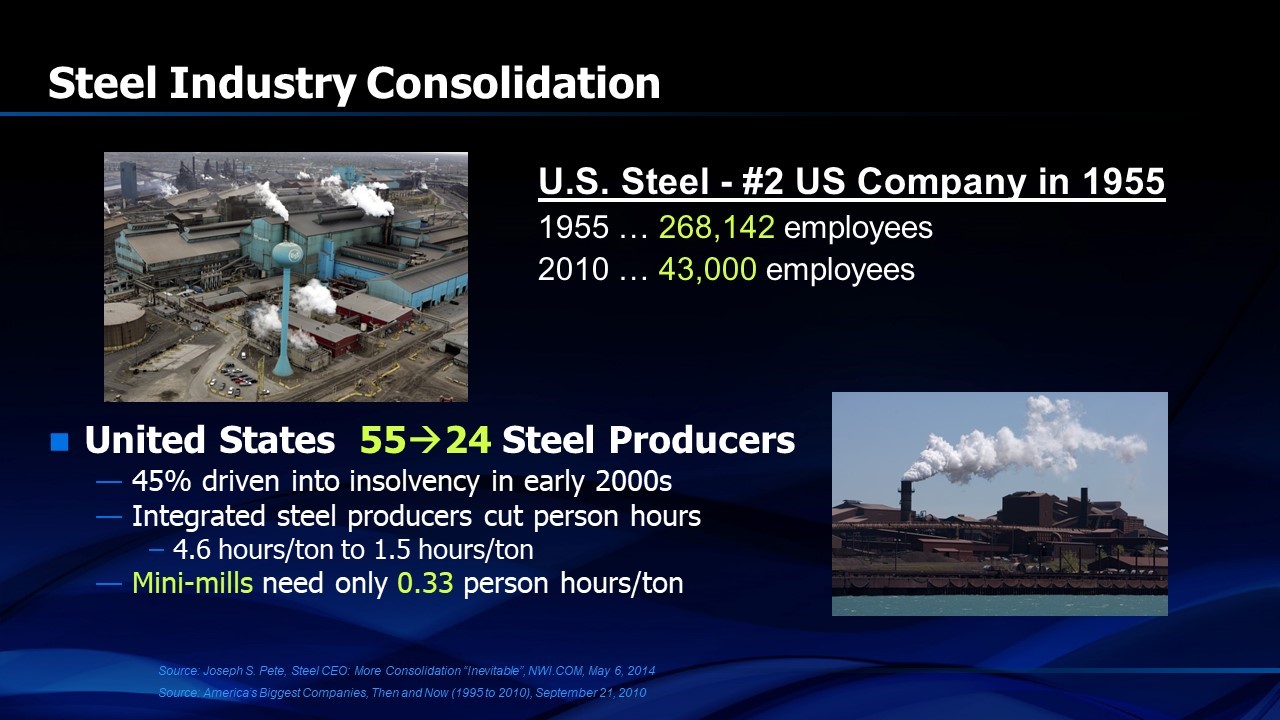
Figure 1. Steel industry consolidation in the U.S.1,2
While consolidation certainly occurred in the U.S. steel industry in the 1960’s and employment has now been reduced by nearly 85%, the number of steel companies was only reduced by 50%. New technology provided by mini mills created a set of new competitors in the industry. Worldwide, consolidation of the steel industry has left us with far more than the classical oligopoly of companies (Figure 2). The five largest steel companies in the world account for only 18% of the revenue of the industry and it takes forty companies to account for half of the worldwide steel production.
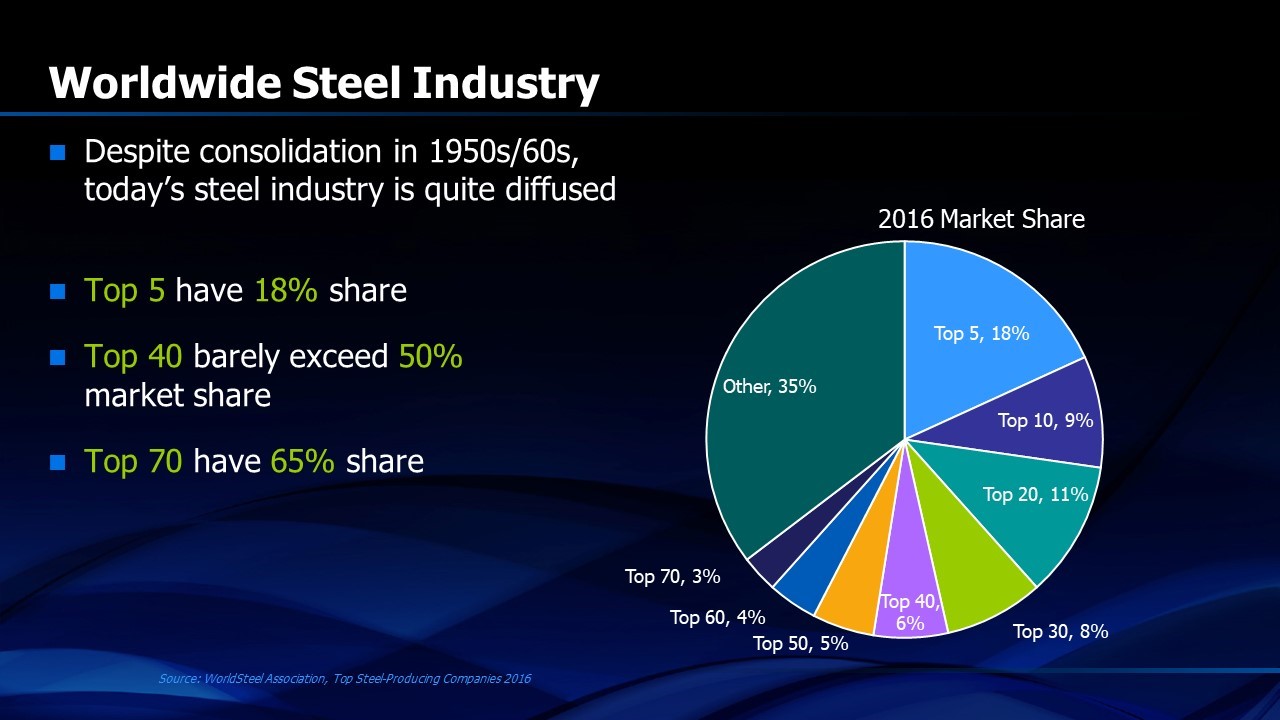
Figure 2. Competitive state of the worldwide steel industry
The case of the automobile industry, though different, also provides insight into the maturation process of industries. Figure 3 shows the growth of the automotive industry, reaching a peak of 272 companies in 1909 and consolidating down to GM, Ford and Chrysler with 91% U.S. market share in the 1960’s. This oligopoly was temporary, however, as foreign manufacturers from Europe, Japan and Korea gained market share in the U.S., passing the combined market share of GM, Ford and Chrysler in 2007. Emergence of electric cars and evolution of technology for driverless cars has stimulated the emergence of over 400 new companies announcing plans to produce electric cars and light trucks in the near future and nearly 200 planning driverless cars.
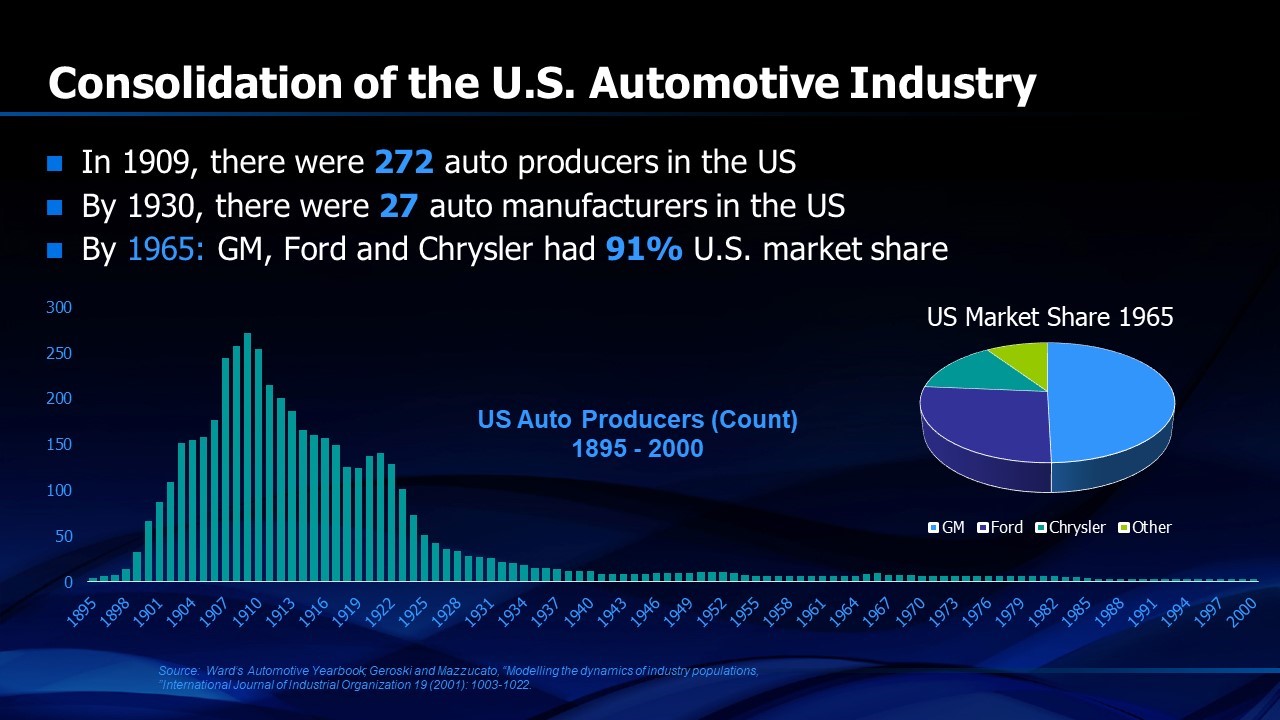
Figure 3. Growth of the automobile industry
Are there any industries that consolidate down to an oligopoly and remain that way? The answer is, “yes, but….”. The well accepted model of consolidation seems to work in industries that operate in relatively free worldwide markets that are largely free of regulatory and tariff barriers and have a low cost of transport so that products can flow easily from one region to another. Two examples of this are the hard disk drive and the dynamic RAM (dynamic random-access memory) businesses.
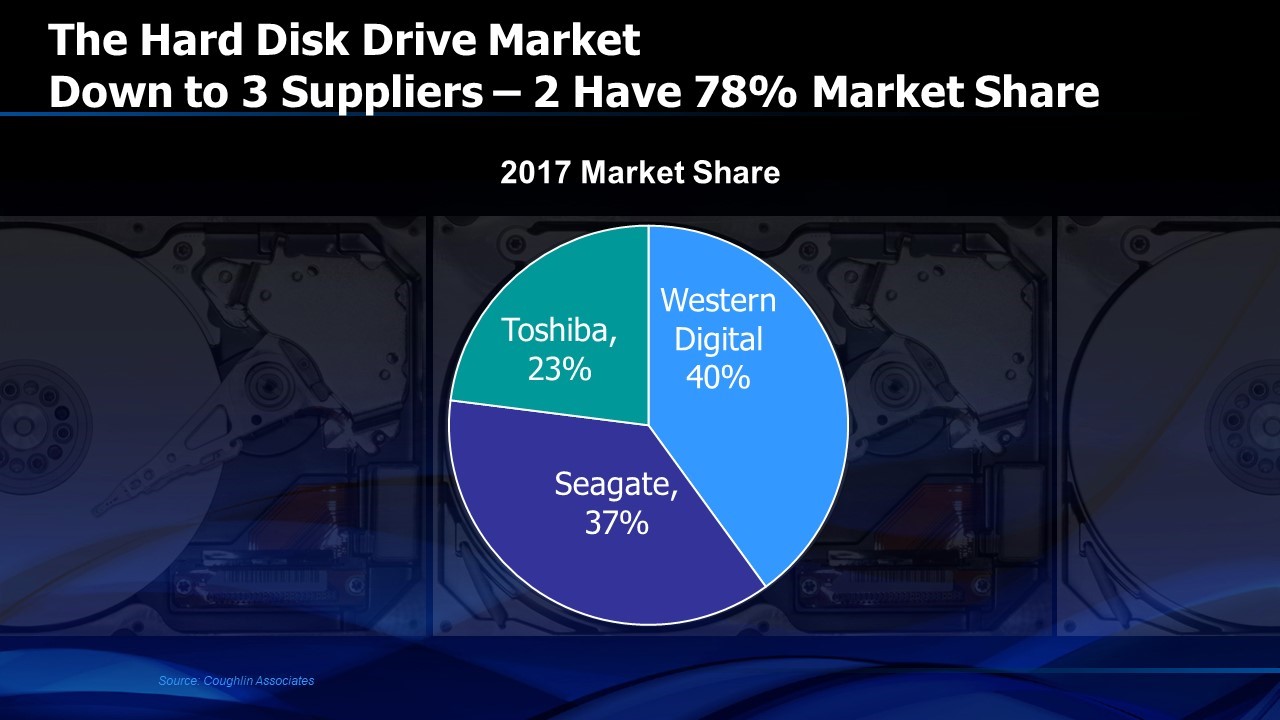
Figure 4. Market shares of the leading hard disk drive manufacturers in 2017
The number of competitor companies in the hard disk drive industry peaked at 85. Figure 4 shows the current state of that industry with three participants controlling almost 100% of the revenue of the industry. But like most industries, technical discontinuities change the game. Emergence of solid-state storage to replace rotating media hard disk drives is changing the market share outlook (Figure 5). Samsung is emerging as the new leader partly because of its leading position in the NAND FLASH component business.
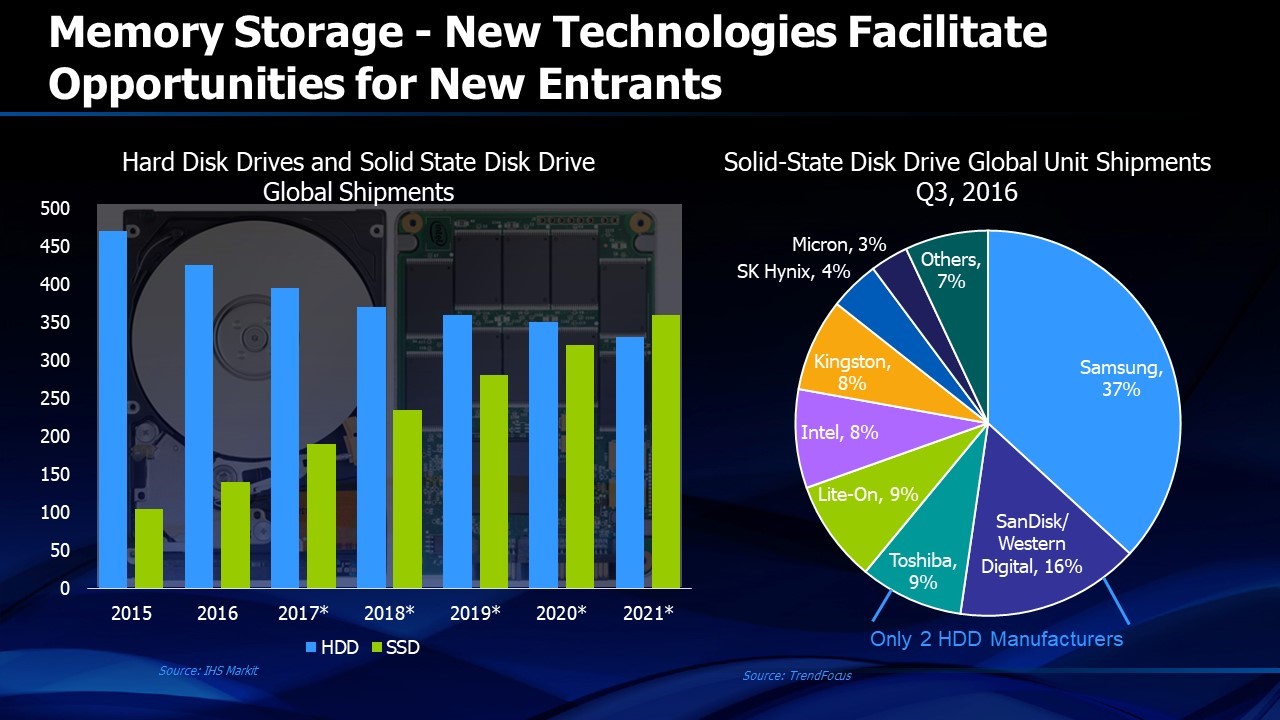
Figure 5. Solid state storage changes the competitive landscape
The other example of the consolidation of an industry is the DRAM business.
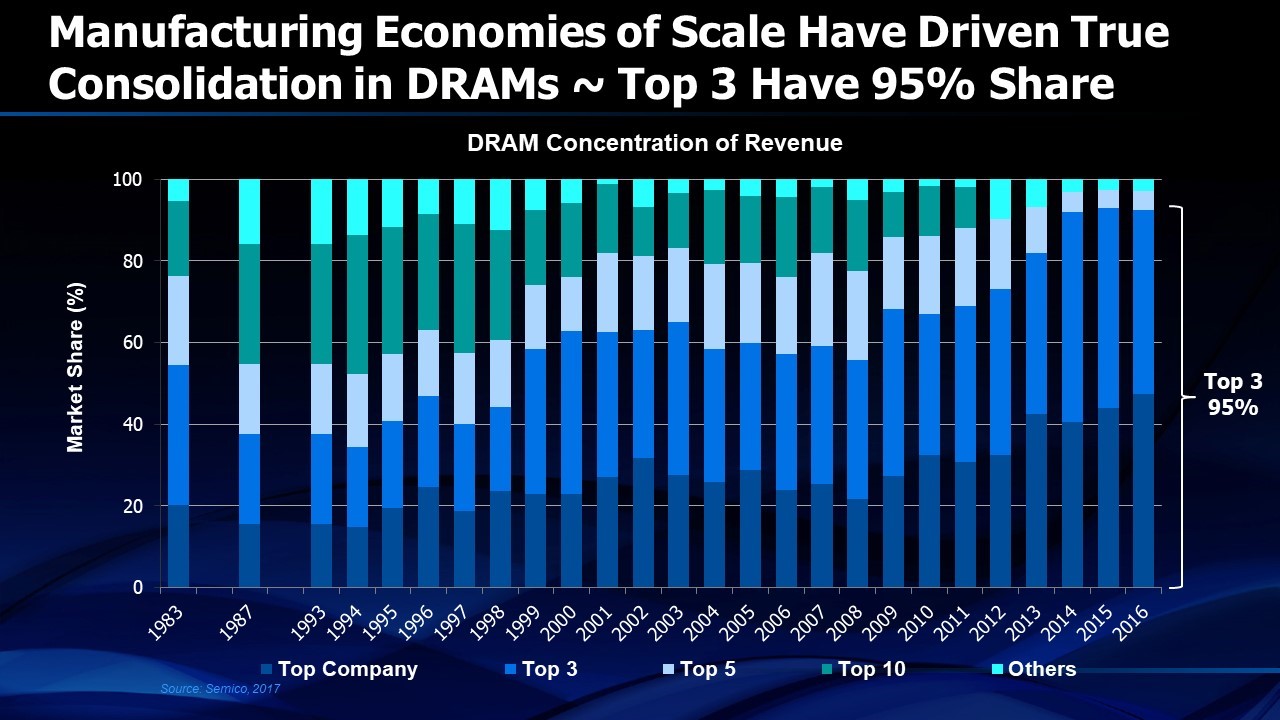
Figure 6. DRAM worldwide market share. Combined share of the three largest companies grew from about 35% in 1994 to 95+% in 2016.
In 1997, the top three producers of dynamic RAM had less than 40% of the market. By 2014, they had 95%. Both DRAMs and hard disk drives satisfy the requirement of low cost of transport. They are also industries that have relatively free market design, production and distribution worldwide.
How does all this relate to the broader semiconductor industry? Will it consolidate down to a dominant few companies and remain there, as the analysts suggest? It’s doubtful, at least for the near term. Let’s look at the history of semiconductor industry consolidation, or more accurately, its “deconsolidation”.
Since 1965, the semiconductor industry has been “deconsolidating” (Figure 7). In 1966, three companies, TI, Fairchild and Motorola, shared about 70% of the total semiconductor market.
![]()
Figure 7. Semiconductor industry deconsolidation from 1965 to 1972
Over the next seven years, that share dropped to 53%, driven by new entrants like National Semiconductor, Intel, AMD, LSI Logic and about 25 more. Over the next 40 years, the market share of the top semiconductor company remained roughly the same, near 15% market share, although the names changed from TI in 1972 to NEC and then to Intel. Combined market shares of the top five and top ten semiconductor companies decreased or remained flat during this period (Figure 8).
![]()
Figure 8. Combined market share of the five and ten largest semiconductor companies
During 2016 through 2018, the combined market share of the top ten semiconductor companies increased modestly, partly due to an unusual increase in DRAM unit prices as well as a very strong computer server market that favored Intel. The most remarkable piece of data is shown in Figure 9. Throughout history, the combined market share of the fifty largest semiconductor companies has been decreasing.
![]()
Figure 9. Combined market share of the fifty largest semiconductor companies from 2003 through 2014
This observation says a lot about the character of the semiconductor industry both now and throughout history. Company leadership in the industry is continuously changing as new technologies emerge and new companies secure the leading market share in these new technologies. Figure 10 shows the top ten ranking of semiconductor companies over a fifty year period. The company names shown in green are ones that have dropped out of the top ten and never reappeared except for NXP. The number of companies that have retired from the top ten is greater than half of all those who have ever been in the top ten. Only Texas Instruments has remained in the top ten throughout the fifty year period and even it is probably destined to drop out as it focuses its business in analog and power and further disengages from the high volume “big digital” chips that constitute, along with memory, so much of the semiconductor revenue today.
It’s difficult for semiconductor companies to reinvent themselves as new growth markets emerge. The large semiconductor companies tend to grow at about the overall semiconductor market average growth rate while the new entrants grow much faster, albeit from a smaller revenue base. Gradually, these small companies climb the ranks on their way to the top ten.
![]()
Figure 10. Top ten semiconductor companies change with time. Companies shown in green fell out of the top ten
Will the wave of merger mania in 2016 and 2017 continue into the future as the semiconductor industry finally matures and consolidates? Surely the competitive advantage of scale will lead to more mergers and a more difficult environment for small companies to compete without the scale of the big ones? The recent slowing of merger activity, although significantly affected by government regulatory disapprovals, suggests that we may not have reached that stage of consolidation (Figure 11). Actual numbers make 2017 and 2018 among the lowest dollar value of major merger years in recent history, both in number and in enterprise value. The recent increase in semiconductor industry revenue growth rate to 22% in 2017 after two years of no growth also suggests that the announcement of industry maturity may have been premature.
![]()
Figure 11. Value of semiconductor industry mergers by year
In the next chapter, we will examine the factors behind the consolidation that has been occurring. A reasonable conclusion would be that the limited amount of consolidation that is occurring in the semiconductor industry is not motivated by size or broad economies of scale but by specialization. Profitability in the semiconductor industry is driven by market share in very specific specialties and the industry is in a transition to increased specialization which is also increasing overall profitability.
2https://247wallst.com/investing/2010/09/21/americas-biggest-companies-then-and-now-1955-to-2010/
Share this post via:


Facing the Quantum Nature of EUV Lithography