

IPnest has released the 9[SUP]th[/SUP] version of the Interface IP Survey, ranking by protocol the IP vendors addressing the Interface segments: USB, PCI Express, (LP)DDRn, MIPI, Ethernet & SerDes, HDMI/DP and SATA. When the 1[SUP]st[/SUP] version has been issued in 2009, the IP segment was weighting $225 million and the 2009 to 2008 growth was negative due to the 2008 economic crisis. The same segment has generated $550 million in 2016!
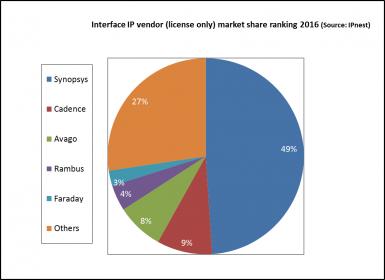
As you can see on the below chart, Synopsys is clearly leading with 49% market share, followed by Cadence and Avago, each company enjoying about 10% market share, Rambus and Faraday ending this top 5 with less than 5% market share. In fact, as the interface IP market is essentially made of up-front license, IPnest has not included royalty in this ranking. If we take royalty into account, Rambus share would grow up to the Cadence level.
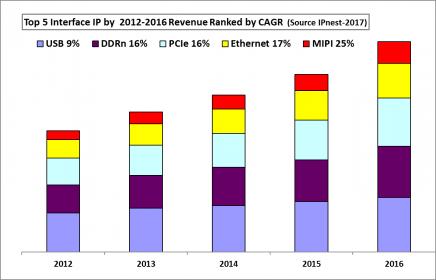
Since the first research, IPnest has built this survey by protocol, offering vendor ranking and competitive analysis for all the above-mentioned protocols. That’s why it’s possible to more precisely monitor the evolution of this dynamic market by protocol and for example compute the CAGR for each of the top 5 protocols: USB, PCIe, (LP)DDRn, MIPI and Ethernet & Very High Speed (VHS) SerDes. This ranking by CAGR appears on the below chart. If you compare USB and MIPI, what you see is that USB IP segment is much larger than MIPI (the smallest of the top 5), but that MIPI IP 25% CAGR is the largest, when USB IP segment has the lowest CAGR with 9%. But USB is, with Ethernet, the oldest protocol, issued in the 1990’s, when MIPI is more recent (mid 2000’s).
In fact, you can find much more information in this report, like the evolution of the number of design starts by protocol, as well as the evaluation of the number of commercial design starts, when a SoC integrates a specific interface IP externally sourced. This methodology allows to build 5 years forecast, that IPnest do every year. Obviously, you need a bit more than Excel to build such a forecast, let’s call it “IP intelligence”. You need to know the market trends for each protocol, the expected pervasion of specific protocol in market segment where it wasn’t used before (like PCI Express in automotive) … that’s why I spend so much time at phone or reading IP related news! But the result is satisfying, and no customer has ever complained about IPnest forecast accuracy, usually in the 5% to 10% range at 5 years at worst. Which is useful when you do the same work for about 10 years is that you can verify at year Y+5 the validity of the forecast made 5 years ago, at year Y…
For example, I can predict today that the Interface IP market will pass the $1 billion mark in 2022, growing at 12% CAGR between 2016 and 2022
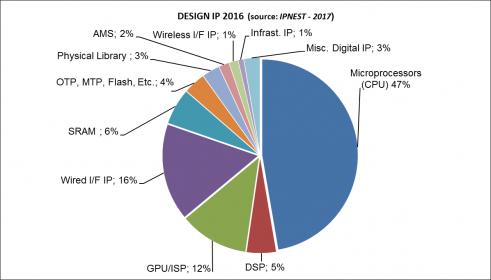
This lead to another interesting point: the relative weight of the Interface IP segment in respect with the total Design IP market. As shown in the “Design IP Report” issued in 2017 by IPnest, the total IP market was $3.423 billion in 2016 and the license part was $1.956 billion. If we compare the license only revenue generated by the interface IP ($530 million) with the total license revenue, the interface IP segment is weighting 27% of the total.
In other words, the (license part) revenues of the interface IP segment is equivalent to the (license part) revenues of the processor IP segment (CPU, GPU and DSP).
But the main difference is that the processor IP segment is generating royalties, and the royalty share of the design IP segment has reached almost $1.5 billion in 2016, or 19% YoY growth!
If you work in a company addressing design IP, you should feel safe about future as this market has grown by 13% last year (9% for license revenues, 19% for royalty revenues). If your company address interface IP, you must know that this segment has grown by 13.5% in 2016 (licenses only), and will grow with 12% CAGR up to 2021.
IPnest has noticed some very interesting points: if Synopsys is the clear leader with 50% market share, this segment is becoming attractive, and different players attack this market. Rambus is well-known for patent licensing, but the company is now repositioning on IP licensing, the Snowbush IP group acquisition is a strong signal sent to the market.
Another group of vendors, the ASIC companies, is becoming very active in the interface IP segment. We can mention Invecas, working closely with GlobalFoundries, who is building a strong interface IP port-folio by acquisitions (Kool Chip, Krivi and Lattice IP group).
Nevertheless, the strongest Synopsys competitor is must probably Broadcom Ltd. (LSI Logic + Avago + Broadcom), even if the company doesn’t position as an IP vendor as they only sell IP like VHS SerDes to their ASIC customers.
If you consider the size of the interface IP market, reaching $950 million in 2021, there should be room for multiple players… but the winners will be the vendors building a strong engineering team, able to manage advanced PHY solutions based on VHS SerDes and supporting PCI Express and Ethernet running at 32 Gbps (PCIe 5.0) and 112 Gbps (PAM 4 SerDes for 100G Ethernet). And also able to address mainstream customers, offering one-stop-shop solutions targeting wide technology node spectrum…
Eric Esteve from IPnest
Just contact me at eric.esteve@ip-nest.com if you need more information about:
– the “Interface IP Survey 2012-2016 – Forecast 2017-2021”
– or the “Design IP Report” 2017


Consolidation and Competition: Who is Winning the $4.5 Billion Interface IP Race?