Verification coverage is a tricky concept. Ideally a definition would measure against how many paths were tested of every possible path through the complete state graph, but that goal is unimaginably out of reach for any typical design. Instead we fall back on proxies for completeness, like hitting every line in the code. This works sufficiently well for dynamic verification (as determined by rarity of escapes) that we have become comfortable in adopting these proxies as our gold standard for completeness.

Initially, coverage wasn’t a big concern in formal verification (FV). FV was sufficiently new and difficult to use that it was most often used to validate isolated and difficult special expectations beyond the reach of dynamic verification. Now FV is becoming mainstream and carrying more of the IP and system verification burden, coverage has become much more important, yet many of us are unsure how we can measure the contribution of this activity to the overall testing effort.
The challenge is to quantify and optimize FV coverage for a design, just as we do for dynamic verification especially mapping to familiar metrics, such as line coverage. Synopsys recently hosted a webinar on this important topic, based naturally on how VC Formal helps in this task.

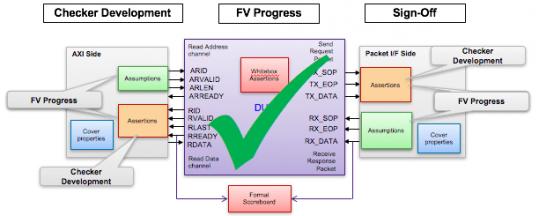
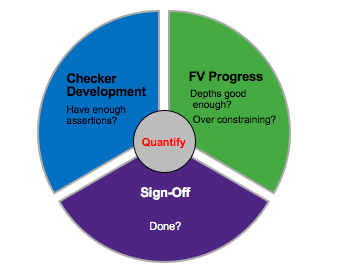
They split the formal coverage objective into 3 phases – checker development, running and refining formal analysis, and signoff. Those phases provide a first-level breakdown of what needs to be quantified. This webinar covered support for the first two phases. Signoff will be covered in an upcoming webinar.
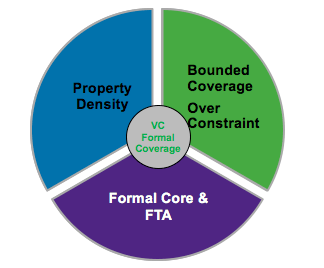
The first phase is concerned with checker density, based on a purely structural analysis of checkers against the design. This looks at both assertions you have created and potential cover properties (which the tool will generate automatically in the next phase). This report provides metrics for properties per line of code and logic cones of influence (COIs) covered by these properties, highlighting registers which do not fall within any of the corresponding COIs. Neither metric is intended as serious coverage; they are provided to guide efficient setup for the second and third phases.
This analysis is simple but fast, as it should be to guide setup before starting long FV runs. It also looks at the effects of abstraction on property density, an important consideration when you’re intending to use that technique to help complete proofs. (Which means that density analysis continues to be useful in the next phase.)

The second step is concerned with quantifying during what Synopsys calls the FV Progress stage – iterative runs to determine assertion correctness and measure coverage, while refining run parameters. As indicated earlier, runs are launched with auto-inferred cover properties; you can set these to line-coverage or other common coverage objectives.
If you’re confused about what a cover property means for formal, I was too, so a quick explanation. In dynamic verification, a cover property is triggered if it’s hit in at least one test. Formal analysis is exhaustive so coverage determines instead whether the property is reachable. If not reachable it’s excluded from coverage metrics (but see later). If it is reachable, you expect it to be covered in dynamic analysis. VC Formal with Verdi coverage debug can import dynamic coverage into your FV coverage analysis; if you have a hole in coverage but FV shows the cover property is reachable, you can look at auto-generated waveforms to show how to get there in dynamic analysis.
The integration with Verdi looks like a strong feature of this solution and should be a real aid to communication between formal and dynamic teams. Getting back to FV, this is also where you start seeing formal coverage metrics, for the design as a whole, and hierarchically decomposed. As you work through runs and analysis, you’re going to find assertions proved (mission accomplished), or disproved (time to start debug). You may find some properties unreachable; if unconstrained these can be excluded from formal and dynamic coverage metrics.
In cases where your constraints make a property unreachable, the Verdi interface aids review of the reduced set of constraints leading to unreachability, so you can understand the root cause. At that point, you’re going to have to use design judgment. Are those constraints representative of realistic operation limits or were they heavy-handed attempts to get a run to complete? If the latter, you can refine and re-run until you get a satisfactory result. Or maybe you have to consider abstraction or a discussion with the software team (ensure the driver doesn’t allow that situation).
The other big challenge in getting to formal coverage is inconclusive results. There’s no definitive way to make this problem go away in formal analysis (thanks to Alan Turing), so the VC Formal solution provides ways to help you increase confidence where feasible. Here you can run bounded coverage analysis to see where and at what sequential depth analysis stops. The tool provides hints on where re-running with modestly increased depth might lead to a conclusive result. Or you might choose to abstract or constrain to get to a result. Again, these are matters of design judgement.
Coverage analysis is fundamental to any production functional verification. This webinar offers a good starting point to understand how you can systematically get to quality coverage metrics in FV. The webinar is well-worth viewing, for these ideas and to understand the nice integration with Verdi. Watch out also for the upcoming webinar on the FV signoff phase.
Share this post via:


Comments
There are no comments yet.
You must register or log in to view/post comments.