The relentless pursuit for maximizing performance in semiconductor development is now matched by the crucial need to minimize energy consumption.
Traditional simulation-based power analysis methods face insurmountable challenges to accurately capture complex designs activities in real-world scenarios. As the scale of modern SoC designs explodes, a new pre-silicon dynamic power analysis methodology is essential. This approach should center on executing representative real-world software workloads.
Power Consumption: Static vs Dynamic Power Analysis
Two primary factors contribute to energy dissipation in semiconductors: static power consumption and dynamic power dissipation. While both are grounded in physics concerning dimensions, voltages, currents, and parasitic elements (resistance and capacitance, or RC), static power consumption remains largely unaffected by the type and duration of the software workload, except for power management firmware that shuts down power islands. Conversely, dynamic power dissipation is heavily dependent on these workload attributes.
Understanding that the dynamic power dissipated by a circuit scales with the logical transitions occurring during its operation, it becomes crucial to accurately capture its switching activity in order to achieve precise power analysis and optimize power dissipation for a design.
Average And Peak Power Analysis
Recording the switching activity as toggle count data, without correlating it with corresponding time intervals, restricts the analysis to average power consumption over the operational time window. Typically, the switching data is cumulatively recorded throughout an entire run in a file format called the switching activity interchange format (SAIF). The size of the SAIF file remains constant irrespective of the duration of the run but grows with the design complexity (i.e. the number of nets in the design).
Capturing time-based and cycle-by-cycle information, namely, full activity waveforms, allows for calculating power consumption as a function of time during device operation. Signal transitions along their associated timestamps are typically recorded for the entire run in a signal database, traditionally stored in the industry standard FSDB (Fast Signal DataBase) format. Today this format is no longer adequate due to the considerable size of the switching file, which escalates with longer runs, potentially reaching terabytes for extended runs spanning billions of cycles. More efficient methods utilize the native output format directly provided by the emulator.
Accurate Power Analysis: Design Hierarchy Dependency
The accuracy of the switching activity is contingent upon the level of design details accessible during the recording session. As the design description evolves from high level of abstraction in the early stages of the development to the Register Transfer level (RTL), gate level and, eventually, down to the transistor level, increasingly detailed design information becomes accessible.
The accuracy of power estimation varies across different levels of abstraction in semiconductor design. At the transistor level, the accuracy is typically within 1% of the actual power dissipation of the silicon chip. This decreases to approximately 2 to 5% at the gate level, around 15 to 20% at the RTL (Register Transfer Level), and ranges from 20% to 30% at the architectural level. However, higher levels of abstraction offer faster turnaround time (TAT) and empower designers to make influential decisions that affect power consumption.
The accuracy vs. TAT tradeoff poses a challenge to designers., At the architectural level, designers enjoy the greatest flexibility to compare multiple architectures, explore various design scenarios, perform power trade-offs, and achieve optimal power optimizations. Instead, at the gate level where accuracy is higher, there is limited flexibility for significant optimizations beyond marginal improvement. The RTL strikes the optimal compromise, providing sufficient details for accurate power consumption analysis while retaining enough flexibility for substantial power optimizations. Moreover, it’s at the RTL where software and hardware converge in the design flow for the first time, enabling engineers to explore optimizations in both domains. Software drivers, in particular, can profoundly impact the power characteristics of the overall design.
Accurate Power Analysis: Design Activity Dependency
Dynamic power consumption depends heavily on the design activity, which can be stimulated using various techniques. These may include external stimuli applied to its primary inputs or the execution of software workloads by embedded processors within the device under test (DUT). Software workloads encompass booting an operating system, executing drivers, running entire applications such as computationally intensive industry benchmarks, and performing tests/diagnostics.
According to Tom’s Hardware, the improvements to idle power usage on Radeon RX 7800 XT and 7700 XT GPUs are massive – with the 7800 XT dropping from 33W to 12.9W and the 7700 XT dropping from 27.5W to 12W.[1]
Stimulus in the form of synthetic tests as used in functional verification testbenches fail to exercise the design to the extent necessary to toggle most of its fabric. This level of activation can only be achieved through the execution of realistic workloads.
Meeting Dynamic Power Analysis Challenges with Hardware Emulation
Verification engines such as software simulators, while effective for recording switching activity, are limited by execution speed, greatly dependent on design size and stimulus duration. Attempting to boot Android OS via an HDL simulator may take years, rendering it unfeasible.
To overcome these limitations and still capture detailed toggle data, hardware emulators emerge as the superior choice. They can complete such demanding tasks within a reasonable timeframe.
Hardware emulators operate at six or more orders of magnitude faster than logic simulators. However, executing even a few seconds of real-time operations on an emulated design can amount to billions of cycles, taking several hours at emulation speed of few megahertz.
Rather than relying solely on sheer computational power, adopting a divide and conquer approach proves to be more effective and efficient. The primary objective remains ensuring that both the average and peak power consumption levels adhere to the specified power budget outlined in the design requirements. In the event of a breach of the power budget, it is essential to swiftly and easily identify the underlying cause.
Performing Power Analysis with a Three-Step Methodology
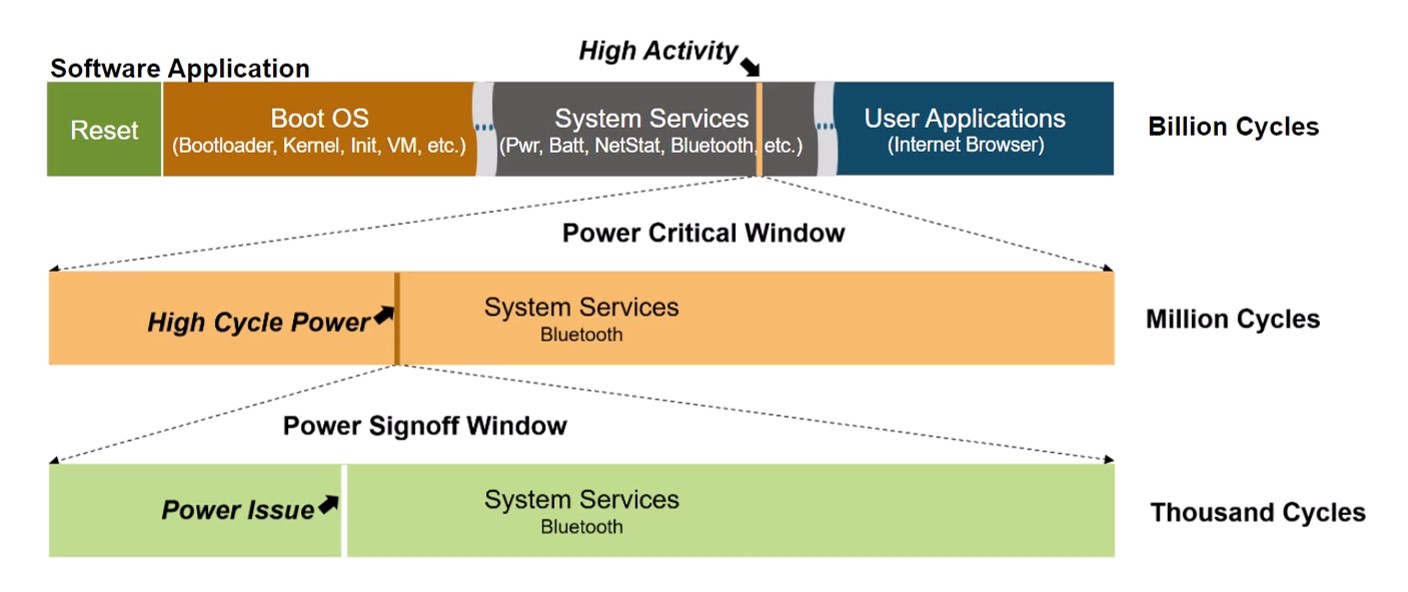
A best-in-class hardware emulator can accomplish the task in three steps. See figure 1.

Step One
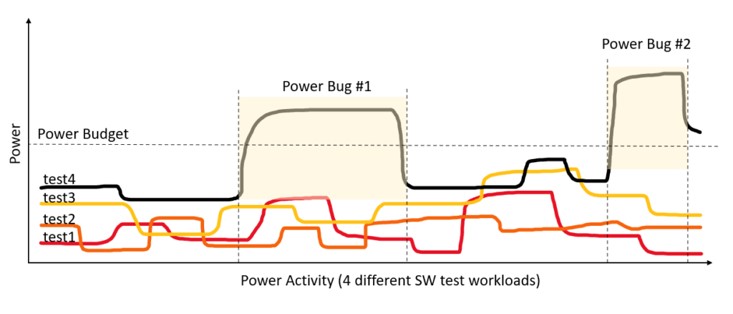
In step one, a power model based on the RTL design is generated and executed on the emulator for the entire run of multi-billion cycles. The emulator conducts activity-based calculations and produces a weighted activity profile (WAP), i.e., a time-based graph that is a proxy for power. See example in figure 2.

By visually inspecting the WAP, users can identify areas of interest for analysis, pinpointing time windows of few million cycles with exceedingly high activity, which may indicate opportunities for optimization or reveal potential power bugs.
Step Two
In step two, the emulator runs through that time window of few million cycles and genrates a signal activity database. Subsequently, a special-purpose massively parallel power analysis engine is used to compute power and generate the power waveform. Worth mentioning, a “save&restore” capability may accelerate the process by resuming from the closest checkpoint to the time window under investigation. In this step, a fast power calculation engine is required to achieve turn-around times of less than a day for tens of millions of cycles. Its accuracy should falls in the range of 3% to 5% of power signoff analysis to facilitate informed decision-making regarding actual power issues. Additionally, a secondary inspection of the power profile graph within the few million cycles time window aids users to pinpoint a narrower time window of few thousands cycles around the power issue.
Step Three
In the final step 3, the emulator processes the narrower time window of few thousands cycles and generates an FSDB waveform database to be fed to into a power sign-off tool to output highly accurate average and peak power data.
In each successive step, users progressively zoom in by approximately a factor of a thousand, narrowing down from billions to millions, and finally down to thousands of cycle ranges.
The three-step process allows for the discovery of elusive power issues, akin to finding the proverbial needle in the haystack.
Taking it further: Power Regression
The fast execution speed of leading-edge hardware emulators and massively parallel power analysis engines enable efficient power regression testing with real-world workloads. This capability greatly enhances pre-silicon verification/validation by promptly identifying and removing power-related issues before they manifest in silicon.
Typically, each new netlist release of a DUT can undergo rapid assessment to certify compliance with power budgets. Running power regressions on a regular basis ensure consistent achievement of power targets.
Viewing inside: Virtual Power Scope
Performing post-silicon power testing on a lab testbench presents challenges because of limited visibility into the design. Despite operating at gigahertz speeds, test equipment typically samples power data at a much lower rate, often in the kilohertz range. This results in sparse power measurements, capturing only one power value per million cycles. Moreover, unless the chip was specifically designed with separate supply pins per block, obtaining block-by-block power data via silicon measurements proves exceedingly difficult. Frequently, only a chip-level power trace is available.
Pre-silicon power validation conducted through hardware emulation and massively parallel power analysis acts as a virtual power scope. It enables tracing and measurement of power throughout the design hierarchy, ensuring adherence to target specifications. This analysis can delve down to the individual cell level, accurately evaluating the power consumption of each block and component within the design. Essentially, it functions akin to a silicon scope, providing insight into the distribution of power within the chip.
Expanding beyond lab analysis: IR Drop Testing
The ability to compute power on a per-cycle basis makes it possible to detect narrow windows, spanning 10 or 20 cycles, where sudden power spikes may occur. Such occurrences often elude detection in a lab environment.
These intervals can undergo analysis using IR (where I is current and R is resistance) drop tools. These tools assess IR drop across the entire SoC within a range typically spanning 10 to 50 cycles of switching activity data.
Achieving optimization sooner, with greater precision: SW Optimization
By aligning the software view of the code running on a processor core with a power graph, it becomes feasible to debug hardware and software concurrently using waveforms.
The connection between these tools is the C debugger operating on a post-emulation trace against a set of waveform dumps. Although these waveform dumps are generated by the emulator, they can encompass various types of waveforms, including those related to power.
Conclusion
Accurately analyzing dynamic power consumption in modern SoC chips at every development stage is crucial. This proactive approach ensures adherence to the power consumption standards of the intended target device, thereby averting costly re-spins.
To achieve realistic results and avoid potential power issues, the DUT, potentially encompassing billions of gates, must undergo testing with real-world software workloads that require billions of cycles. This formidable task is achievable solely through hardware emulation and massively parallel power analysis.
—
SIDEBAR
The methodology presented in this article has been successfully deployed by SiMa.ai, an IDC innovation startup for AI/ML at the edge. SiMa.ai used the Synopsys’ ZeBu emulation and ZeBu Empower power analysis solution.

Lauro Rizzatti has over three decades of experience within the Electronic Design Automation (EDA) and Automatic Test Equipment (ATE) industries on a global scale. His roles encompass product marketing, technical marketing, and engineering, including management positions. Presently, Rizzatti serves as a hardware-assisted verification (HAV) consultant. Rizzatti has published numerous articles and technical papers in industry publications. He holds a doctorate in Electronic Engineering from the Universita` degli Studi di Trieste in Italy.
[1] AMD’s latest GPU driver updates the UI for HYPR-RX and the new power-saving HYPR-RX Eco (tweaktown.com))
Also Read:
Synopsys Design IP for Modern SoCs and Multi-Die Systems
Synopsys Presents AI-Fueled Innovation at SNUG 2024
Scaling Data Center Infrastructure for the Terabit Era
Share this post via:


Comments
There are no comments yet.
You must register or log in to view/post comments.