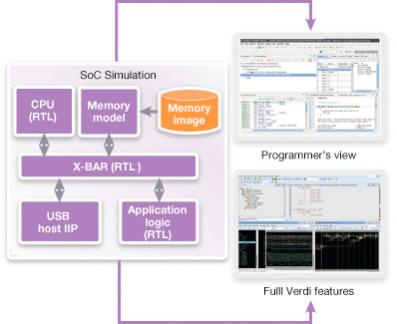
 One of the big challenges with modern SoCs is that they have a complex software component as well as the hardware itself being complex. Some aspects of the hardware can be debugged independently of the software and vice versa, but often it is not immediately clear whether the source of a problem is hardware, software or some interaction of the two. A further complication is that typically the software engineers and the hardware designers are not the same people, often not even the same team (depending on whether the company is organized functionally or by project). But problems that span the hardware/software divide still need to be debugged.
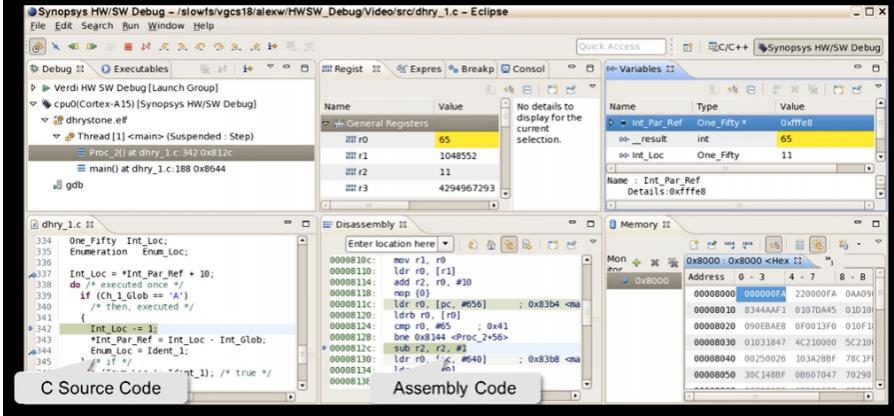
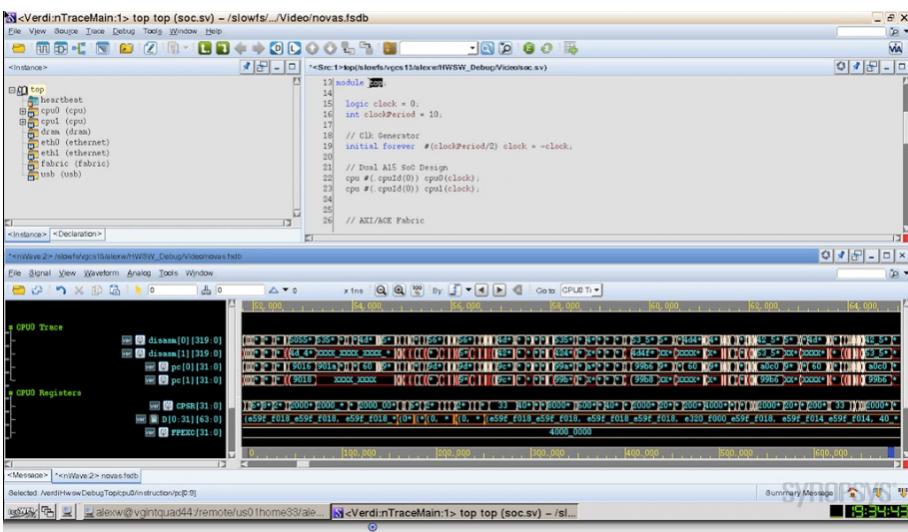
What is needed is a hybrid tool that consists of a software programmer’s view of the world, synchronized with a hardware view of the world. The programmer wants to see things like C-code, assembly code, variable values, register contents and so on. In a multi-core design then it gets even more complex since each core has its own set of values. At the same time the designer wants to see waveforms, RTL, assertions and all the other familiar features of Verdi debug. But both views need to be synchronized in time. If you single step a C instruction, the appropriate point on the waveforms needs to be indicated. Or if you see something suspicious in the waveforms, the appropriate code needs to be shown along with the other aspects of the processor state.
Verdi[SUP]3[/SUP] from Synopsys is just such a tool. It shows simultaneous hardware and software views and enables a trace to be stepped forward and backwards to home in on problem areas with everything kept in lock step so you can seamlessly go between the two views of the design.
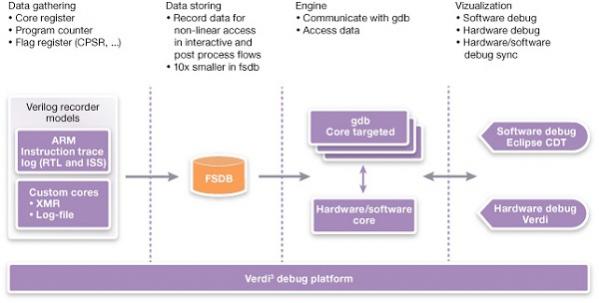
Note that this is not a sort of virtual platform. The simulation is run and all the trace data is captured in FSDB as in a normal (hardware only) Verdi run. The Verdi hardware/software debug, which has gdb under the hood on the software side, can then be used to inspect what is going on. Without a tool like this, it is almost impossible to associate particular places in the waveform with the actual instructions being executed. In a mult-core environment, where several cores are often executing code simultaneously it is even more complex. See the picture above.
The key features of the product are:
- Complete software debug views including
- Registers view
- Call stack view
- Variables view
- Memory view
- Fully synchronized hardware and software views: Jumping in any context in full simulation time range
- Forward, backward
- Statement in C, assembly source code
- Waveform value changes
- Selected simulation time
- Supports breakpoint setting in C, assembly
- Support simultaneous debug of multiple cores
- Support several families of ARM cores as well as custom or proprietary cores
The hardware and software views are shown below. Or they can be mixed with some aspects of software and some of the hardware all on the same screen.
Alex Wakefield, a principal engineer at Synopsys, has a short video including a demo of Verdi hardware/software debug. It is about 7 minutes long.
The video on Verdi hardware/software debug is here.
More articles by Paul McLellan…


Comments
0 Replies to “Hardware/Software Debug”
You must register or log in to view/post comments.