
Next up in this series on modulated signals is an example of multi-dimensional EM design challenges: RF power amplifiers (PAs). Digital pre-distortion (DPD) is a favorite technique for linearizing PA performance. Static effects are easy to model and correct, but PAs are notorious for interrelated dynamic effects spoiling EVM and other key metrics. In a shift left, unlocking PA design with predictive DPD transforms how PA manufacturers design for applications. When designers know what to expect, PA manufacturers win more RF system designs faster.
Basics of DPD applied to PAs
Complex waveforms spanning wide bandwidths stress PA designs. Communications “rogue waves” show up with sudden high-power peaks. Under extreme peak-to-average power ratio (PAPR) conditions, balancing requirements for PA energy efficiency, signal quality, and output power level becomes difficult. Performance degrades, PA instability can develop, and sharp signal peaks can create interference affecting more users.
Critical performance metrics like in-band EVM (error vector magnitude) and out-of-band ACLR (adjacent-channel leakage ratio) are first to suffer these signal peaks. EVM reflects how well transmitted symbols match their intended spot in a QAM constellation – see the example for 16-QAM below. If points are closer together than they should be, accurate discrimination between adjacent points gets tougher. For example, 5G EVM specs allow no more than 3.5% total error for 256-QAM modulation in sub-6 GHz systems.

Designers have two fundamental choices. One is backing off to a lower output power, which eases non-linearity. The other is running at higher power levels but compensating for PA non-linearity. DPD is a preferred compensation technique because of its digital flexibility, often included within baseband ASICs or FPGA co-processors. From non-linearity measurements an inverse response is created, linearizing the PA output when the pre-distorter is cascaded in front of it. The magic of DPD is fitting a precise curve. With higher order polynomial representations and more weighting coefficients, the response can be tuned.

Dynamic effects weigh in on applications
Assuming one has good non-linearity measurements and a grip on linear algebra, amplifier linearization has mostly been a solvable problem. Historically, PAs were designed, built, then characterized in a lab with pure sine waves. An RF system designer picked up the PA manufacturer’s datasheet, which probably included a PA frequency response curve, then determined how to best fit it in their application.
That was before wideband complex modulated signals became common in RF systems. Hitting difficult specs like EVM suggests designing a DPD-PA combination tuned for a specific waveform. But wireless systems have different complex waveforms. A DPD-PA combo that performs well in one wireless application may hurt EVM performance in others.
Worse still, one DPD-PA implementation may not even hold up in the same application under different conditions. Dynamic interactions between waveform-related effects and operating point-related effects take hold, changing PA performance. Troublesome factors like charge trapping and self-heating, hard to reproduce in physical test setups, create “memory” effects.
Authentic waveforms change the PA design workflow
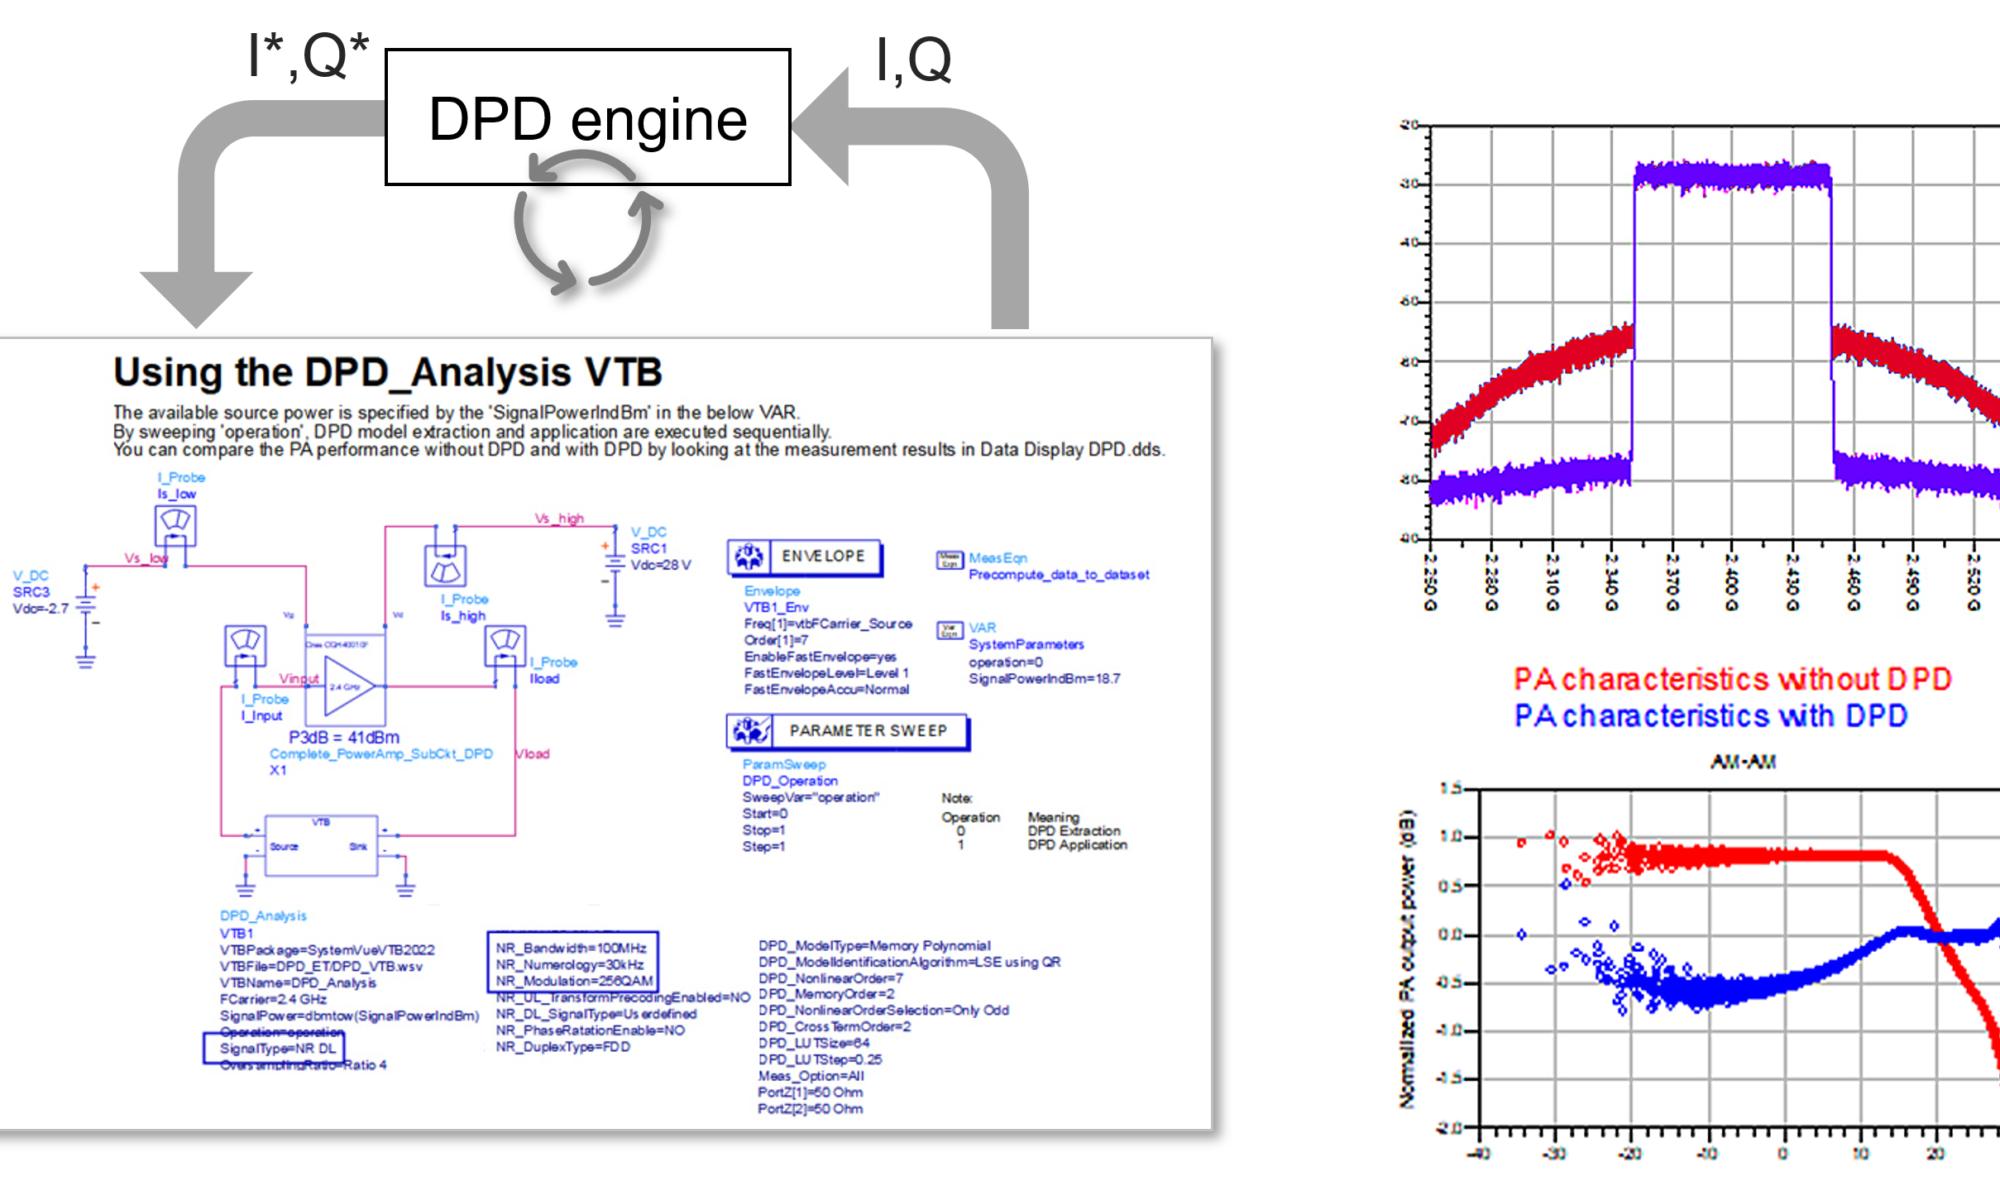
If we know a PA is going into a 5G, Wi-Fi 7, or similar design with complex modulated signals, and we know non-linearity shows up at high PAPR and crushes EVM, why is it left to RF system integrators to solve, after the fact? Today, we have authentic signals – often from the system specification. We can measure PA non-linearity and derive DPD. In fact, we can explore PA performance for an intended application in virtual space applying predictive DPD as a design tool, then characterize designs in context before shipping them. The physical measurement science looks like this:

A vector signal generator (VSG) fires up an ideal waveform to start. A vector signal analyzer (VSA) measures EVM and other system performance metrics, and iterates the DPD response automatically, adjusting the authentic waveform stimulus. This completely isolates a PA device under test – effects from fixturing and instrumentation are nulled out, leaving the exact PA response in results.
Now bring this concept to virtual space. In Keysight PathWave System Design or PathWave ADS, behavioral models account for detailed real-world effects – non-linearity, memory, bandwidth variations, harmonics, thermal, and more. Every variable can be swept, making hard-to-reproduce effects easier to see in virtual space. Authentic waveforms come from Keysight libraries for 5G, Bluetooth, Wi-Fi, GNSS/GPS, and other systems. With the PA design virtually modeled, the PathWave VTB Engine handles the virtual predictive DPD block.

Steps like compact test signals and fast envelope simulation provide control speed and detail. Instead of a big-bang simulation at the end as a verification step, simulating EVM contours against a parametric scan provides rapid results. Incremental PA design changes address those difficult optimizations for efficiency, signal quality, and output power – in virtual space, before committing to PA hardware.
See what a PA customer sees before they see it
With authentic waveforms and measurements factored into virtual models and simulations, PA manufacturers can evaluate their designs under their customer’s conditions. RF system designers know exactly what they can expect from a PA in their application. Plus, they might be able to borrow the transportable model for their RF system modeling and simulation. This doesn’t mean there must be PAs optimized for each waveform, or that DPD isn’t required to fine-tune a physical RF system design. What it does mean is RF system designers have higher confidence when they select a PA for their application that it will deliver system-level results for them – and that translates to more design wins for the PA manufacturer.
Shifting from thinking of DPD as an after-market product to unlocking PA design with predictive DPD is a straightforward workflow change with a big payoff. Teams don’t need to be experts in DPD theory or implementation to leverage Keysight tools for better results. For more on DPD as a design tool for PAs, see this Keysight video on Practical Power Amplifier Design.
Also read:
Shift left gets a modulated signal makeover
WEBINARS: Board-Level EM Simulation Reduces Late Respin Drama
Share this post via:


Comments
There are no comments yet.
You must register or log in to view/post comments.