After reading previous SemiWiki coverage on Dassault Systèmes and their ENOVIA Pinpoint solution, one big item seemed missing: how does this thing actually work? With all due respect to our other bloggers who covered when Dassault Systèmes acquired Pinpoint from Tuscany Design Automation, why Qualcomm is using Pinpoint, and what it does for SoC timing closure, I thought it’d be good to take a step back to how Pinpoint fits into a development scenario, and then look at new capability in the latest release.
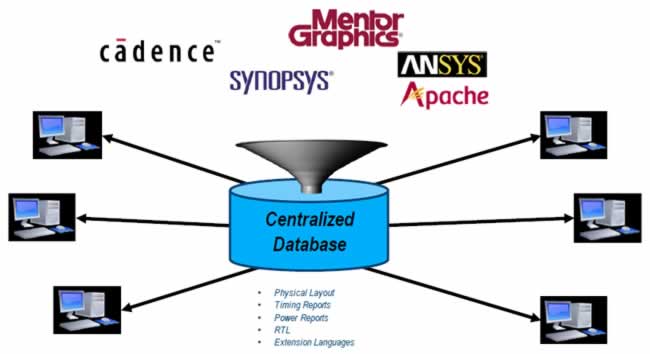
There’s a concept in IT circles called ETL – extract, transform, and load. In a big organization there are often a lot of data sources, some of them in brand new tools and some in older legacy databases. To build a data warehouse where users can go for reporting needs, ETL tools go out (usually once overnight, but perhaps more often such as every 4 hours if data changes more frequently) and scan all the identified data sources, find updated data and reformat it if necessary to match schemes, and load it into a repository.
Analysts can then query and report from the warehouse to their heart’s content without having to converge multiple queries aimed at a variety of production systems, and without affecting performance of those systems, or worse yet corrupting production data with malformed queries. Business intelligence tools actually make the work of querying even easier, usually with a drag-and-drop GUI as a front end for gory SQL statements or other database access languages.
The other motive for building a warehouse is controlling licensing costs and training. Instead of having to license an analyst and have them occupy a seat in every production data source they would need, and train them on all those different tools and methods, they instead learn one business intelligence tool and the warehouse repository formats they have access to.

Pinpoint is labeled as a “decision support system”, akin to combining an ETL tool and a business intelligence tool into a unified dashboard solution for EDA needs. What it does for an organization is remarkable when the alternative for attempting collaboration becomes clear.
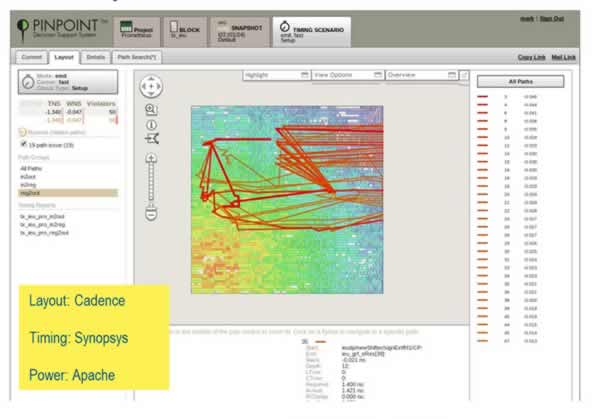
Let’s say a design team uses Cadence tools for layout, Synopsys tools for timing analysis, and Apache tools for power analysis. To answer even simple questions about closure issues, one would have to fire up the timing tools and endure perhaps 20 to 30 minutes for the tool and project data to load. A designer does that daily at the start of a shift, but a systems engineer or manager trying to answer a simple question doesn’t have time to watch the hourglass spin. Maybe viewing the result in timing domain shifts the question to power domain – fire up another tool, load more data, wait again. Over to layout, and add another wait.

Collaboration with Pinpoint produces a web-based view of the most recent, unified, overlaid data from all three tools in this scenario in a few seconds. This opens up “instant on” access to more roles across an organization for design reviews, status reporting, trending, convergence, and schedule estimation. Designers hate doing status reports, right? Go in and mark the “best” runs from work this week – omitting the noise from other runs that may not have produced good results. Hit the “copy link” button that creates a snapshot of the exact queries and zoom level with context, and send it to a manager or a mentor or anyone else, who opens the exact same view instantly.
Folks should understand this isn’t magic. Dassault Systèmes has done an enormous amount of work on extracting data from various EDA tools out-of-the-box. The recent Pinpoint 5.2 release extends support for physical DRC checking in Mentor Graphics Calibre, Cadence Encounter, and Synopsys IC Validator. A scripting API allows configuration and custom parsing of data if you happen to use another tool, but it takes time to design queries and validate results. Chris Chandler, head of the Pinpoint software development team, says broadening the scope of supported data is top priority, and they are working through popular EDA tools and customer requests with command-line support. Chandler says his team has also added filtering and waiver handling in this release so potentially billions of DRC violations can be visualized quickly.
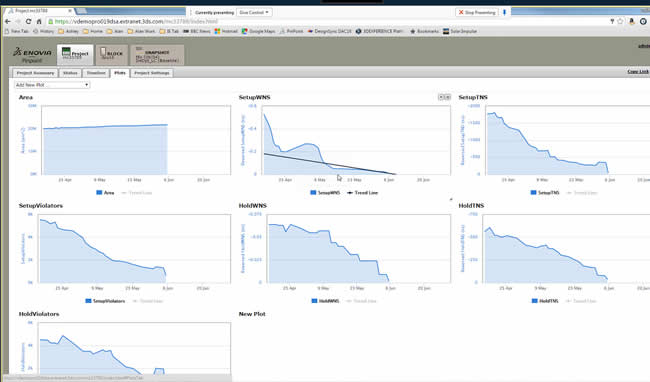
Also in Pinpoint 5.2 are enhanced plotting capabilities. Chandler says organizations use the plots to estimate schedule remaining on problem areas in closure, but the estimate is only as good as the trend line. Again, there’s a concept of marking runs as “best” and using only those instead of all data. A new observation is computing the trend lines by giving more weight to recent runs instead of older runs that are substantially invalid after many changes are applied.

That kind of capability prompted Qualcomm teams to say Pinpoint is “as easy as Google Maps” in visualizing SoC design. Dassault Systèmes describes Pinpoint as part of the Silicon Thinking experience, not just a tool, with the power to transform EDA collaboration without adding steps to design routines. Pinpoint users can zoom in and around problems and look at results from several tools in various domains with a single, web-based dashboard, and quickly share observations. It’s a powerful concept getting even better with subsequent releases supporting more data sources and improved reporting, as Pinpoint development teams keep pace with real-world usage.
Also Read
Sustainability, Semiconductor Companies and Software Companies
The Mechanical Reliability of IC Packages
Semiconductors and Conflict Minerals
Share this post via:


The Foundry Model Is Morphing — Again