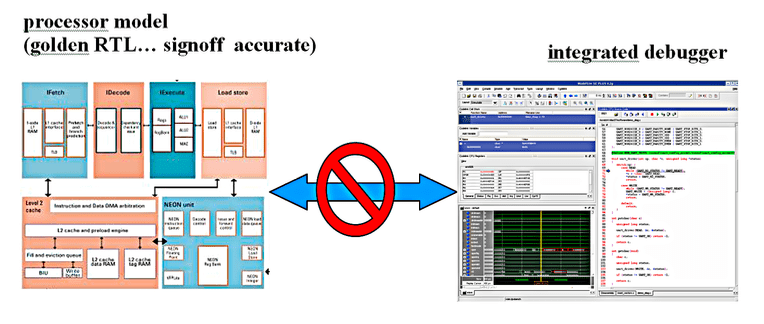
Arm provides great support for debugging embedded software in its CoreSight tools, but what support do you have if you’re debugging hardware and software together in a pre-implementation design? In a hardware debugger you have lots of support for hardware views like waveforms and register states. But these aren’t well connected to what you expect in a software debugger – a source code view allowing for single-stepping, and visibility into variable and memory contents. Worse yet, since the software debugger follows emulation in the debug pipeline, the software can miss closely sequenced hardware events which may be critical to understanding a problem.

Fall back to assembly-level debug?
In my college days one of our lab projects required us to build a project with an early microprocessor, together with our own assembler. I have no idea why this was an option in our physics lab. In those days maybe this was considered more physics than engineering. Anyway, we built and demonstrated a DFT, cycling through lots of rounds of debug in testing the assembly code. That took a while even though our idea of debug was whether the output looked right given what we’d dialed on the signal generator (sine wave, square, etc). This was a very simple processor; even so it took us a while to get right. Proving to me that while it might be interesting to understand the primitive code that drives such a machine, I didn’t want to make a career of it.
Neither do most of us, especially now that processors are significantly more complex and come in clusters. But perhaps given the challenge I mentioned earlier, when you run into a bug you can’t figure out you might suffer temporary insanity. Perhaps, you tell yourself, I should give assembly-level debug a shot. Siemens recently published a white paper with a reminder of why you don’t want to follow this path.
They illustrate through the steps they must follow from a flatlined simulation. First to find the corresponding line in the assembly code. Then tracking that to the C-source code. Figuring out the call stack. Then figure out which variable might be at fault. And finally go back to the waveform view to realize that a pointer variable went to zero. All makes sense but that was a lot of steps to go through to find just the first problem. The first of many in what will likely be a much longer diagnostic search.
Better to couple hardware debug to a code debugger
Siemens offer Codelink to view and debug source code directly with Veloce. You’ll typically do this offline from emulation, since debug involves a lot of head-scratching and what-if-ing. You don’t want to tie up a premium resource while you’re doing that. With a full run-dump from Veloce, you don’t have to. In the example above, you can jump immediately to the last line executed in the source code, instantly understand the code stack and hover over any variable to get its value at that point. One the debug run has loaded you see in seconds that the pointer is zero and you can move on to figure out why.
Codelink has full support for Arm v8 and V9, and access to memory data, register values and disassembly. It also supports multi-core debug, correlation between source window actions and waveforms and power activity. Sure it’s not CoreSight, but CoreSight can’t look into all the other hardware you added to your SoC. Codelink covers both bases well enough to support your full SoC+software debug needs. You can read the Siemens white paper HERE.
Also Read:
A Custom Layout Environment for SOC Design Closure
Siemens Offers Insights into Gate Level CDC Analysis
Share this post via:


Comments
There are no comments yet.
You must register or log in to view/post comments.