

 Electronic system design has been slowly migrating to higher level languages such as SystemC for more than a decade now. SystemC is an open source C++ library that has emerged as a standard for high-level design and system modeling. Writing code in SystemC has several advantages which I won’t elaborate on in this article, though if you want more information note that searching for “SystemC Tutorial” (in double-quotes to get that exact phrase) you get more than 3,000 hits on Google. Forte also offers a free SystemC training course. As a former programmer myself, I am interested in the tools and environment the programmers have to use in working in a particular language. While Forte is best known for its high-level synthesis capabilities, I was pleasantly surprised at the environment Forte has delivered for SystemC debugging.
Forte recently announced their YouTube channel where anyone can simply go and watch video created by them. Interestingly, the professional looking videos I have viewed there seem to be moderated by Forte’s CEO Sean Dart. His light Aussie accent should be easy enough for all English-speakers to understand and the clearly Camtasia-developed videos are very nicely edited.
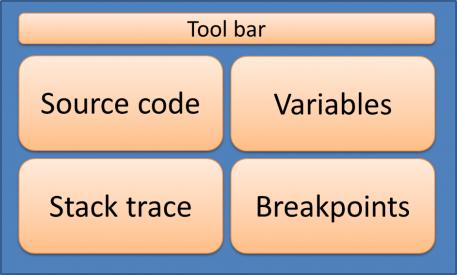
Forte’s Cynthesizer Workbench works with multiple panes which easily allow you to see the source code, call stack, variable values, and list of breakpoints, all at the same time. From this environment you can see the variable values in the context of each procedure (function) on the stack. This is nicely displayed for more complex variables as well, such as showing the fields in a record pointed to from a local variable. In the source code pane you can easily set breakpoints as well as control execution using tool icons to step into or out of loops. Another useful feature is the ability to skip over specific lines of code.
The simulator is invoked directly from within the design/debug environment and you can optionally select the simulation configuration to use for your session. There is a compilation step which is automatically invoked prior to simulation if the code has changed. The loop of setting breakpoints, simulating, analyzing, editing, and re-simulating is all contained within the environment. Also, Forte supports many third-party tools within its flow (a list is available here). This environment is indeed complete for all of the basic debugging needs.
If you are making the move to a higher-level language or if you like to see a clean, useful debugging environment for SystemC development, I suggest you take a look at Forte’s video page for more information. There you will find videos on high-level synthesis, Cynthesizer Workbench, SystemC tutorials, and demo examples. For fun you can even check out the video of the DAC closing bagpipes performance which Forte has sponsored for several years now.
lang: en_US


TSMC CoWoS versus Intel EMIB Semiconductor Packaging