

Electronic design automation, or EDA, became the term used for computer software and hardware developed to aid in the design and verification of electronics, from integrated circuits to printed circuit boards to the integrated electronics of large systems like planes, trains and cars. As the EDA industry evolved, certain dynamics of change became apparent.
Three large companies have led the EDA industry in each of its eras of growth. Computervision, Calma and Applicon were the three largest engineering workstation companies of the 1970’s. They provided special purpose computer workstations for designers to capture the layout of integrated circuits and printed circuit boards and to edit that layout until the designers were satisfied. For all three companies, much of their business came from mechanical CAD (Computer Aided Design) applications but electrical design applications grew as a part of their revenue. The “GDS” standards of today’s IC design came from Calma. In the early 1980s, automation was applied to more than just the physical layout of chips and printed circuit boards. Circuit schematics were captured and simulated on special purpose computers in addition to being transformed into physical layouts of “wires” connecting the circuit elements. Daisy, Mentor and Valid took over the lead during this next decade as Calma and Computervision faded (Figure 1). Large defense, aerospace and automotive companies selected one of these three for standardization across the diverse operations of their companies. Over time, Valid focused primarily on printed circuit board (PCB) design while Daisy and Mentor did both PCB and integrated circuit (IC) design. Daisy and Valid developed their own computer hardware while Mentor was the first to “OEM” third party hardware, adopting the Apollo workstation and developing software to run on it. Although this triumvirate had the leading market share through much of the 1980’s, the cost and resources required to develop both hardware and software dragged Daisy and Valid down while Mentor survived. Mentor was founded in 1981. Soloman Design Associates (SDA) emerged in 1984 and transformed into Cadence in 1988. Synopsys emerged in 1988.
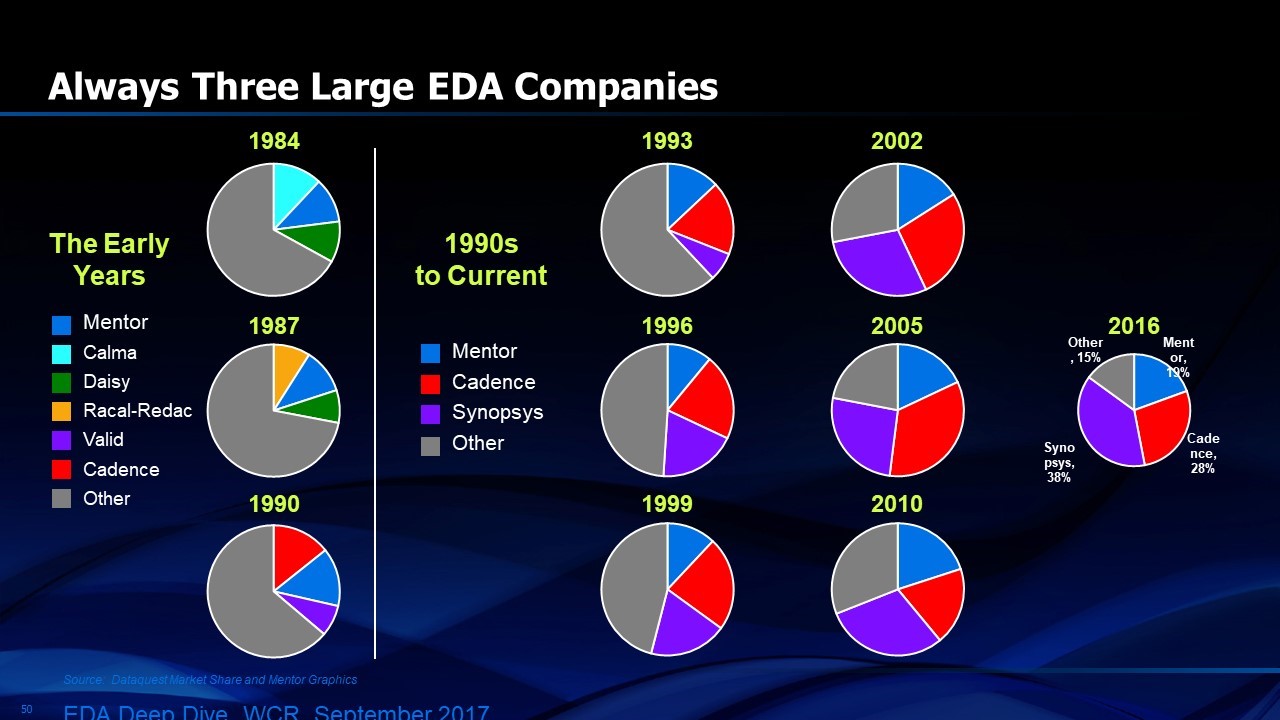
Figure 1. Successive oligopolies in EDA
Since the late 1980’s, Mentor, Cadence and Synopsys have been an oligopoly with combined market share of 75% plus or minus 5% for most of the 1990’s and the next decade. More recently, that percentage has increased to nearly 85%. While Mentor, Cadence and Synopsys had 75%, the other 25% was shared by dozens of smaller companies (Figure 2). Mentor accelerated its market share gains after acquisition by Siemens in 2017 and continued to grow much faster than the market in 2018.
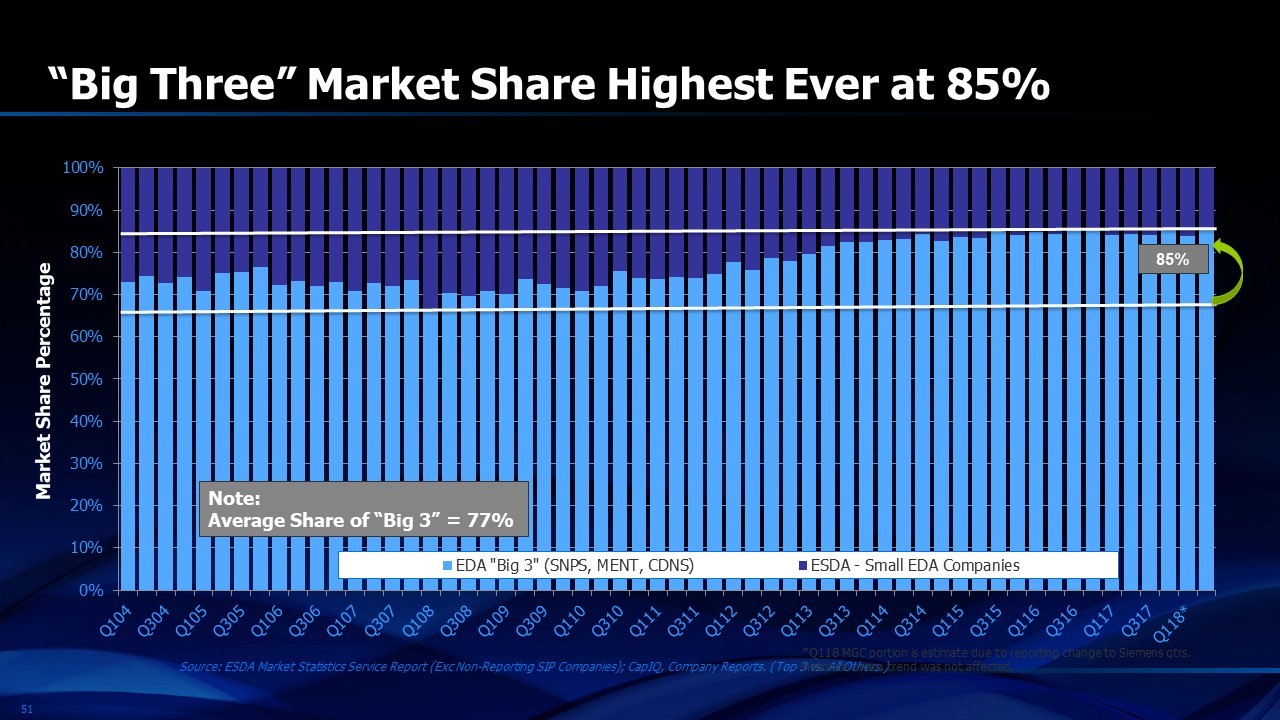
Figure 2. “Big 3” oligopoly with the largest combined market share
While three companies dominated the EDA business through most of its history, the products making up the revenue of the industry were diverse. GSEDA, one of the leading statistics organizations that tracks the industry, reports on the revenue for 65 different types of products (Figure 3). Forty of these segments generated $1 million or more of revenue annually. One would think that it would be very difficult for dozens of small companies with very specialized EDA products to survive when three big companies dominate. The big companies, however, dominate the big market segments and the little companies dominate the little market segments. From time to time, little companies are acquired by the big ones. Overall profitability for the industry remains high because, within any one product category, there is a dominant supplier. Switching costs for a designer to move between EDA suppliers is very high, given the infrastructure of connected utilities and the extensive familiarization required to adopt a specific vendor’s software for one of the design specializations. In the forty largest segments of EDA, the largest supplier in each category has a 67% market share on average. Almost no product segment has a leading supplier with less than 40% market share in that segment (Figure 4). As a result, EDA companies with two thirds of the market in any given segment can spend far more on R&D and support in that segment than their competitors. This gives rise to stability. Engineers are reluctant to change the design software they use because they are familiar with the intricacies of each tool. Since one EDA supplier usually has a commanding market share in each tool category, that company tends to become the defacto supplier of the tool for that particular application. High switching costs drive stability and profit for the EDA industry and most market share gains come from acquisitions.
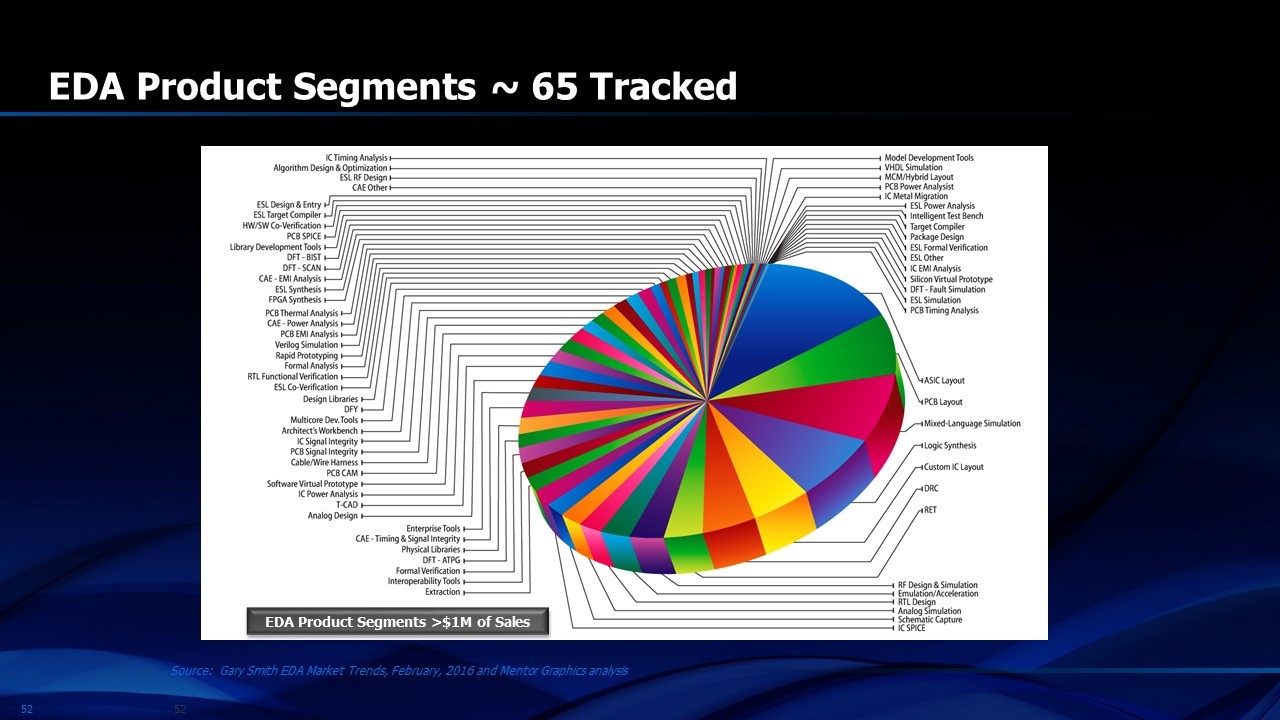
Figure 3. 65 Product segments tracked in EDA. Big companies dominate the big segments and little companies dominate the little segments
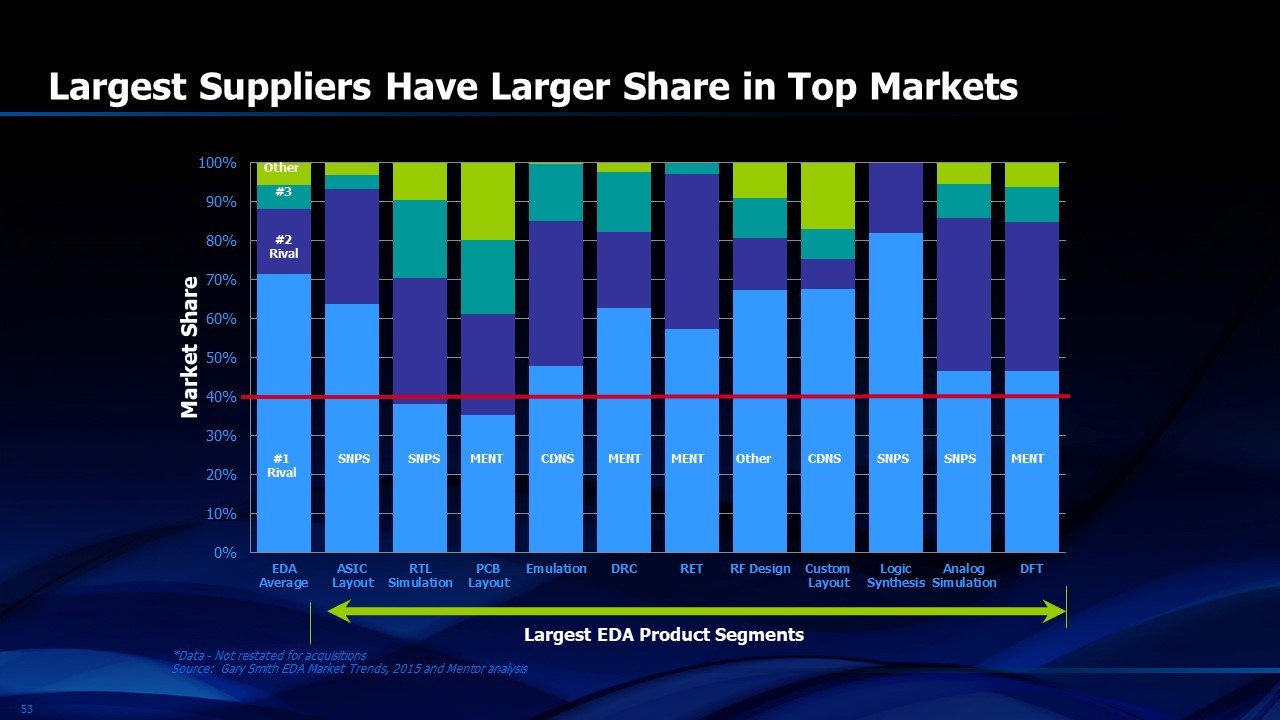
Figure 4. Largest product categories of EDA have a #1 supplier with 70% market share. Minimum market share is about 40%
Companies that use the tools have the task of integrating design flows using different vendors’ tools. Although sometimes difficult when EDA suppliers make it so, this integration is worth the effort to have a “best in class” design flow made up of best in class tools. Defacto standards abound and most users find that life is too short to use the tool that few others use. For decades, Synopsys has been the defacto logic synthesis supplier, Cadence for detailed physical layout, Mentor for physical verification and so forth.
Figure 7 of Chapter 2 shows that EDA industry revenue has been 2% of semiconductor industry revenue for over 25 years. Why doesn’t it increase as needs and applications grow? Or why doesn’t it shrink when R&D cost reduction becomes necessary in the semiconductor industry. First, semiconductor industry R&D has been nearly constant at about 14% for over thirty years. During the 1980’s, EDA software costs rose to two points of that 14% by reducing other R&D costs such as labor. Ever since then, EDA budgets have been set so that they averaged one seventh of the R&D expense of semiconductor companies, or 2% of the total revenue. I’m convinced that salespeople for the EDA industry work with their semiconductor customers to provide them with the software they need each year, even in times of semiconductor recessions, so that the average spending can stay within the budget. As was discussed in Chapter 2, increasing the percent of revenue spent on EDA would require a reduction in some other expense. Rather than do that, the semiconductor industry has unconsciously kept all suppliers on the same learning curve that is parallel to the learning curve for semiconductor revenue. EDA software cost per transistor is decreasing approximately 30% per year, just as semiconductor revenue per transistor does.
What has all this automation done for the semiconductor industry? Figure 13 of Chapter 2 shows the productivity growth per engineer. The number of transistors manufactured each year per electronic engineer has increased five orders of magnitude since 1985. I can’t think of another industry that has produced that level of productivity growth.
Share this post via:


TSMC CoWoS versus Intel EMIB Semiconductor Packaging