Recent advances in EUV lithography have largely focused on “low-k1” imaging, i.e., features with pitches less than the wavelength divided by the numerical aperture (k1<0.5). With a nominal wavelength of 13.5 nm and a numerical aperture of 0.33, this means sub-40 nm pitches. It is naturally expected that larger pitches would be trivially easier to image. However, a closer look shows the situation to be very far from trivial.
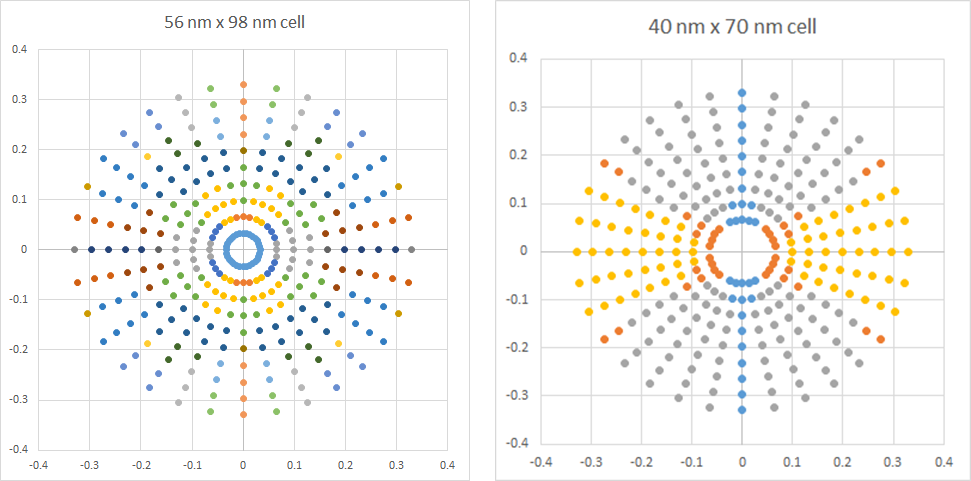
Figure 1. (Left) pupil map for 56 nm x 98 nm unit cell. (Right) pupil map for 40 nm x 70 nm cell. Wavelength=13.5 nm, NA=0.33. Each color represents a different interference pattern from a different combination of diffracted plane waves from the mask pattern.
Figure 1 indicates that an image with a larger pitch (56 nm x, 98 nm y) would consist of a larger combination of diffraction orders than that of the smaller pitch (40 nm x, 70 nm y). The entropy of this combination (proportional to the natural logarithm of the number of possible combinations) is higher. The lower k1 (smaller pitch) case on the right comprises interference patterns of two or three diffracted plane waves at most, with much lower entropy. On the other hand, the higher k1 case comprises interference patterns of no less than four diffracted plane waves.
Figure 2. Different illumination source points produce vastly different images for the higher k1 case. The hexapole actually produces patterns which differ slightly aside from orientation.
Figure 2 shows that different illuminations can produce very different images, not resembling the pattern on the mask or the target pattern. A combination of such images, resulting from a combination of illuminations, can produce something closer to the target, a hexagonal array of circular spots (Figure 3). However, the dose applied to the photoresist layer is necessarily divided among the different component images, leading to relatively larger noise for each component, due to the splitting of the photon number among the different components. Fewer photons per component image leads to enhanced Poisson shot noise [1].
Figure 3. The combination of illumination sources in Figure 2 (left) is necessary to produce an image close to the target (right).
The enhanced noise is evident in a number of ways. First, it appears in the randomly varying stochastic areas of ~300 nm^2 (4-5%) and ~200 nm^2 (>9%) contacts printed within the 56 nm x 98 nm cell (Figure 4).
Figure 4. Stochastic trends of contact area for ~300 nm^2 contacts (left) and ~200 nm^2 contacts (right) for two different degrees of smoothing (3 x 3 pixel average and 5 x 5 nm pixel average). A nominal photon density of 40/nm^2 is assumed.
While edge photon counts of 80 per 1.4 nm pixel allow some containment of the shot noise, the smaller contact suffers more significant impact from the relative noise, as expected.
Noise also appears as a 1.4 nm (one pixel) swing in X-position/Y-position error (Figure 5) as well as a 1-2 pixel error in the Y CD, due to the smoother gradient for the larger Y-pitch (Figure 6). Note that the pixel discretization of the represented feature edge prevents accurate consideration of these CDs as being the “diameter.”
Figure 5. Stochastic trend of X/Y overlay for the 300 nm^2 contact (5×5 pixel averaging used).
Figure 6. Stochastic trend of X/Y CD for the 300 nm^2 contact (5×5 pixel averaging used).
Thus, even for larger k1 pitches, it is necessary to be choosy about the illumination, including stochastic consequences of photon division due to the higher entropy. This is highly relevant for EUV lithography utilizing doses comparable to the photon density used here (~59 mJ/cm2).
Reference:
[1]https://semiwiki.com/lithography/287526-the-stochastic-impact-of-defocus-in-euv-lithography/
This article originally appeared in LinkedIn Pulse: Stochastic Effects from Photon Distribution Entropy in High-k1 EUV Lithography
Share this post via:


Flynn Was Right: How a 2003 Warning Foretold Today’s Architectural Pivot