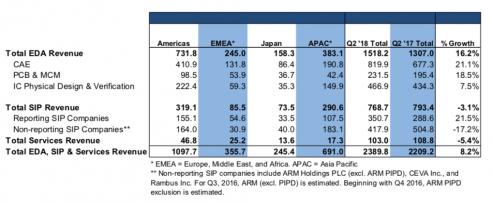
According with ESDA, EDA revenues have grown YoY by 16.2% in Q2 2018, and this is the good news for our industry. The bad news is the decline of SIP (Design IP) revenues, by (3.1%) at the same time. As far as I am concerned, this figure looks weird, so I will try to understand the reason why SIP category can go wrong in a healthy EDA market, indicating a growing design starts number.

At first, ESDA split SIP revenues into “Reporting” and “Non-reporting SIP Companies”. Again, good news, and bad news: reporting companies have posted SIP revenues of $350.7 million in Q2’18 (+21.5%) when non-reporting has been credited of revenues of $417.9 million (-17.2%). Reporting companies certainly includes the top 3 EDA vendors and other IP vendors…
The more than 20% growth for these companies is all but a surprise, if you consider that, in 2017, Synopsys alone had IP revenues of almost $530 million and 18% growth, and Cadence an estimated 21% growth for IP revenues. The good news illustrates the trend that IPnest is seeing on the Interface IP market since 2010 and on the overall IP market since we report these revenues (2015). Not a surprise, just the confirmation that the IP business is very healthy for these “reporting companies”…
It’s now time to look at the “weird” information included in this ESDA report. The strong decline of -17.2% of the revenues posted by the “non-reporting” SIP companies. According with this report, these companies “include” ARM Holding, CEVA Inc. and Rambus. All these companies are publicly trade and they post annual and quarterly reports, and IPnest is familiar with the reading of such reports (even if, in some cases, these can be less transparent than you could guess and expect).
Let’s start with ARM:

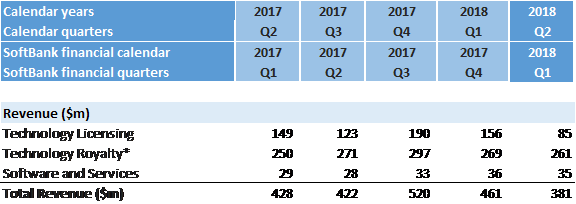
IP related revenues, made of “Technology Licensing” plus “Technology Royalty”, are:
Q2 2018: $85 + $261 = $346 ($m) to compare with
Q2 2017: $149 + $250 = $399
This effectively result into a $53 million YoY decrease to be associated with ARM Holding.
CEVA Inc. delivers quarterly results split into Licensing and Royalty:
Q2 2017: $10.4+ $10.2 = $20.6 ($m)
Q2 2018: $10.0 + $7.5 = $17.5 ($m)
Effectively a YoY decrease of $3.1 million in Q2 2018, mostly associated with royalty (- $2.7m)
At this point, it’s useful to make a status and compare with the results as reported by ESDA (in $ m):
Q2 2017: $504.8
Q2 2018: $417.9
ARM and CEVA cumulated revenues are:
Q2 2017: $399 +20.6 = $419.6
Q2 2018: $346 + $17.5 = $363.5
From these figures, Rambus revenues generated by IP (license + royalty, but not design services nor IC) should be:
Q2 2017: $504.8 – $419.6 = $85.2
Q2 2018: $417.9 – 363.5 = $54.4
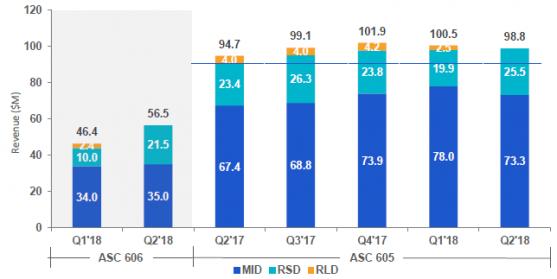
Rambus report revenues in two group, “Memory & Interface” (MID) and “Security” (RSD). If we look at MID, revenues include: “chips, architectures, memory and SerDes interface IP Cores, IP validation tools, and system and IC design services” and RSD “offers a suite of products and services from DPA countermeasures and cores to our CryptoManager™ Platform, mobile payments and smart ticketing”. Let’s remember that we are only interested by the revenues generated by IP licenses or royalties, only a part of Rambus revenues…
From Rambus web site:

Before digging between which revenues are associated with IP or not, we discover that the revenues were reported last year under ASC 605 (accounting method) but are officially reported according with ASC 606 in 2018.
ASC 605 ($ m) ASC 606 ($ m)
Q2 2017: $90.8 ??
Q2 2018: $98.8 $56.5
In other word we are comparing apples (Q2 2018 revenues ASC 606) with oranges (Q2 2017 revenues ASC 605)!
I honestly don’t know which method, ASC 605 or 606, is the most reliable, but if we want to have an idea of the IP market evolution, we should use ASC 605. In this case we could say that Rambus IP revenues have grown YoY by + 9%, not decreased by (85.2 – 54.4)/85.2 = – 36%!!
So, we can eliminate Rambus from the suspect list, as their business has grown, but the accounting method has changed, and Rambus is “apparently” guilty of $31 million YoY decrease in Q2 2018. And we can say that CEVA is responsible of a $3.1 million decrease in Q2 2018, but the higher loss is coming from ARM, with minus $53 million, including -$63 million for licensing only.
ARM Holding case is more concerning. If the royalty revenue has grown by 4% or $11 million, their IP license revenues has decreased by 43% or $64 million. If you remind that today’s licenses will generate tomorrow’s royalty, you can predict that ARM royalty revenues will most probably decrease in the future (18 to 24 months), even if it’s impossible to say by how much. It will depend if these missing licenses are related to wireless application processor, or not. We have to come back at their report, very comprehensive Excel spreadsheet (the last quarter on the right is Q2):

The number of Mali licenses is bad news, 1 instead of 4 previously, as well as for Cortex-A serie, the number of licenses signed in Q2 2018 have fallen to 3, to be compared with 7 (Q2’17). This is also bad news, but if we consider the number of Cortex-A licenses signed in Q4 2017 (19) and Q1 2018 (12), this bad result for Q2 2018 could be conjunctural, and not reflects a long-term trend. It’s just too early to drive a conclusion.
But if we compare the number of Cortex-R licenses signed in 1H 2018 (3) with 1H 2017 (9), as well as Cortex-M licenses signed in 1H 2018 (21) with 1H 2017 (31), we can detect a trend. Minus 66% (Cortex-R) and minus 30% (Cortex-M) are concerning results.
There could be several reasons to explain this Q2 2018 ARM IP licensing drop as a long-term trend.
No doubt that RISC-V is attracting customers, thanks to the more favorable business model. Moreover, this explanation is on line with the impacted product lines, Cortex-R and Cortex-M. No doubt as well that the competition from Synopsys (ARC CPU IP), Andes (CPU IP) and Cadence (Tensilica IP) have both an impact.
There could be a deep management issue. Before SoftBank acquisition of ARM, Warren has been CEO for a decade, and he was the only CEO. Now, ARM CEO Simon Segars may have to share his decision maker job with SoftBank’s CEO? But this is just a pure supposition…
According with David Manner, ARM may have started to develop chips targeting IoT, becoming a de facto competitor with his own customers and this would clearly be a fault. If you want to sale IP, you don’t compete with your (potential or actual) customers. Imagine that TSMC decide to develop wireless application processors! TSMC doesn’t do it, and probably will never do!
In summary, these “weird” results as reported by ESDA for IP revenues in Q2 2018 are effectively real for CEVA (-$3 million and -15%) and ARM (-$53 million and 13%) but are questionable for Rambus as they are related to an accounting method change between 2017 and 2018, leading to – $31 million in the report.

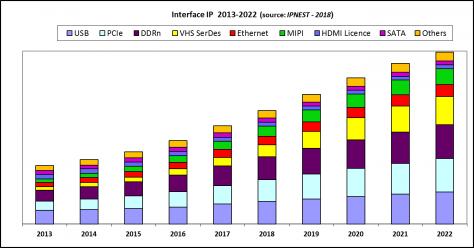
Now, if you want to hear good news about Design IP, just contact me, as the “Interface IP Survey 2013-2017 – Forecast 2018-2022” has been released last week by IPnest. The growth has been solid for the various Interface IP in 2017, with +18% YoY. And, as you can see on this graphic, the future should be brilliant too, as the Interface IP market will have passed the $1 billion mark in 2020 (it was about $500 million in 2015).
Eric Esteve from IPnest
Share this post via:


TSMC vs Intel Foundry vs Samsung Foundry 2026