

Smartphone and Media tablet markets are exploding, generating huge level of profit for the Apple, Samsung or Qualcomm, and we don’t see yet when the growth will stop. That’s a point. But is it a reason for analyst to write down everything that springs to mind, including obvious insanity? Let’s have a look at the diagram below, and try to figure out if it makes any sense…

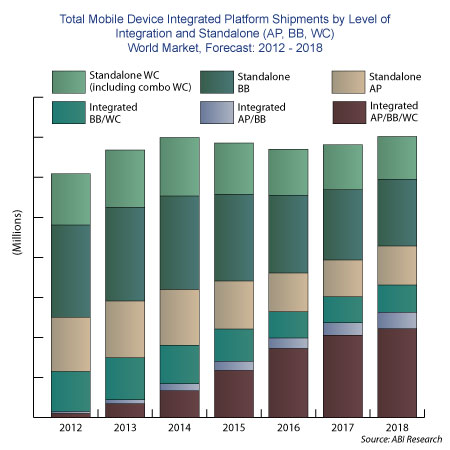
This figure is supposed to demonstrate that worldwide shipment of integrated chip solution for mobile devices will grow from almost 0 to 46% from 2012 to 2018 (integrated AP/BB/WC in brown). In fact, if you consider that such integrated solution will serve the low end side of the smartphone market, this trend makes sense. Let’s now have a look at the way the figure is built, more specifically at the Y scale and the multi-color bar height:
- To describe the market adoption for one solution (here Integrated AP/BB/WC) in competition with other solutions (like Standalone AP, Integrated AP/BB etc.), an analyst will tend to use a percentage based graphic; is it the case here?
- No, because the Y scale clearly indicates (Millions)
- No, because the seven bars are not of equal height
- So, in this case, the bar height represents the shipment value in Million, which is a very acceptable representation…
- Except that, in this case, this analyst shows that the forecast for “Total Mobile Device Integrated Platform” is growing by… 10 or 15% from 2012 to 2018! Here, I really have a problem trusting this analyst. Why? Just see below!
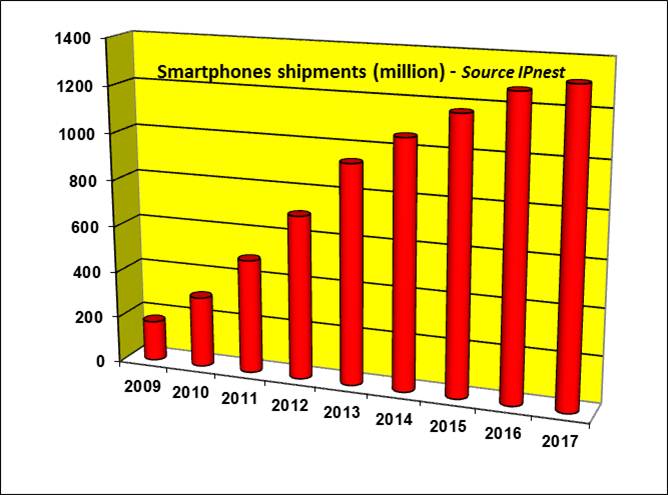
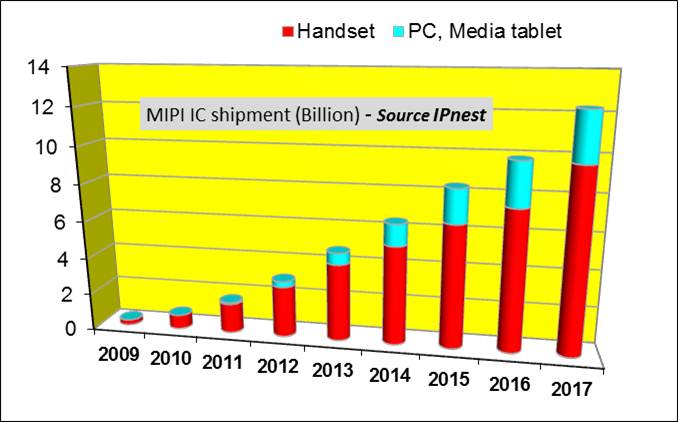
I have started building this forecast back in 2010, initially to help calculating MIPI IC forecast (see the other graphic below) and I keep updating it using “actual” values, smartphones shipment effectively measured each quarter. To be honest, I must say that I had to revise this forecast many times, because (like many of us) I had under-estimated the incredible growth of smartphone shipments, in the 40% range year after year. Will this growth halt during the next couple of years, as regions like Europe, Japan and North America have reached around 60% penetration rate for smartphone? I don’t think so at all, because the reservoir for new adopters (people who buy their first smartphone) is simply huge when simply counting China, India and Brazil. These new adopters will buy enough smartphone so the market will double within the next five years, at least this is my prediction. That’s why I don’t understand the prediction made by the above mentioned analyst. But I am open to any suggestion, if anybody can figure out why the “Total Mobile Device Integrated Platform” graphic forecast such a minimal growth…
Eric Esteve from IPNEST –
lang: en_US


Consolidation and Competition: Who is Winning the $4.5 Billion Interface IP Race?