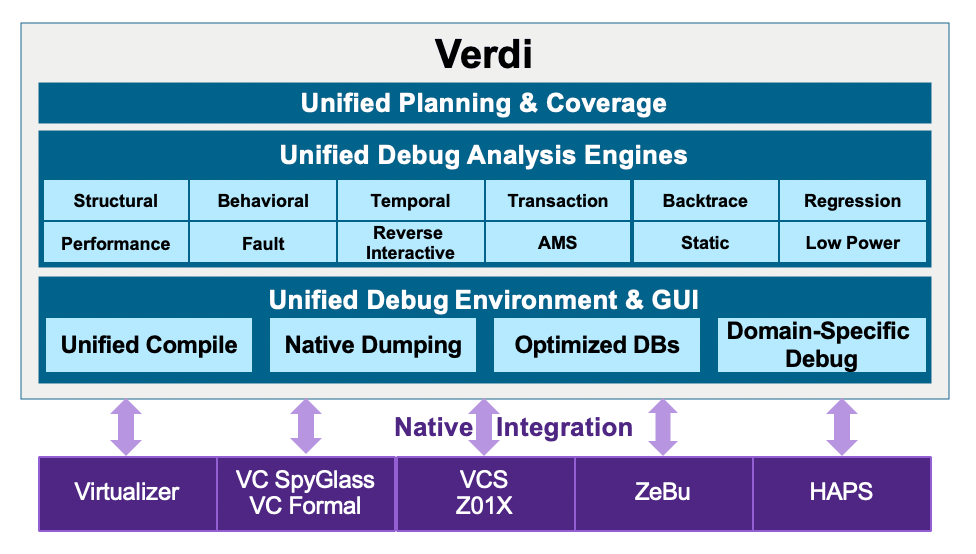
Want fast debug? Synopsys recently hosted a Webinar to show off the latest and greatest improvements to Verdi® in performance, memory demand and multi-tasking, among other areas.

Performance improvements
Taruna Reddy (PMM) and Allen Hsieh (Staff apps) presented features of the latest version, released in March – Taruna started by talking about the benefits that can be found in a tight integration between the simulator (VCS) and the debugger. This shows up first in compile-time performance – only one compile needed for both. Synopsys has also added tight integration for dynamic aliasing in the databases. Dynamic aliasing works on a common expectation that some signals may have the same waveform through ~90% of a run. A good example would be for clocks. These can be aliased into one signal and intelligently retrieved in debug. Taruna said that this can show ~3.5X reduction in FSDB size and 1.5X improvement in performance. Synopsys has also been able to squeeze out up to 2X improvement in runtime for transaction dumping through native DPI integration.
A question came up at the end – can third party simulators benefit from these improvements? Allen stressed first that Verdi continues to actively support other simulators. However, they won’t get the benefit of these improvements because they require tight integration in the simulator as well as in the debugger.
Taruna also mentioned that, again through further tight integration, they have been able to reduce callback overhead between the simulator and the debugger, giving another 1.2X in performance, and they now enable you to configure dumping to run through multiple threads, offering yet another 1.2X in performance boost.
Incremental FSDB loading
Allen talked about another class of optimizations: smart loading and pre-loading DBs into Verdi. Smart load works well on large designs with FSDBs that have good hierarchical division in signals. A smart load will load only the first touched scope in a debug session until it has to load more. Allen said they have seen >10X reduced load time and 10X reduced load memory in such cases. He anticipated an obvious question – what efficiency hit do you take if you need to go outside that scope in debug? He showed an example in which he traced 3 drivers outside an initially loaded scope. At least for that example, he still saw a 6X improvement in performance over starting with a full load.
An obvious question on this topic came up in Q&A – are there cases in which smart load doesn’t work well? Allen admitted that for gate-level sims with very little hierarchy, you probably won’t see any advantage.
Verdi also supports user-defined loading – you define which scopes you want to load and can pull in more only if needed.
Other improvements
Allen mentioned a couple more useful features. First, Verdi now supports multi-tasking debug. You can now launch long-running tasks, such as driver-tracing, in separate tasks and continue to debug while those are running. There’s also a capability to pause or cancel background tasks.
Verdi has added a unified “Find” in this release – one Find window to rule them all, rather than separate Find windows with not always consistent capabilities. As in any other windowing environment, Find works on whatever window you have selected.
Allen wrapped up with a discussion on some other features which were available in earlier releases but are perhaps still new to some of you. He talked in particular about Reverse Interactive Debug and Constraint Debug. He also provided an overview of consistency in Verdi Debug interface across the entire Synopsys Verification product line.
You can watch the Webinar HERE.
Also Read:
Design Technology Co-Optimization (DTCO) for sub-5nm Process Nodes
Webinar: Optimize SoC Glitch Power with Accurate Analysis from RTL to Signoff
The Problem with Reset Domain Crossings
Share this post via:


Comments
There are no comments yet.
You must register or log in to view/post comments.