I attended a Mentor verification seminar earlier in the year at which Russ Klein presented a fascinating story about a  real customer challenge in debugging a power problem in a design around an ARM cluster. Here’s the story in Russ’ own words. If you’re allergic to marketing stories, read it anyway. You might have run into this too and the path to debug is quite enlightening.
When I was a kid, my father used to get very angry when he found a light on in an empty room. “Turn off the lights when you leave a room!” he would yell. I vowed when I got my own home I would not let such trivia bother me. And I don’t. The last time my dad came to visit he asked me, “What’s your electric bill like?” as he observed a brightly lit room with no one in it. I changed the subject.
There is probably no worse waste of energy than lighting and heating a room that is empty. The obvious optimization: notice that no one is there and turn off the lights. It works the same on an SoC or embedded system. To save energy, system developers are adding the ability turn off the parts of the system that are not being used. Big energy savings but with no compromise to functionality.
I was working with a customer who had put this type of system in place, but they were observing a problem. While most of the time the system did really well with battery life, occasionally – about 10% of the time – the battery would die long before it should. The developers were stumped. After a lot of debugging what they discovered was that one of the energy hungry peripherals would be turned on and left on continuously, while there were no processes using it.
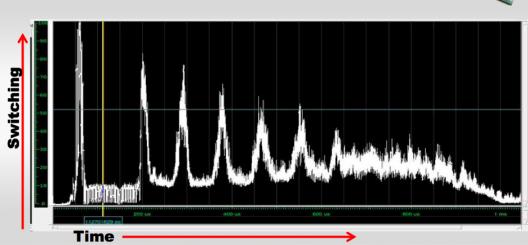
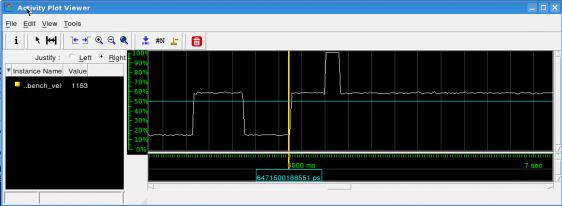
To debug the problem, they stopped trying to use the prototype and went back to emulation on Veloce to try to figure out what was going on. Veloce has a feature that allows developers to create an “activity plot” of the design being run on the emulator. The activity plot shows a sparse sampling of the switching activity of the design. While switching activity does not give you an absolute and exact measurement of power consumed, it does allow you to find where likely power hogs are hiding (see figure #1).
They ran their design on Veloce and captured the activity plot; it looked like this (see figure #2).
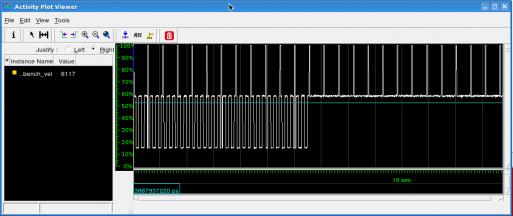
The design was configured to run two processes, one that was using peripheral A (the developer of this system is quite shy and does not want me putting anything here which could be used to identify them – so the names have been changed to protect the innocent). The other process was using peripheral A and peripheral B. As you can see from the graph, one peripheral is accessed at one frequency, creating one set of spikes in switching activity. The second process accesses both peripherals, but less frequently producing the taller set of spikes. For testing purposes, the frequency of the processes being activated was increased. Also, the period of the two processes was set to minimize the synchronicity between them.
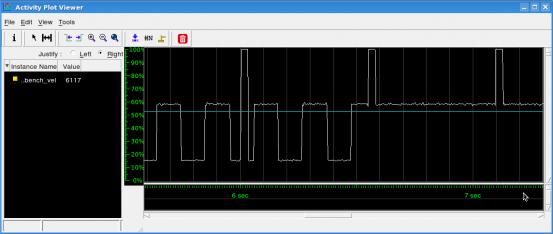
Figure #2 shows that at some point, the spikes on peripheral A disappear – that is, peripheral A gets left on, when peripheral B gets turned on. Someone “left the lights on” as it were. Examination of the system showed that, indeed, the power domain for peripheral A was left on.
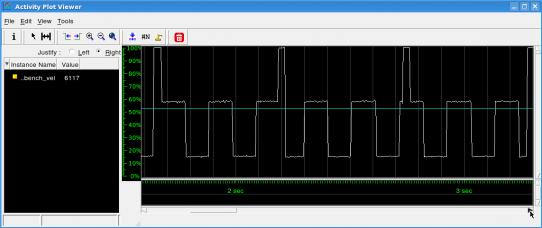
Figure #3 shows a close up of the activity plot when power domains are being turned on and off correctly. Figure #4 shows a close up of the point where peripheral A is unintentionally left powered on continuously.
With Codelink[SUP]®[/SUP], a hardware/software debug environment that works with Veloce, the designers were able to correlate where the cores were, in terms of software execution, with the changes in switching activity shown in the activity plot. Figure #5 shows a correlation cursor in the activity plot near a point where peripheral A gets turned on and the debugger window in Codelink, which shows one of the processor cores in the function “power_up_xxx()”.
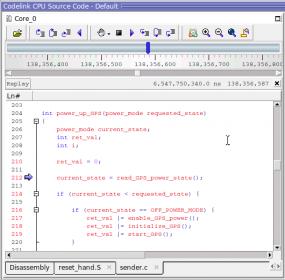
Since the problem was related to turning off the power to one of the power domains, they set the Codelink correlation cursor to where the system should have powered down peripheral A (see figure #6).
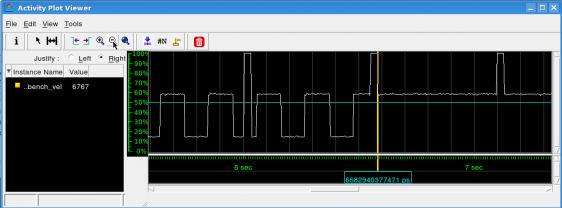
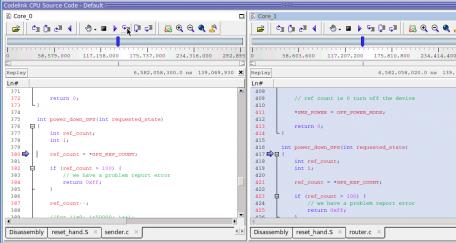
At this point there were two processes active on two different cores that were both turning off peripheral A at the same time (see figure #7).
Since this system is comprised of multiple processes running on multiple processors, all needing a different mix of power domains enabled at different times, a system of reference counts is used. The way it works is when each process starts it reads a reference count register for each of the power domains it needs. If it reads a 0, then there are no current users of the domain and the process turns on the power domain. It also increments the reference count and writes it back to the reference count register.
When the process exits, and no longer needs the power domains powered up, it basically reverses the process. It reads the reference register. If it is a 1, then the process can conclude that there are no other processes using the power domain and turns it off. If the reference count is higher than 1, then there is another process using the domain and it is left on. The process decrements the reference count and writes it back to the reference count register.
At any point in time, the reference count shows the number of processes currently running that need the domain powered on.
Using Codelink, the developers were able to single step through the section of code where the power domain got stuck in the on position. What they saw were two processes, each on a different core, both turning off the same power domain.
First, core 0 read the reference register, and it read a 2. Then core 1 read the same reference register, and it too read a 2, since the process on core 0 had not yet decremented the count and written it back. Next both cores decided not to turn off the power for the power domain, as they each saw that another thread was using the peripheral. Finally, both cores decremented their reference count from 2 to 1. And they both wrote back a 1. This left the system in a state where there was no process using the power domain, but it was turned on. Since the reference register held a one, any subsequent processes that used the domain would not clear this count. And the power would be on to this domain until the system was rebooted, or ran out of power.
Now this looks like a standard race condition. Two processes from two different cores, both doing a read/modify/write cycle. In this case, these bus cycles need to be atomic. The developers went to the software team and told them about their mistake and asked them to perform locked accesses to the reference count register.
It turns out that they were using a locked access to reference the count register. They pointed the finger back at the hardware team.
The hardware team had implemented support for the AXI “Exclusive Access”. The way the exclusive access works is that an exclusive read is performed. The slave is required to note which master performed the read. If the next cycle is an exclusive access from that same master, the write is applied. If any other cycle occurs, either a read or a write, then the exclusive access is canceled. Any subsequent exclusive write is not written, and an error is returned. This logic should have prevented the race condition seen.
On closer examination, it turned out that the AXI fabric was implementing the notion of “master” as the AXI master ID from the fabric. Since the ARM processor had four cores the traffic on the AXI bus for all four cores was coming from the same master port – so they were all seen as coming from the same master. So from the fabric’s perspective and the slave’s perspective, the reads and writes were all originating from the same master – so the accesses were allowed. There was no differentiation between accesses from core 0 and core 1. An exclusive access from one core could be followed by an exclusive access from another core in the same cluster, and it would be allowed (see figure#8). This was the crux of the bug.
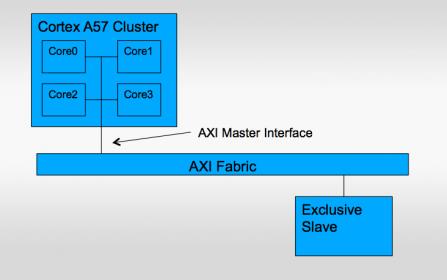
The ID of the core which originates an AXI transaction is coded into part of the transaction ID. By adding this to the master, which was used for determining the exclusivity of the access to the reference count register, the design allowed it to correctly process the exclusive accesses.
Veloce emulation gave the developers the needed performance to run the algorithm to the point where the problem could be reproduced. Codelink delivered the debug visibility needed to discover the cause of the problem. The activity plot is a great feature that lets developers understand the relative power consumption of their design.

Russell Klein is a Technical Director in Mentor Graphics’ Emulation Division. He holds a number of patents for EDA tools in the area of SoC design and verification. Mr. Klein has over 20 years of experience developing design and debug solutions which span the boundary between hardware and software. He has held various engineering and management positions at several EDA companies.


Comments
There are no comments yet.
You must register or log in to view/post comments.