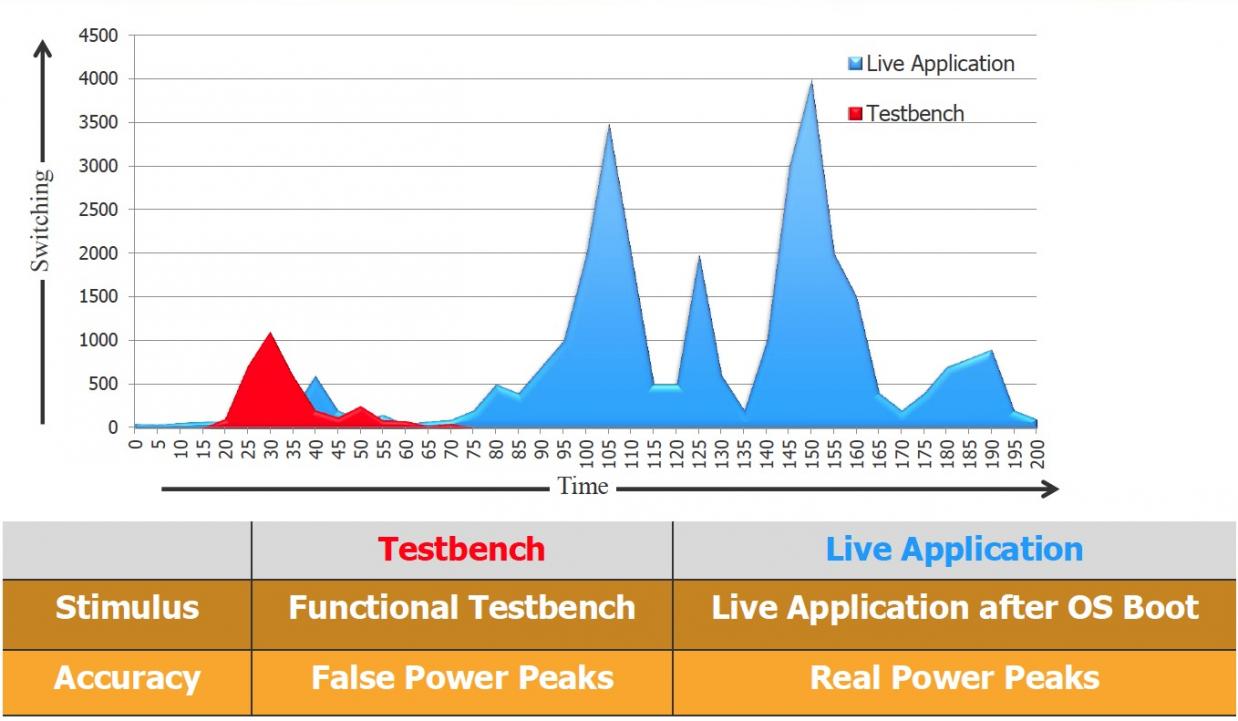
On your last SoC project how well did your dynamic power estimates match up with silicon results, especially while running real applications on your electronic product? If your answer was, “Well, not too good”, then keep reading this blog. A classical approach to dynamic power analysis is to run your functional testbench on some RTL code or even gate-level netlist, then look at the switching activity as a function of time. This approach is shown in red on the following chart:

Some of the issues with using a testbench approach to getting switching activity are:
- Functional simulation takes a long time, so you cannot really boot an OS or run an app
- Your stimulus may not uncover the worst case scenarios, giving you a false sense of security
Another approach is to use a hardware emulator and then actually boot the OS and run your real apps to see switching activity, shown in blue on the chart above. For this SoC it is clear that the testbench approach lead to false power peaks, which would’ve meant that silicon power consumption was much higher than expected, causing a re-spin or even cancelation of the project. The emulator-based approach which was able to run the OS and live apps provided the truest switching activity numbers, leaving no surprises for silicon.
So, who has created such an emulator-based approach to dynamic power analysis? It turns out that it’s not a single company, but rather two companies:
- Mentor Graphics providing the emulation and integration
- ANSYS with the PowerArtisttool for dynamic power analysis
Related – Mentor’s New Enterprise Verification Platform
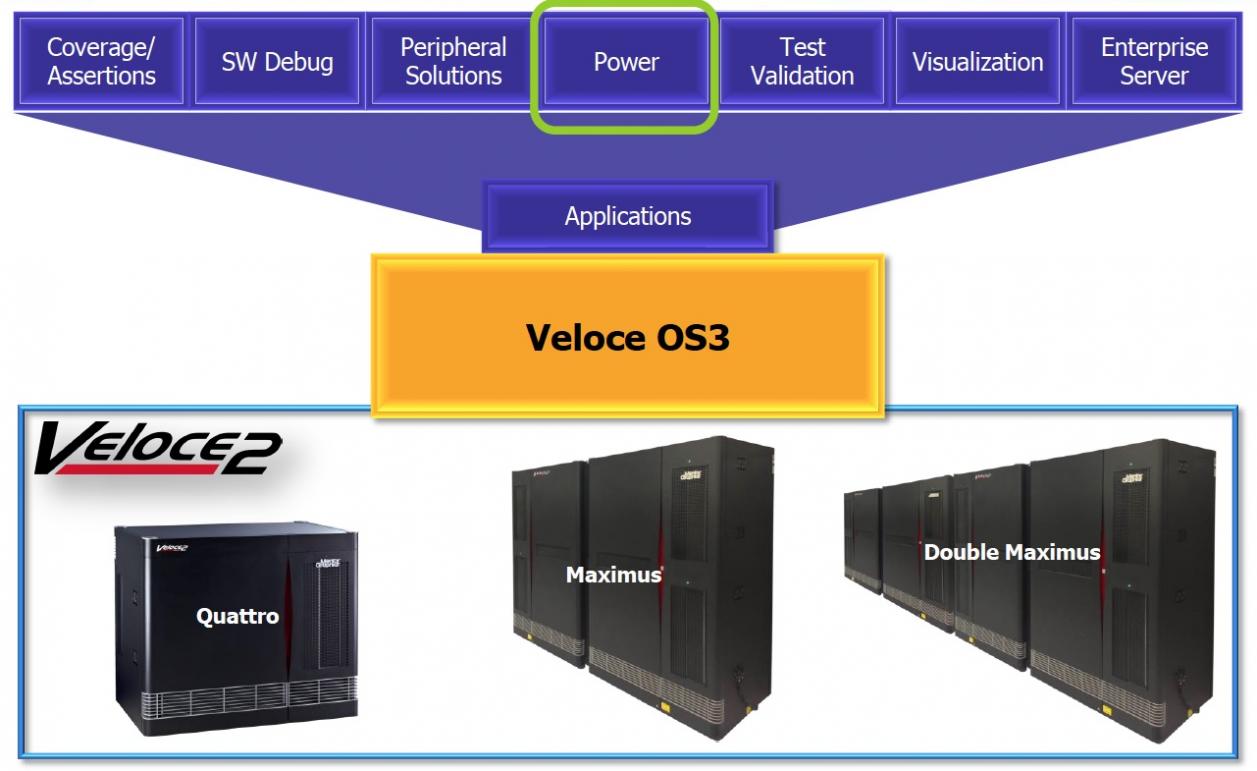
I spoke with Jean-Marie Brunet of Mentor Graphics last week by phone to learn about this new capability for counting the switching activity on RTL or gate-level SoC designs using their Veloce emulator.

Mentor Graphics has offered a couple of previous flows with their emulator that created files for switching activity using the UPF and SAIF file formats. What’s new this month is that their emulator can now create this switching activity and make the results available through a dynamic API, which provides benefits like:
- Faster time to power analysis results (no reading and writing of file interfaces)
- Integration with the popular PowerArtist tool from ANSYS which provides the dynamic power analysis numbers
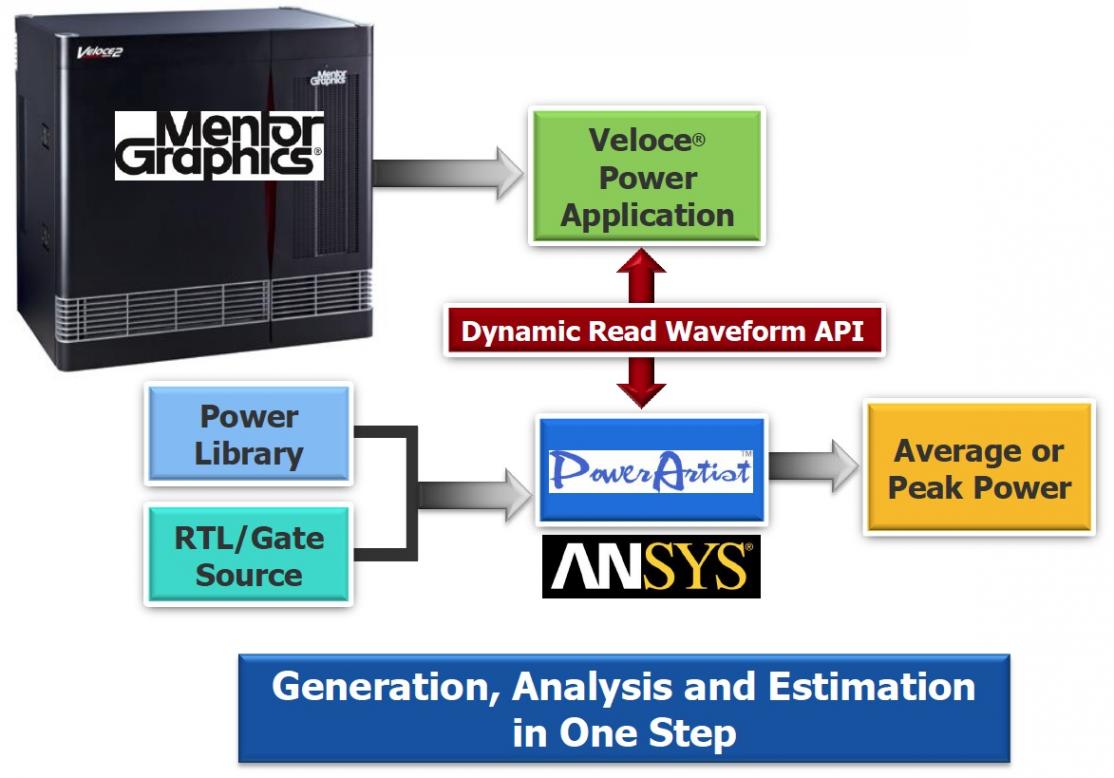
Using the SAIF (Switching Activity Interchange Format) approach is one possible power flow, and it will get you average power numbers. Another approach is to use and FSDB (Fast Signal Data Base) file flow, however you will quickly find that your hard disk is getting filled up with large files that also take a lot of CPU time to complete, but at least you are getting dynamic power values. The new, recommended approach is one where the emulator has a Power Application that can connect to PowerArtist from ANSYS with a dynamic API, allowing:
- Fastest speed, sufficient to boot an OS and run real Apps on your SoC
- Quickest time to results
- Average of peak power
- Eliminates large FSDB files
Related – Improving Verification by Combining Emulation with ABV
Here’s what the new flow looks like:

This approach was requested by leading-edge customers, and you can expect Mentor to do additional integrations in the future, even with other EDA vendors. Actual performance numbers of the time savings for this API-based, dynamic power approach compared to the older, slower file-based approach shows a speed up of 2X to 4.25X, depending on the type of design that you have. That means that you can expect to save weeks of CPU time on a large SoC project to get accurate, dynamic power numbers from either RTL or gate-level netlists.
Summary
If you already have the Veloce emulator and PowerArtist tool, then it would make sense to give this new Veloce Power App an evaluation. If your last dynamic power estimate was dramatically different than silicon, then maybe it’s time to consider using this emulator-based flow instead of your old approach.


Comments
There are no comments yet.
You must register or log in to view/post comments.