If you follow the SemiWiki Twitter feed you may have noticed that The Motley Fool (Seth Jayson) did three more articles on TSMC financials. The first Foolish article was blogged on SemiWiki as “TSMC Financial Status and OIP Update”.

The next three Fool Hardy articles look at cash flow (the cash moving in and out of a business), accounts receivable (AR), days sales outstanding (DSO) and a closer look at margins. All three articles are interesting reads so if you have the time I would definitely click over. If not, here are the cool pictures and my expert guess of the foundry business going forward.
 Don’t Get Too Worked Up Over #TSMCEarnings http://www.fool.com/investing/general/2011/10/04/dont-get-too-worked-up-over-taiwan-semiconductor-.aspx
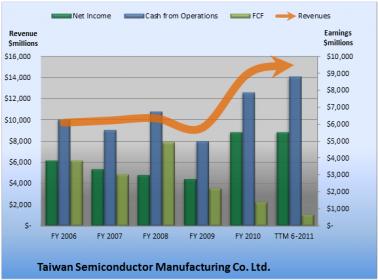
Over the past 12 months, Taiwan Semiconductor Manufacturing generated $687.4 million cash while it booked net income of $5,543.0 million. That means it turned 4.5% of its revenue into FCF (Free Cash Flow). That sounds OK.
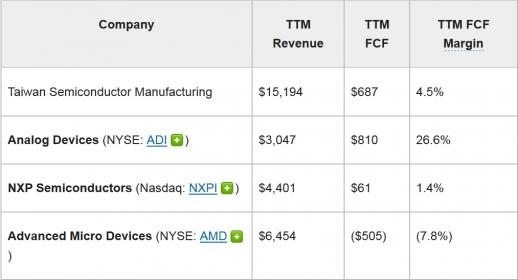
However, FCF is less than net income. Ideally, we’d like to see the opposite. Since a single-company snapshot doesn’t offer much context, it always pays to compare that figure to sector and industry peers and competitors, to see how your business stacks up.
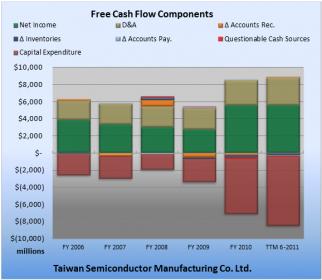
With questionable cash flows amounting to only -1.1% of operating cash flow, Taiwan Semiconductor Manufacturing’s cash flows look clean. Within the questionable cash flow figure plotted in the TTM period above, changes in taxes payable provided the biggest boost, at 1% of cash flow from operations. Overall, the biggest drag on FCF came from capital expenditures, which consumed 92.2% of cash from operations.
DanielNenni SemiWiki.com
#TSMCPasses This Key Test fool.com/investing/gene…
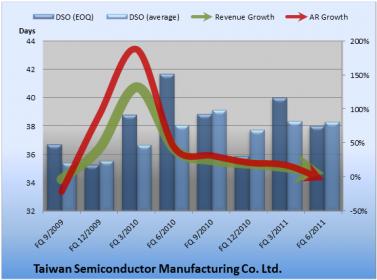
Sometimes, problems with AR or DSO simply indicate a change in the business (like an acquisition), or lax collections. However, AR that grows more quickly than revenue, or ballooning DSO, can also suggest a desperate company that’s trying to boost sales by giving its customers overly generous payment terms. Alternately, it can indicate that the company sprinted to book a load of sales at the end of the quarter, like used-car dealers on the 29th of the month. (Sometimes, companies do both.)
Why might an upstanding firm like Taiwan Semiconductor Manufacturing do this? For the same reason any other company might: to make the numbers. Investors don’t like revenue shortfalls, and employees don’t like reporting them to their superiors.
Is Taiwan Semiconductor Manufacturing sending any potential warning signs? Take a look at the chart above, which plots revenue growth against AR growth, and DSO. Will Taiwan Semiconductor Manufacturing miss its numbers in the next quarter or two? I don’t think so. AR and DSO look healthy. For the last fully reported fiscal quarter, Taiwan Semiconductor Manufacturing’s year-over-year revenue grew 5.3%, and its AR dropped 3.9%. That looks OK. End-of-quarter DSO decreased 8.7% from the prior-year quarter. It was down 4.9% versus the prior quarter.
DanielNenni SemiWiki.com
Are You Watching This Trend at #TSMC? fool.com/investing/gene…
Margins matter. The more Taiwan Semiconductor Manufacturing (NYSE: TSM ) keeps of each buck it earns in revenue, the more money it has to invest in growth, fund new strategic plans, or (gasp!) distribute to shareholders. Healthy margins often separate pretenders from the best stocks in the market. That’s why we check up on margins at least once a quarter in this series. I’m looking for the absolute numbers, comparisons to sector peers and competitors, and any trend that may tell me how strong Taiwan Semiconductor Manufacturing’s competitive position could be.
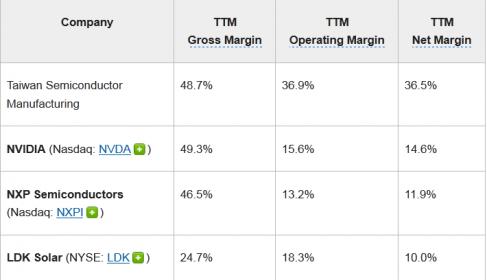
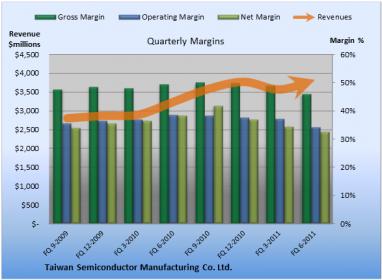
Here’s the margin picture for Taiwan Semiconductor Manufacturing over the past few years:
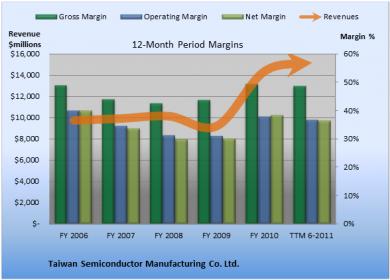
Here’s how the stats break down:
- Over the past five years, gross margin peaked at 49.4% and averaged 45.8%. Operating margin peaked at 40.1% and averaged 35%. Net margin peaked at 40% and averaged 34.5%.
- TTM gross margin is 48.7%, 290 basis points better than the five-year average. TTM operating margin is 36.9%, 190 basis points better than the five-year average. TTM net margin is 36.5%, 200 basis points better than the five-year average.
With recent TTM operating margins exceeding historical averages, Taiwan Semiconductor Manufacturing looks like it is doing fine.
My expert guess is that the semiconductor industry will continue to struggle as a result of the economic uncertainty around the world. Unemployment, debt, housing crisis, over population (7 Billion+ people!); consumers will spend less money on electronics next year. To make things worse, semiconductor inventories are at pre-recession levels. In Q2 2011, the DOI (days of inventory) reached 83.4 days, exceeding the last record high of 83.1 days seen in the first quarter of 2008. The good news is that smart phones are no longer considered a luxury, smart phones are now life lines which means they will continue to hyper drive the semiconductor industry for years to come. China is hugely subsidizing mobile phones and India launched a $35 tablet ($60 cost) so the internet will be coming before indoor plumbing in some regions.
In regards to TSMC, it is all good news. Take a look at the charts and you will see an extremely healthy company in a VERY competitive market and the MOST economically challenging times the semiconductor industry has ever seen. TSMC has already won the 28nm node and 20nm is not far behind. TSMC is easily a $20 stock, believe it.
UMC botched 40nm and is struggling with 28nm, this really breaks my heart as I absolutely respect the UMC engineers. SMIC was a huge disappointment. Backed by the Chinese government and the largest domestic market for consumer electronics, how could they fail? But fail they did. Hopefully the recent re-org will get SMIC back in the foundry game! I also had high hopes for GlobalFoundries as a competitive threat for TSMC. GFI is actually doing quite well, unfortunately we all got carried away in the excitement and unachievable expectations were set. Intel 22nm may be the only real threat to TSMC at 28nm and it will certainly be exciting to see how that all plays out.


Comments
There are no comments yet.
You must register or log in to view/post comments.