Amid burgeoning complexity of SoC verification with ever increasing hardware, software and firmware content, verification engineers are hard pressed with learning multiple tools, technologies and methodologies and still completing SoC verification with full accuracy in time. The complexity, size and diversity of SoC has increased while time-to-market has decreased, thus compressing the time to design and verify. The engineering team scattered across the globe need access to limited common verification resources, especially hardware emulators in order to gain confidence in complete SoC verification. Emulators are generally stored in labs and are accessed physically, thus limiting their access to a larger team. What if the emulator environment is virtualized and is made available to the verification team across the globe? It will unleash the resource capability, scale up verification and improve design and verification team productivity by large extent.
Lauterbach’shardware assisted debug toolset TRACE32 and Mentor’sVeloce emulator provide a unified debugging environment that can be used in virtual (for models and simulators) as well as physical (for FPGA prototypes and silicon) mode.

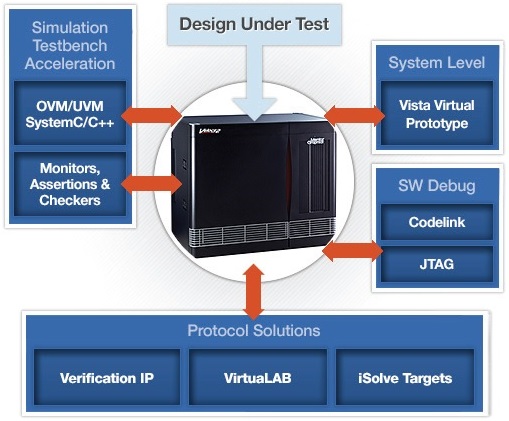
Veloce OS3 emulation system provides a complete verification environment (integrated with Questa simulation environment) for software and hardware engineers through a unique architecture that enables simulation-like interactive debug and fast turnaround for SoC configurations that can scale up to 2 billion gates. It’s standards compliant (SCE-MI 2) providing interoperability with other software-based hardware simulators. Providing visibility of all nodes at all times, it can be used for pre- as well as post- silicon debug.
Through VirtuaLAB environment, multiple users across the globe can simultaneously run verification remotely on the same machine. The Veloce OS3 VirtuaLAB peripherals are reconfigured instantly to support multiple projects and rapidly shifting priorities. This enables global emulation resource management which maximizes engineer productivity and verification ROI. The verification environment is flexible enough to allow hardware stimulus through physical connection, software stimulus through virtual connection, or a combination of the two.
In physical connection, the difference in voltage levels and speeds between actual silicon and Veloce emulation model is solved by Veloce iSolve products (that includes iSolve ARM Cortex JTAG Trace) through a range of solutions including Ethernet, USB, multimedia, and debug.

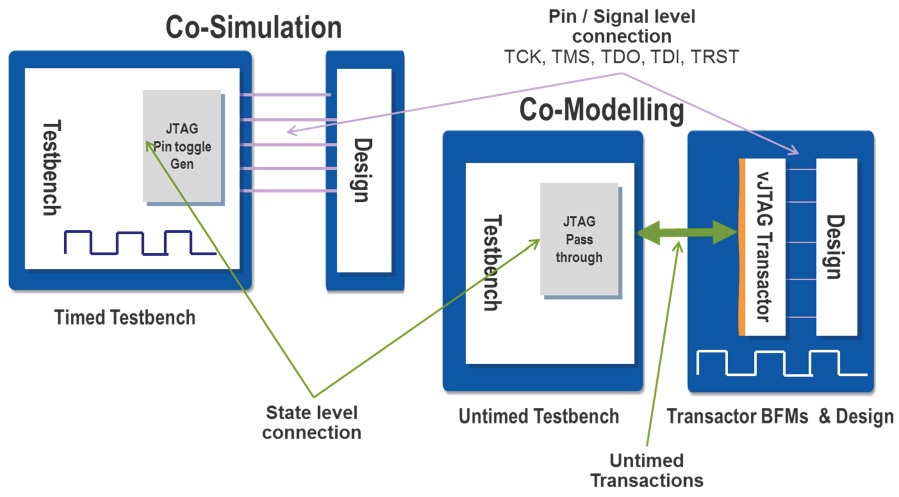
Veloce offers a co-modelling environment where a user can use virtual environments (e.g. C models) in a host computer connected to the actual hardware design (RTL) implemented in Veloce. This approach can be used to replace hardware solutions (e.g. physical debug probe) with a software model, thus enabling concurrent users to access a single build of design. In the above diagram, untimed transactions are being transferred over TBX (Veloce TestBench Xpress) link to Veloce with the vJTAG transactor translating these into a stream of JTAG pin level transitions. This improves performance compared to co-simulation environment which transfers the individual JTAG pin level transitions over the TBX link.
Veloce iSolve allows users to connect the real debug hardware used on a FPGA prototype or silicon platform. Virtual Probe replaces the physical solution, enabling a virtual connection of the JTAG debugger to the design through the TBX co-modelling interface. Both iSolve and Virtual Probe support the same debugger UI environment.

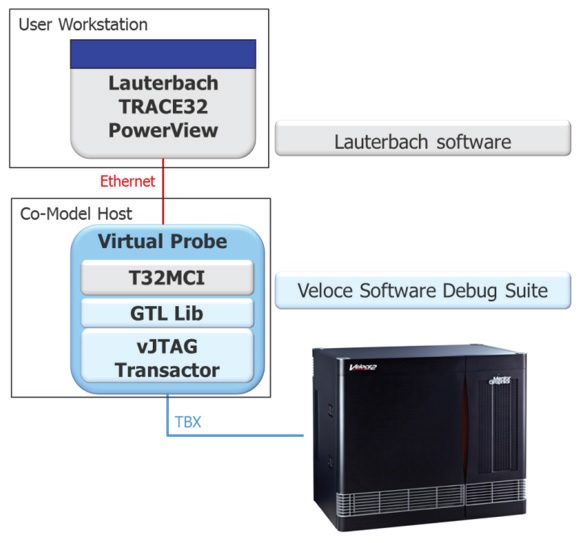
A Virtual Probe is implemented within the co-model host using both Lauterbach and Mentor software. The T32MCIServer replaces the debug hardware; the vJTAG transactor interface takes the JTAG sequence transactions from the T32MCIServer and sends them over TBX to the Veloce which recreates IO pin signals at the SoC boundary.
TRACE32 contains a debug probe, a real-time trace tool, and a logic analyzer which are architecture independent and can be operated either standalone or integrated together through a system controller. It supports all common microprocessor architectures in the embedded world.
A detailed description about connecting TRACE32 and iSolve ARM Cortex JTAG Trace as well as connecting TRACE32 and Virtual Probe along with other details about this methodology is provided in a whitepaperat Mentor website.
Both, the physical and virtual methods have distinct advantages; the physical connection for final testing of a design before tape-out provides a very high level of confidence that the real hardware after manufacturing will work with the real debugger; the virtual connection provides highly flexible enterprise level solution for multiple concurrent remote users to develop software and testbenches that use TBX.
More Articles by PawanFangaria…..
Share this post via:


Comments
0 Replies to “Virtual Emulation Extends Debugging Over Physical”
You must register or log in to view/post comments.