As I write there are multiple displays in front of me that use TFT, LCD or OLED displays:
- ViewSonic Monitors with 24″ display
- MacBook Pro with 15″ display
- iPad Air
- Samsung Galaxy Note 4
- Nexus 7 tablet
- Garmin Edge 820
Our consumer and business lifestyles each have us using multiple displays throughout the business day, evenings and weekends. Being curious about displays and the design of displays I attended a webinar hosted earlier this month by Silvaco that showed how TCAD software tools are being used.
Radiant
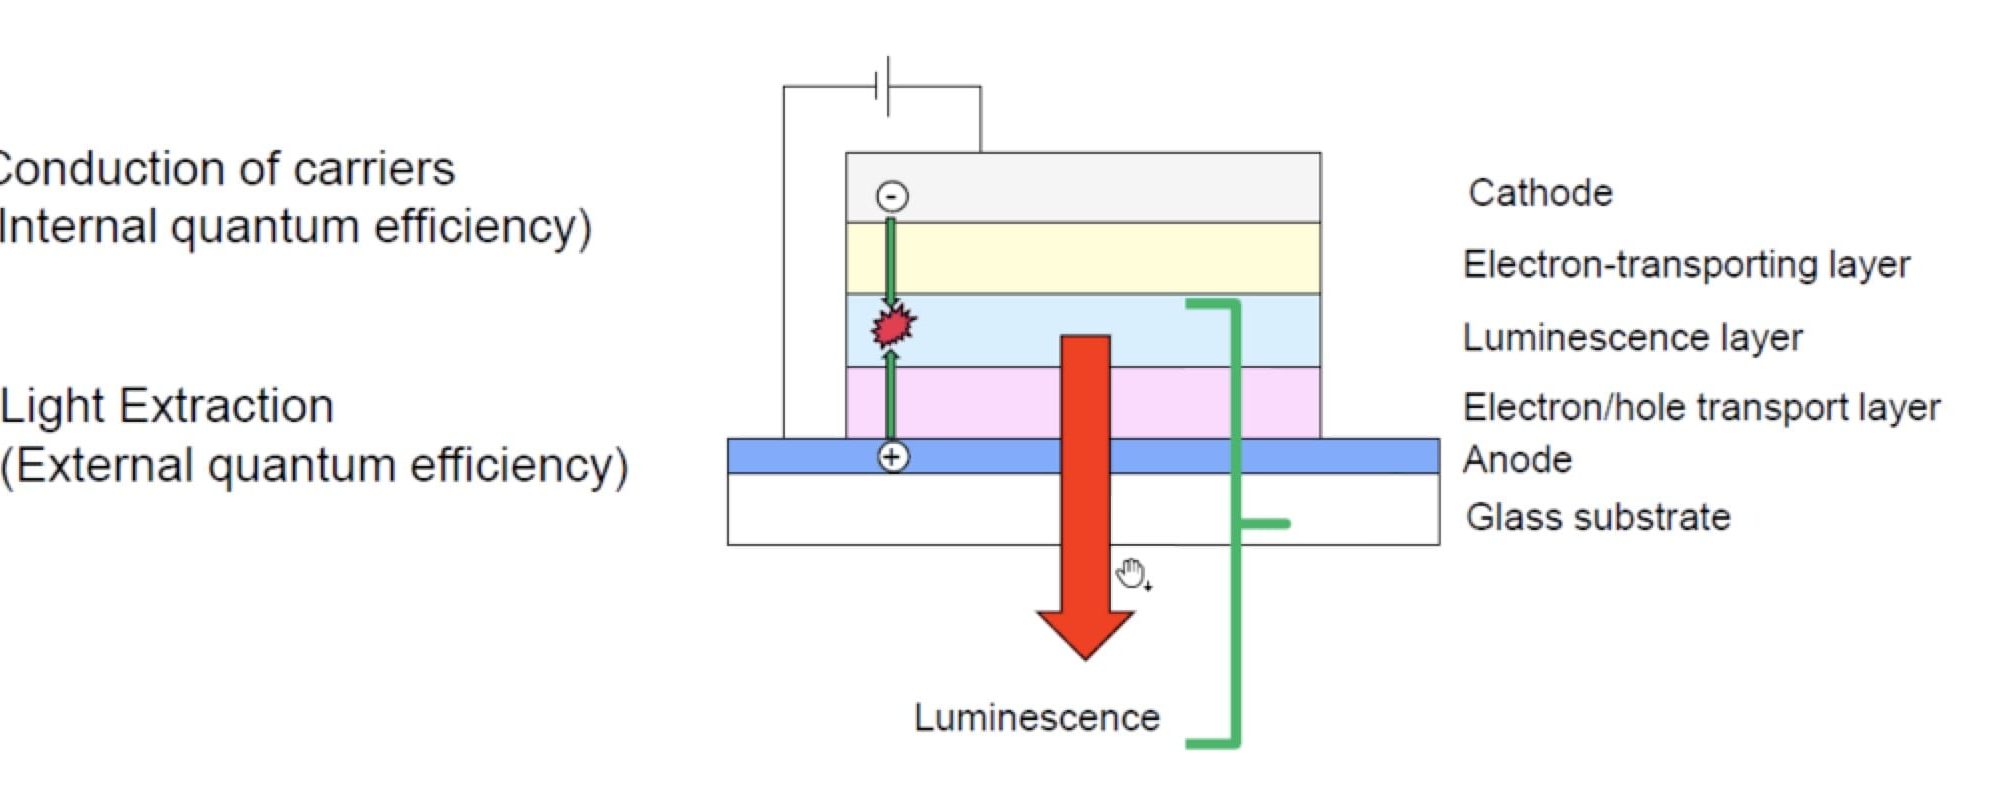
The newest 4K TV sets offered are using OLED (Organic Light Emitting Diode) technology which have thin films where luminescence occurs from an electrical-optical interaction. Here’s a simple cross-section to illustrate the basic concept of an OLED:
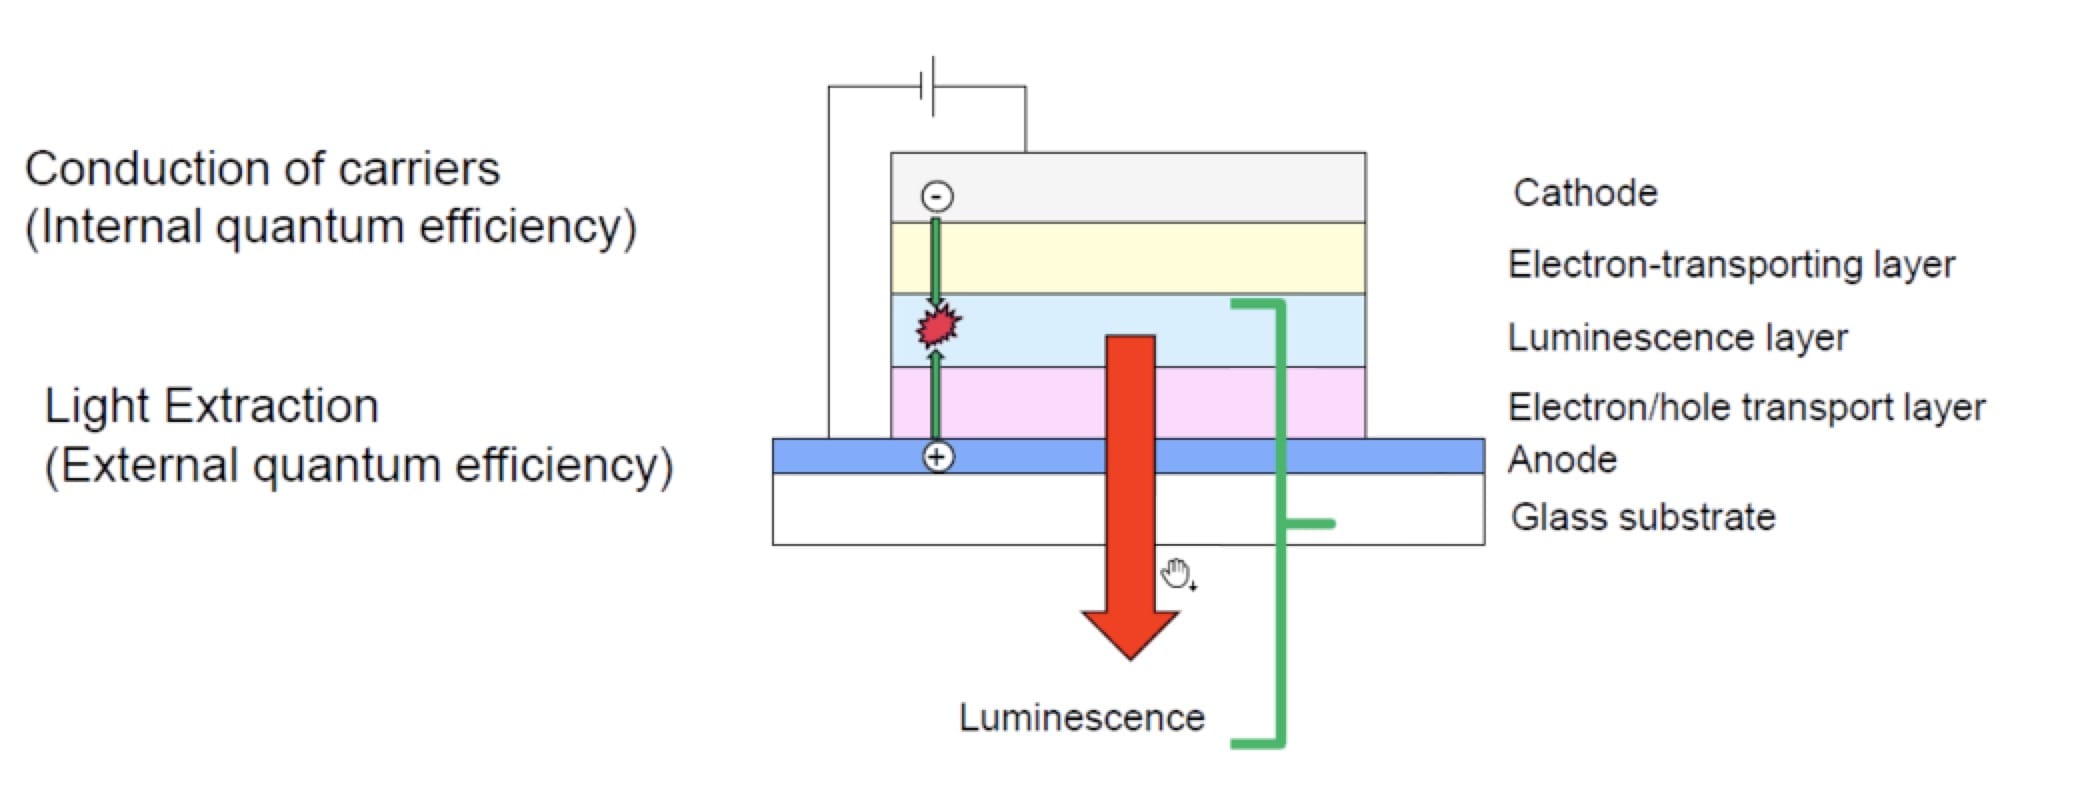
Like all diodes there are two electrical terminals, cathode and anode where a voltage is applied causing a current to flow through the luminescence layer which then emits light. A TCAD tool needs to model and analyze both the electrical and optical properties of an OLED device. On the optical side you need to know several items during the design process:
- Luminescent material properties
- Luminescence system of materials
- Exciton properties
- Exciton singlet and triplet rate equations
- Light propagation and scattering
The software tool from Silvaco that handles the TCAD modeling and simulation is called Radiant, and here’s a quick look at the GUI and technology components:
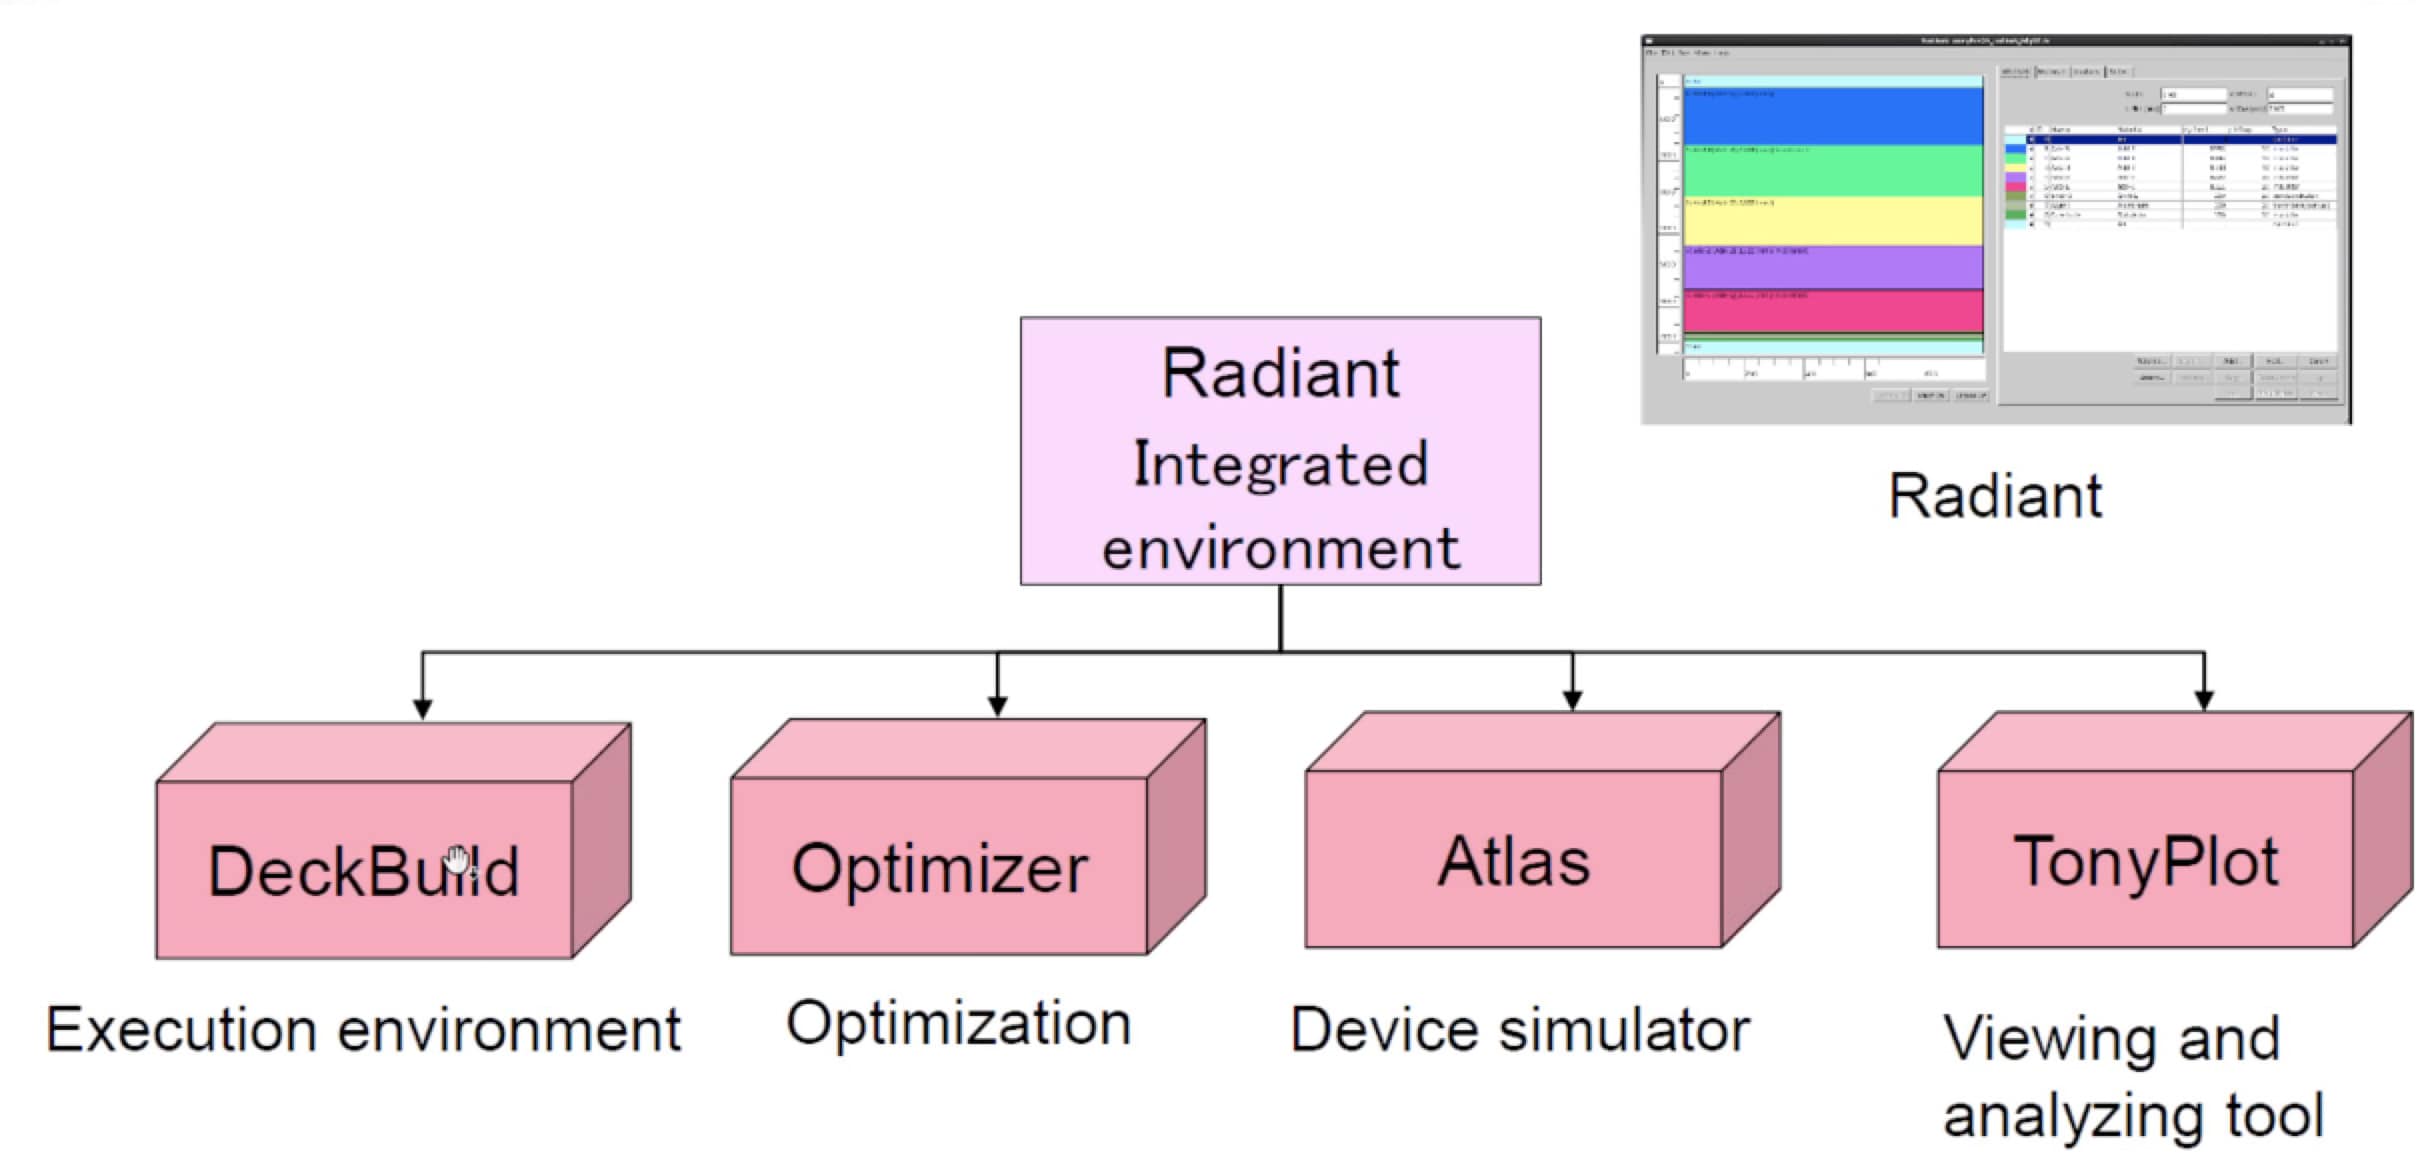
You use Radiant to create the input data for simulations, run the simulations, then view and analyze the results with TonyPlot. For optimizing an OLED display you would use Radiant to sweep parameters as part of a Design Of Experiments (DOE). Analysis types for Radiant are in both electrical and optical domains:
- Electrical
- J-V characteristics
- I-L characteristics
- Electrical charge distribution
- Distribution of excitons
- Impedance analysis
- Analysis for steady state, transient
- Carrier balance
- Optical
- Dipole luminescence
- Chromaticity (CIExy) analysis
- Optical extraction efficiency
- Transmissivity, reflectance and absorptivity
- Analysis for steady state, transient analysis
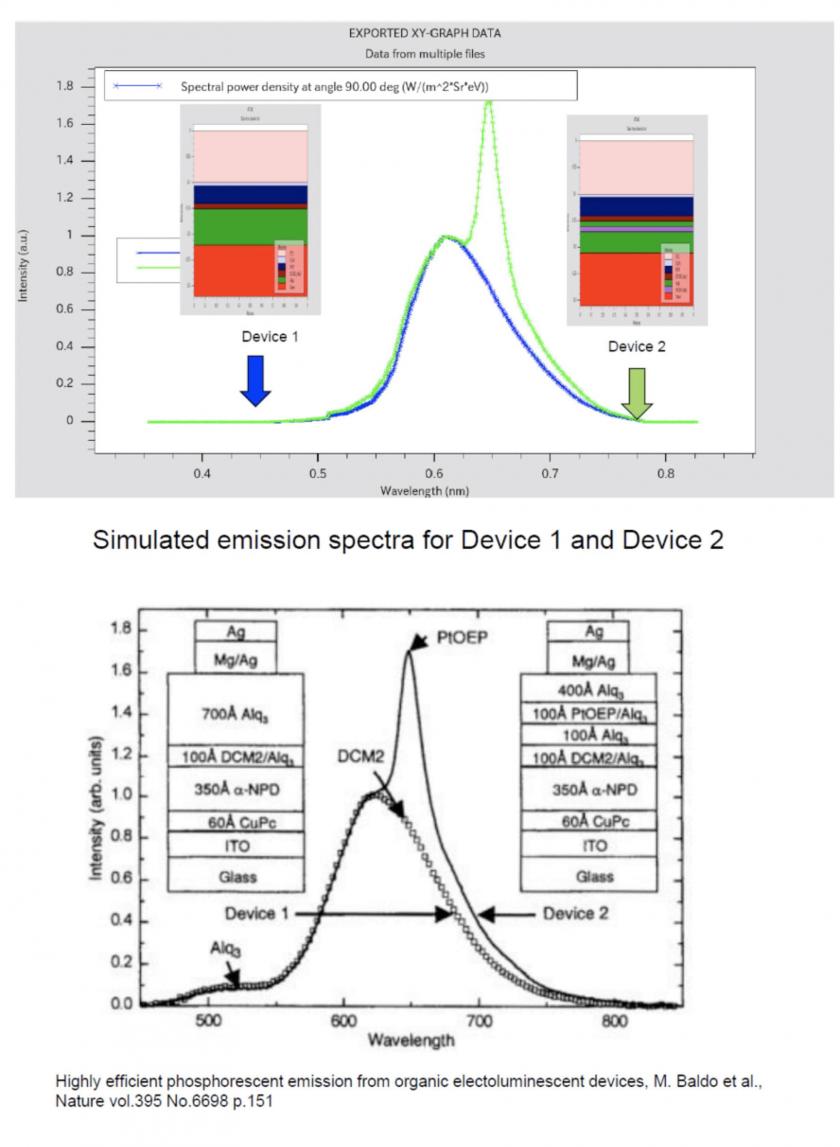
Steve Broadbent went through the typical Radiant simulation flow of: Structure creation, material parameter setup, dipole Setup, analysis setup, analysis execution and display of results. The simulated emission spectra for two devices was shown in TonyPlot and it closely matched published results:
Clever LCD
Next up was Matthias Ruschke to explain why we need to use a 3D finite element field solver for Liquid Crystal (LC) director. The Clever LCD software tools provides three types of analysis:
- Calculates the LC director profile as a function of the voltage bias applied to the pixel
- Extracts the capacitance netlist of the pixel
- Calculates the optical transmittance of the pixel
The tool flow for using Clever LCD is shown below:
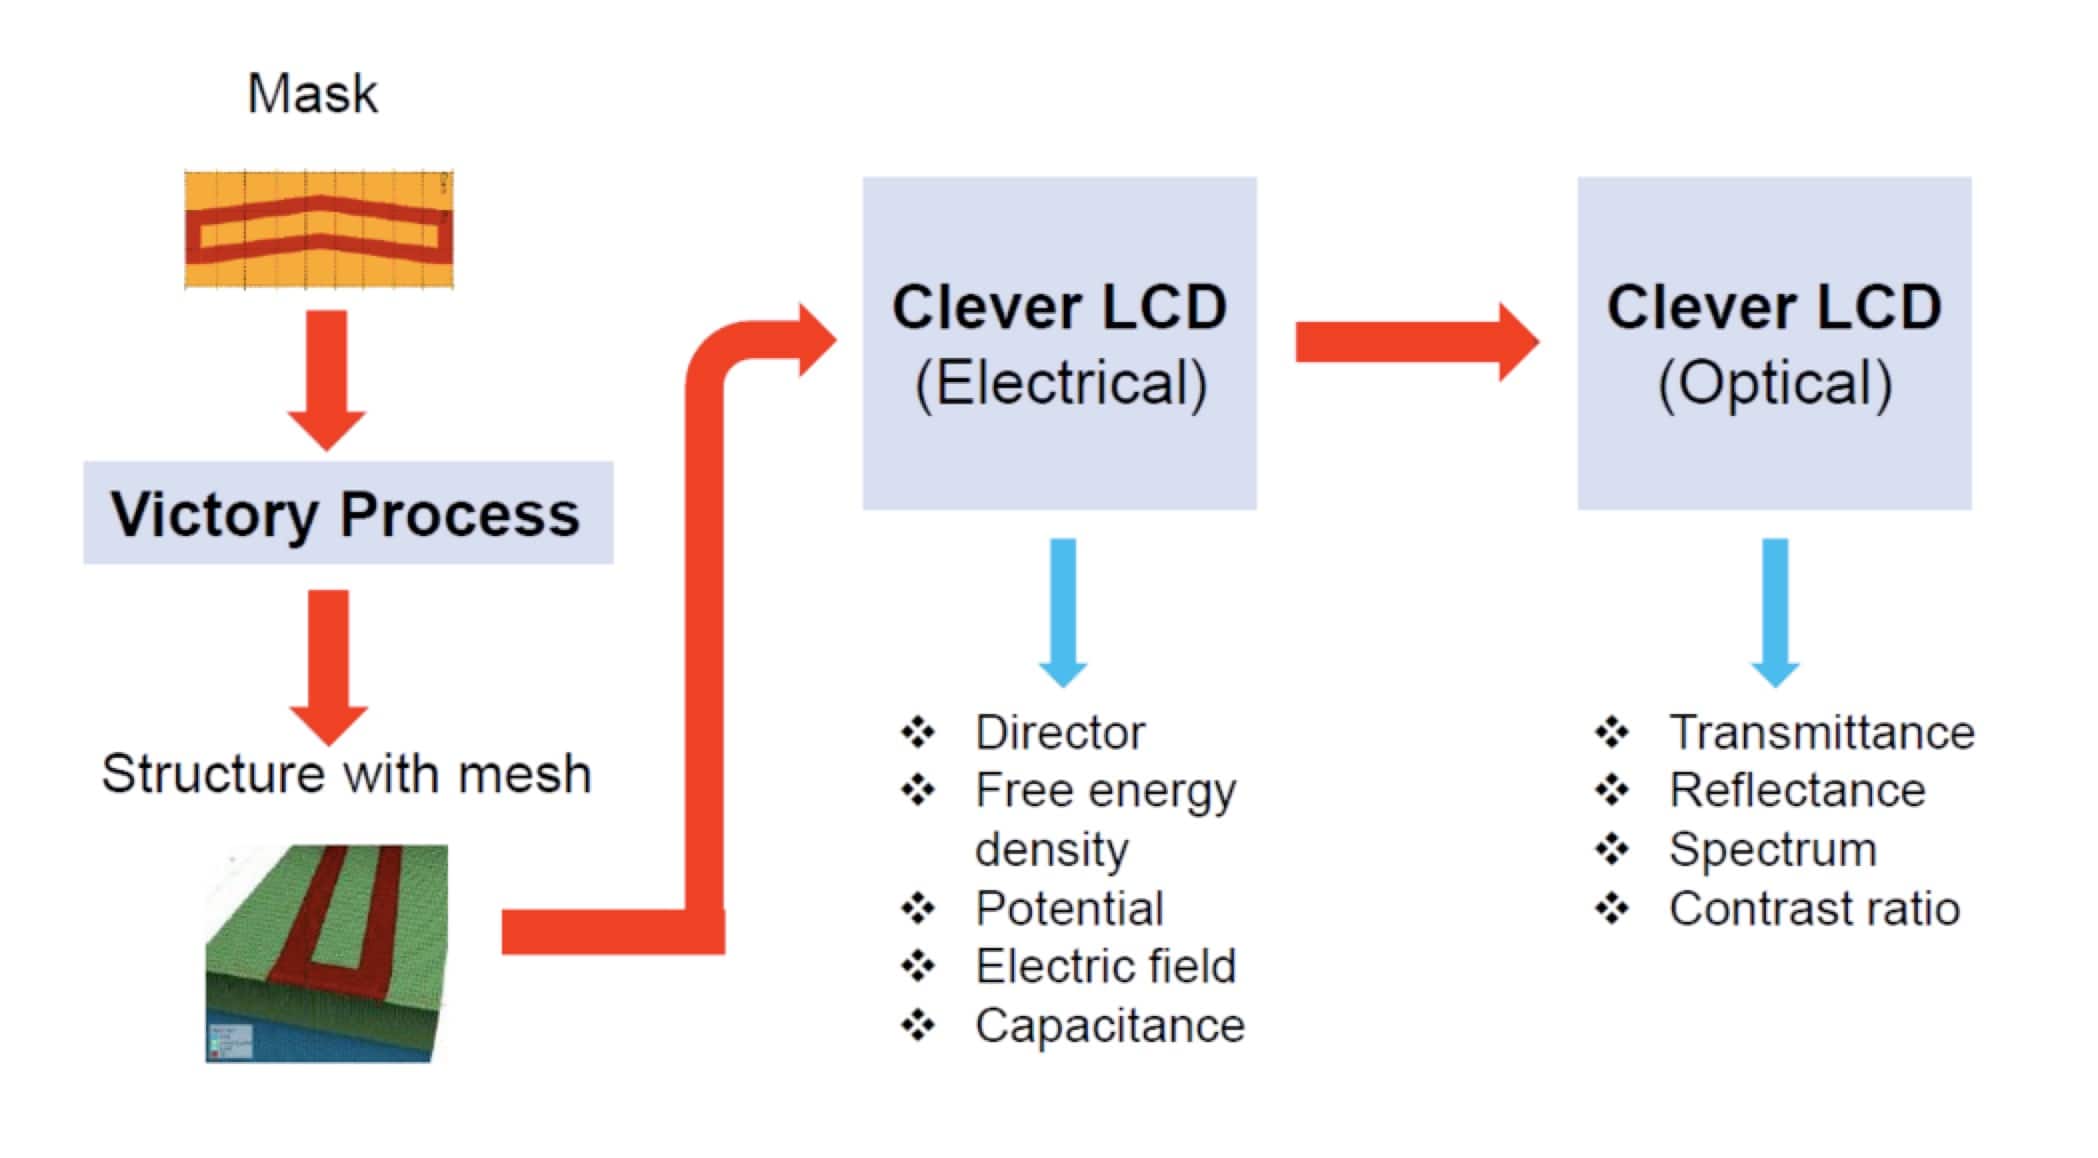
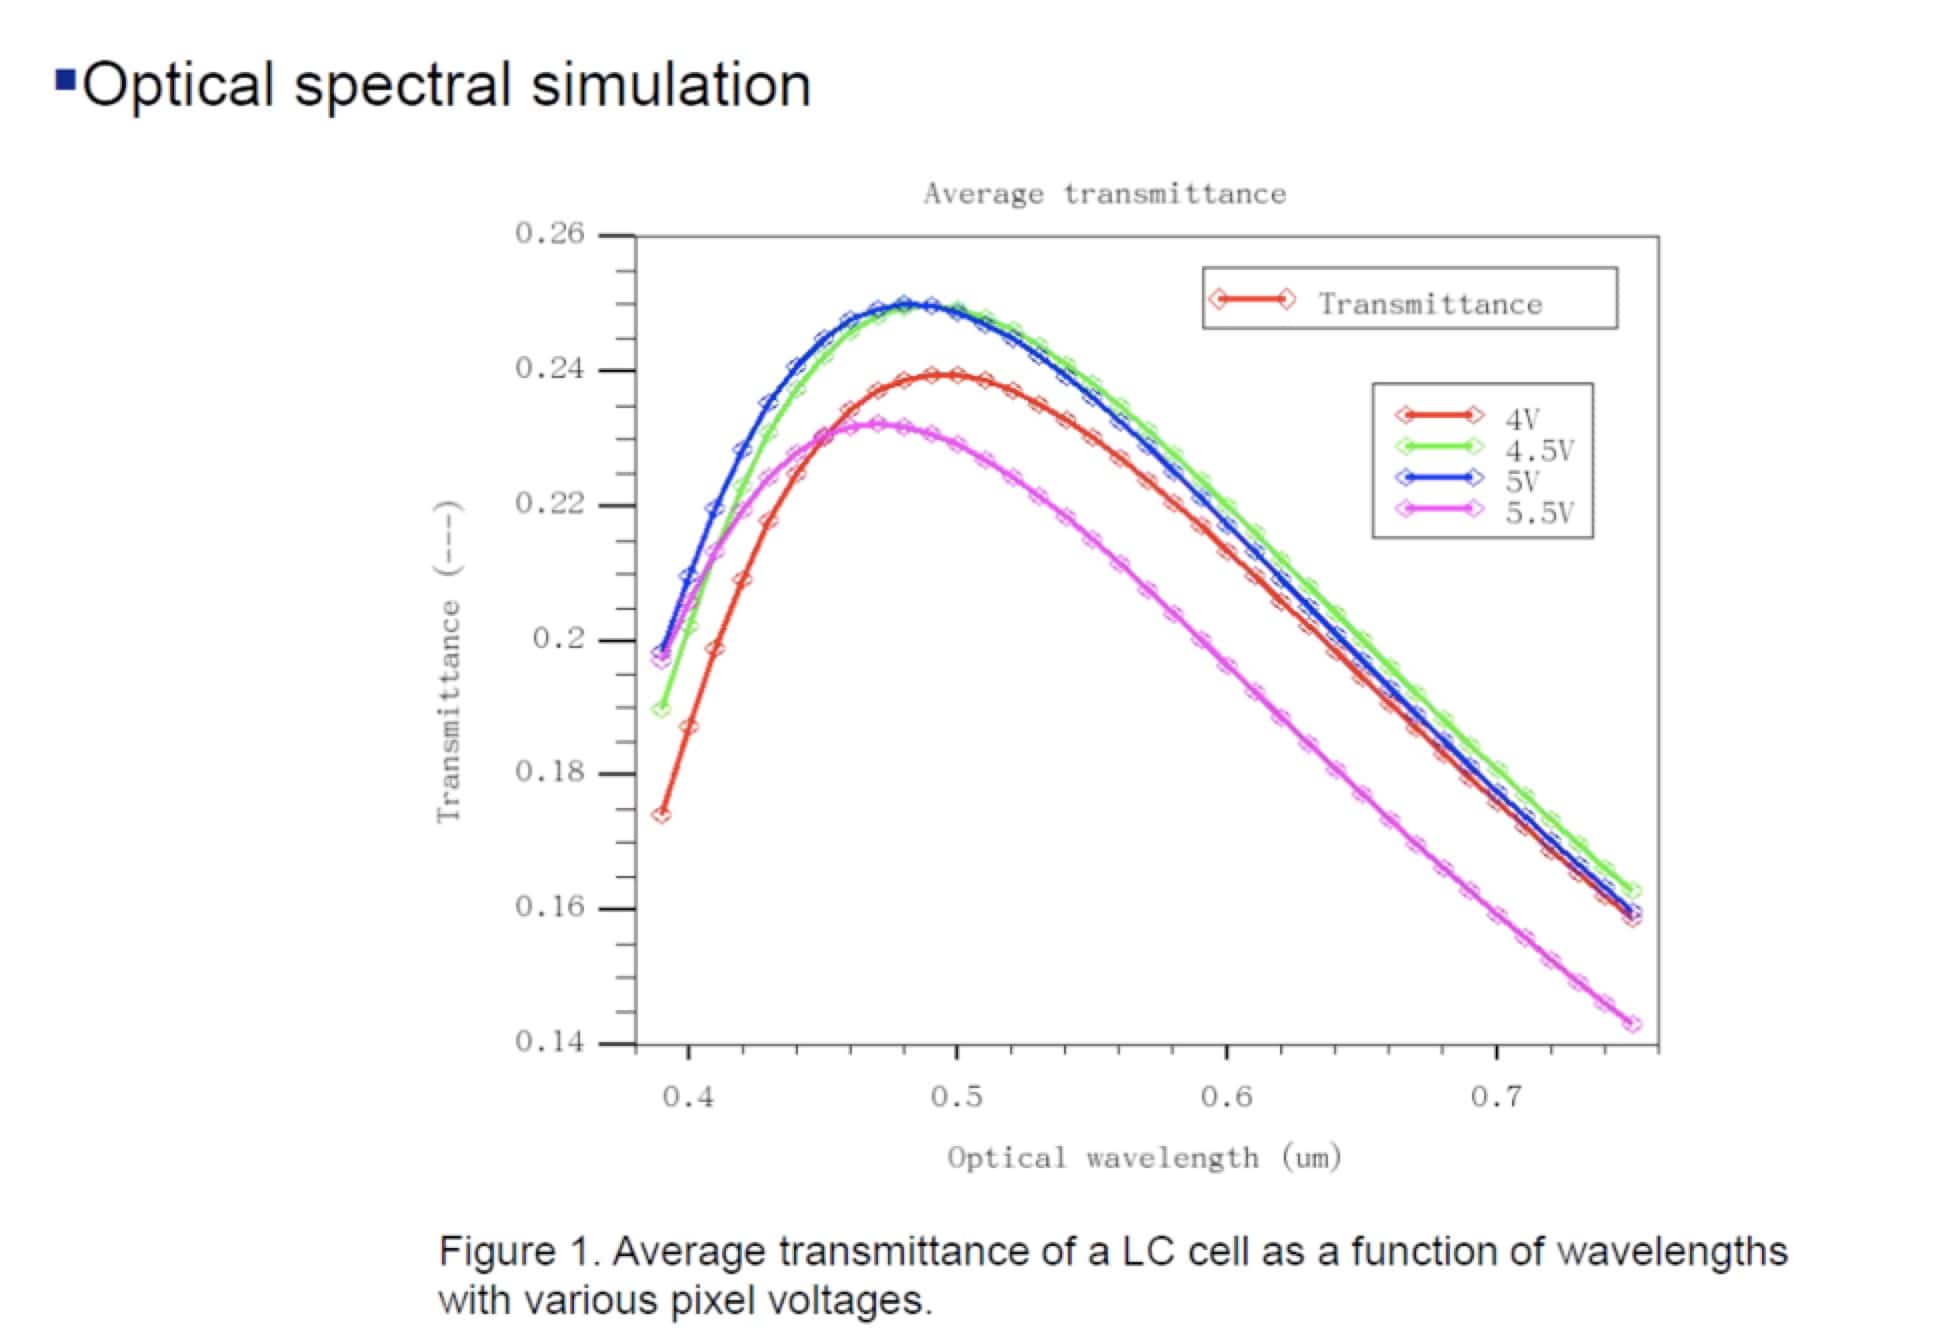
Using this tool flow you can do an optical spectral simulation showing the average transmittance of a LC cell as a function of wavelengths with various pixel voltages:
For angular transmission you can do an incident angle sweep. Clever LCD also has a GUI, like Radiant, so learning and using the tools looked pretty easy.
Victory
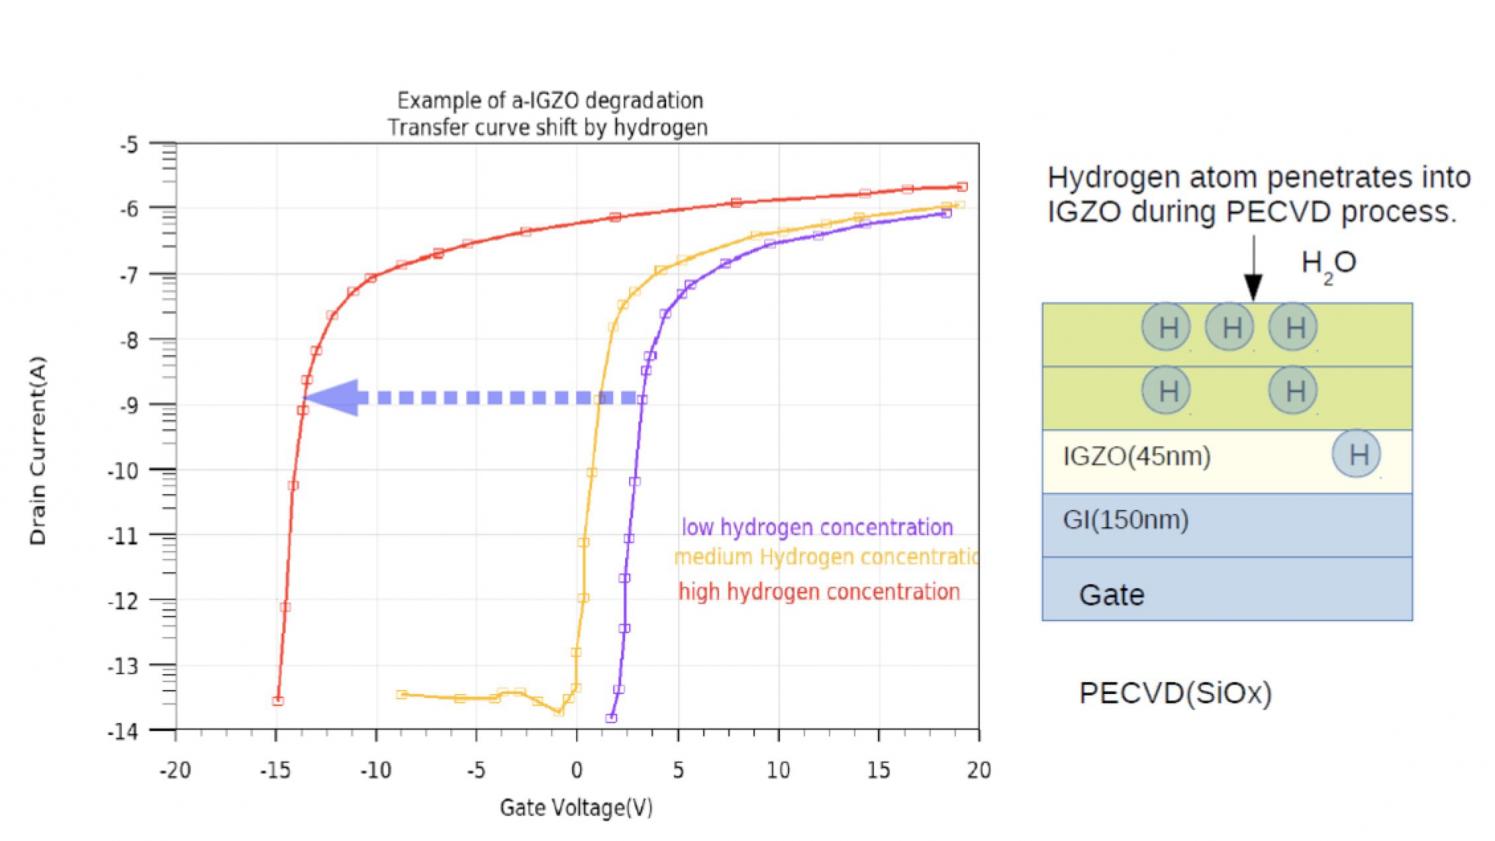
The final presenter was Sungwon Kong and he talked about process and device simulation with a software tool called Victory Process. I briefly mentioned Victory Process as a tool that is used prior to Clever LCD. One important type of analysis that Sungwon explained was Vth shift, an effect where a TFT (Thin Film Transistor) degrades over time. The following chart shows what happens as Hydrogen atoms penetrate into IGZO during a PECVD process, causing the Vth to shift:
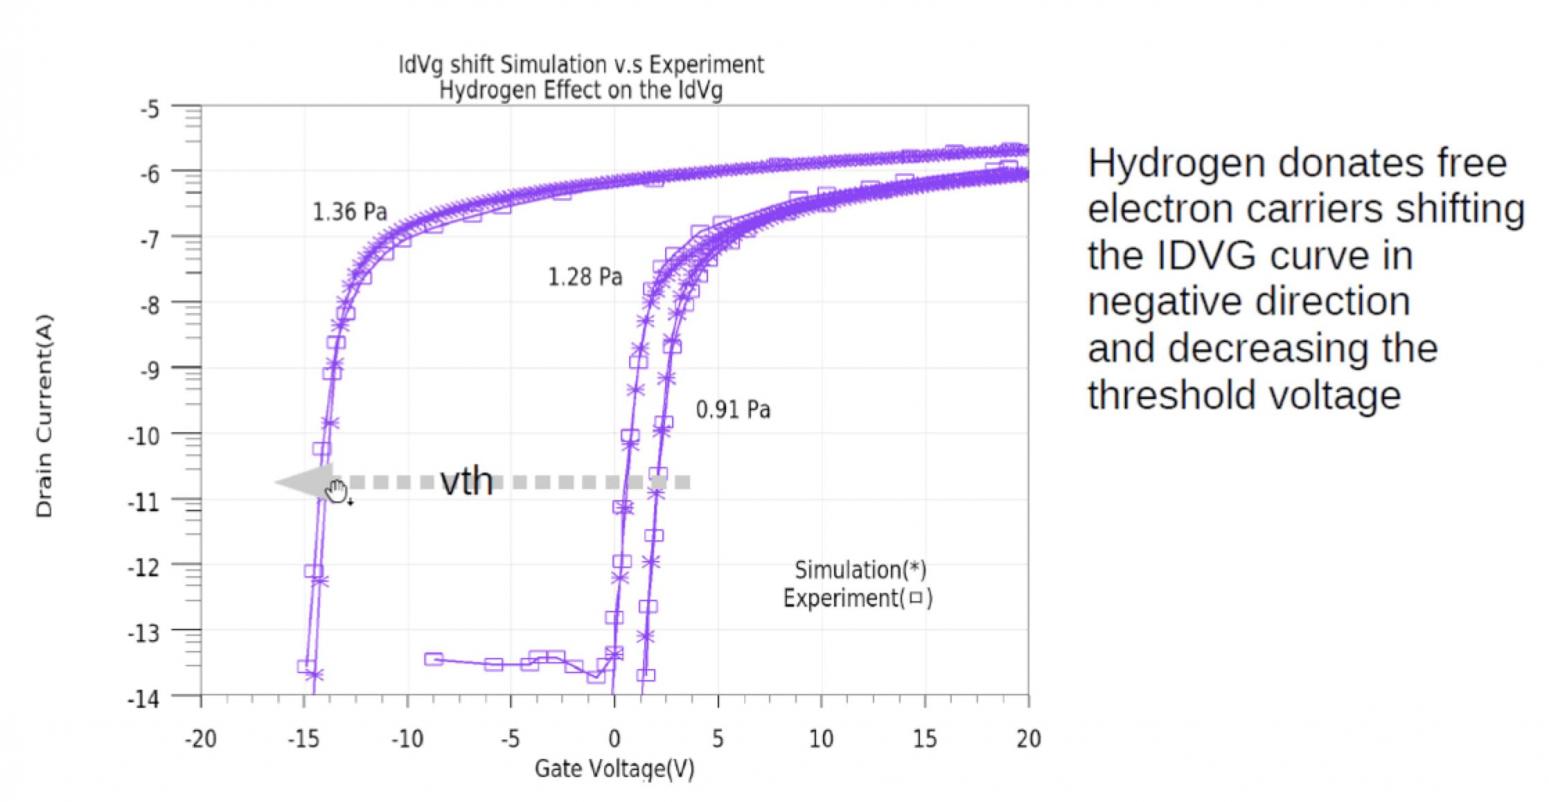
With Victory Process they were able to model and simulate the hydrogen diffusion case, then plot out the expected Vth shift using the VictoryDevice simulator:
With the Victory Process simulator you can model both Hydrogen and Oxygen diffusion, predict bias temperature illumination effect, and validate the Positive Bias Temperature Instability (PBTI).
Summary
I’m constantly amazed at the amount of automation that our modern TCAD software tools have to offer engineers. In the old days the engineers would propose a new TFT, LCD or OLED device, fabricate it, test it, then iterate until the specs were met. In 2017 you can now use sophisticated TCAD tools to actually model and simulate the behavior of your TFT, LCD or OLED devices before fabrication, thus reducing the number of fabrication cycles and shortening your time to market. I’ll take all of the automation offered to me.
View the archived webinar online.
Share this post via:
![SILVACO 051525 Webinar 400x400 v2[62]](https://semiwiki.com/wp-content/uploads/2025/04/SILVACO_051525_Webinar_400x400_v262.jpg)


Comments
There are no comments yet.
You must register or log in to view/post comments.