You are currently viewing SemiWiki as a guest which gives you limited access to the site. To view blog comments and experience other SemiWiki features you must be a registered member. Registration is fast, simple, and absolutely free so please,
join our community today!
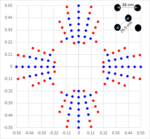
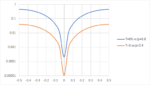
Peak probability at zero distance actually makes no sense
In lithography, it is often stated that the best resolution that can be achieved depends on wavelength and numerical aperture (NA), but this actually only applies to the so-called “aerial” image. When the image is actually formed in the resist layer, it also depends on an… Read More
In the assessment of wafer lithography processes, normalized image log-slope (NILS) gives the % change in width for a given % change in dose [1,2]. A nominal NILS value of 2 indicates 10% change in linewidth for 10% change in dose; the % change in linewidth is inversely proportional to the NILS. In a previous article [2], it was shown… Read More
The “1.xnm” node on most roadmaps to indicate a 16-18 nm metal line pitch [1]. The center-to-center spacing may be expected to be as low as 22-26 nm (sqrt(2) times line pitch). The EXE series of EUV (13.5 nm wavelength) lithography systems from ASML feature a 0.55 “High” NA (numerical aperture), targeted… Read More
Normalized image log-slope (NILS) is probably the single most essential metric for describing lithographic image quality. It is defined as the slope of the log of intensity, multiplied by the linewidth [1], NILS = d(log I)/dx * w = w/I dI/dx. Essentially, it gives the % change in width for a given % change in dose. This is particularly… Read More