Key Takeaways
- AMD transitioned from an Integrated Device Manufacturer (IDM) to a fabless model by spinning off its manufacturing facilities, marking a significant industry transformation.
- The rise of TSMC enabled semiconductor companies to outsource front-end manufacturing, allowing fabless companies to focus on design and innovation.
- The semiconductor industry's complexity has increased, with a shift from economic drivers to national security concerns, complicating the understanding of market dynamics.
“Real men have fabs” was an insult AMD founder Jerry Sanders hurled at his poor competitors who could not afford to build fabs. A few years later, AMD would be fabless, spinning off its manufacturing facilities as GlobalFoundries. This was the beginning of a transformative period for the industry.
Lisa Su could rightfully retort: “Real women don’t need fabs!”
Before the transformative era, all semiconductor companies were Integrated Device Manufacturers (IDM) that held the reins of designing, manufacturing, packaging, testing, and selling all their semiconductors.
Being a leader in all aspects of Semiconductor Manufacturing was becoming increasingly complex and expensive. Only a few companies had the market position and the financial strength to continue as IDMs.
The first elements to be outsourced were the backend manufacturing, the packaging and testing. It was labour-intensive and not a part of the manufacturing process that added significant economic value. First, operations were moved to Asia, and later, they were outsourced entirely as specialised companies started to appear. The Outsourced Assembly and Test (OSAT) market was born.
The IDM age was a boring time for market analysts.
The individual companies still did the front end (Wafer processing) of the Manufacturing.
In the late 1980s, the Taiwanese government offered Morris Chang, the founder of TSMC, a blank check to establish a local semiconductor industry. He had been working for Texas Instruments and observed that Japanese semiconductor factories outperformed US fabs significantly. The Japanese successfully transformed their society into a technology-based economy that would outcompete the US for over a decade.
Morris offered Intel and Texas Instruments to invest in the company, but they declined. Philips decided to trade their manufacturing technology and IP for a quarter stake in the new company, and the first foundry was born.
The increasing cost of building fabs and developing new technologies limited the number of new startups in the industry. However, new companies could enter the market with TSMC carrying the Capex cost of developing technologies and building factories. The fabless companies created a new market segment competing in design and let TSMC handle the manufacturing. In 2008, AMD gave up and became fabless themselves.
The current market structure
Since then, the Semiconductor market has become an even more complex web of submarkets and categories. This is happening as the industry has risen from an economic engine to become a matter of national security.
Understanding what happens in the semiconductor industry has never been more critical or challenging.
We continuously develop our industry model to analyse the industry and provide data and insights to our customers. This allows us to study the interfaces between the different submarkets of the value chain and detect market ripples early.
In a value chain, somebody’s future might be somebody else past.
We are not arguing that our model is correct or cannot be improved; we only know that it works for us now and that we must continue improving it.
A graphical representation of our industry model can be seen below:
![]()
The model has zones representing the different stages of the Semiconductor business. The design zone in the middle is where the design authority and absolute product ownership reside.
The manufacturing zone on the left represents front-end wafer manufacturing, and to the right is an assembly of systems by EMS or OEMs and the distribution channel, if applicable.
The brand zone is introduced as some semiconductor design owners also have a visible brand towards the end users of their products.
At the right are the end users of the Semiconductor products. We work with four different categories. The latest are large capital projects representing the large cloud and AI projects that have changed the dynamics of the industry lately.
The investment zone at the top represents what is needed to enable design and manufacturing. At the bottom, the supply zone represents the supply channels for front-end and back-end manufacturing.
We monitor the boundaries between these zones for insights that can enlighten us on what happens in the semiconductor market.
The major semiconductor business models
The industry’s most traditional business model is the integrated device manufacturer (IDM), responsible for both the design and manufacturing of the value chain.
Only the largest and most profitable companies have been able to maintain this business model due to the increasing costs of building wafer fabs. Memory companies also follow this model, as being competitive in memory is linked very closely to being competitive in manufacturing.
The rise of TSMC allowed semiconductor companies to go Fabless and outsource front-end manufacturing to foundries, concentrating on the design, sales, and marketing of semiconductor products.
A handful of companies use a mixed model, where they own their fabs and also use foundry. This Fab/Foundry model is popular amongst analogue and power companies that can operate analogue and power fabs, even though the leading edge digital manufacturing is outside their reach.
Some semiconductor customers with specialised demand are now so large that they design silicon for internal use. The Chip Designing Customers are mainly the large cloud and AI data centre-owning tech companies.
The last category is the Brand Customers. In this category, the semiconductor cannot be directly bought but is part of a system. The semiconductor inside is “branded” to the market as part of the system. Apple started this category, and the company promotes the semiconductor content of its products in its marketing. Recently, Nvidia also entered this category with its GPU-based AI systems.
There will be future categories as a result of two intertwined trends. The move from CPU to GPU requires a move from components to systems to work.
The owners of bricks
As the semiconductor sector has changed from an economically driven global industry to a politically influenced area of national security, the level of education on the market composition has deteriorated.
Because of the complexity of the industry, no good information is available about where the chips are physically made. Each chip has several countries of origin as it moves through the value chain.
Most chips are not made in Taiwan or by TSMC.
We base our research on the country of incorporation, where the political influence is most substantial and on financial Property, Plant and Equipment (PPE). Manufacturing capacity is not the same as that of PPE, but in the semiconductor industry, the most significant part of PPE is manufacturing.
Using this with our industry model, we get the following view of the distribution of PPE:
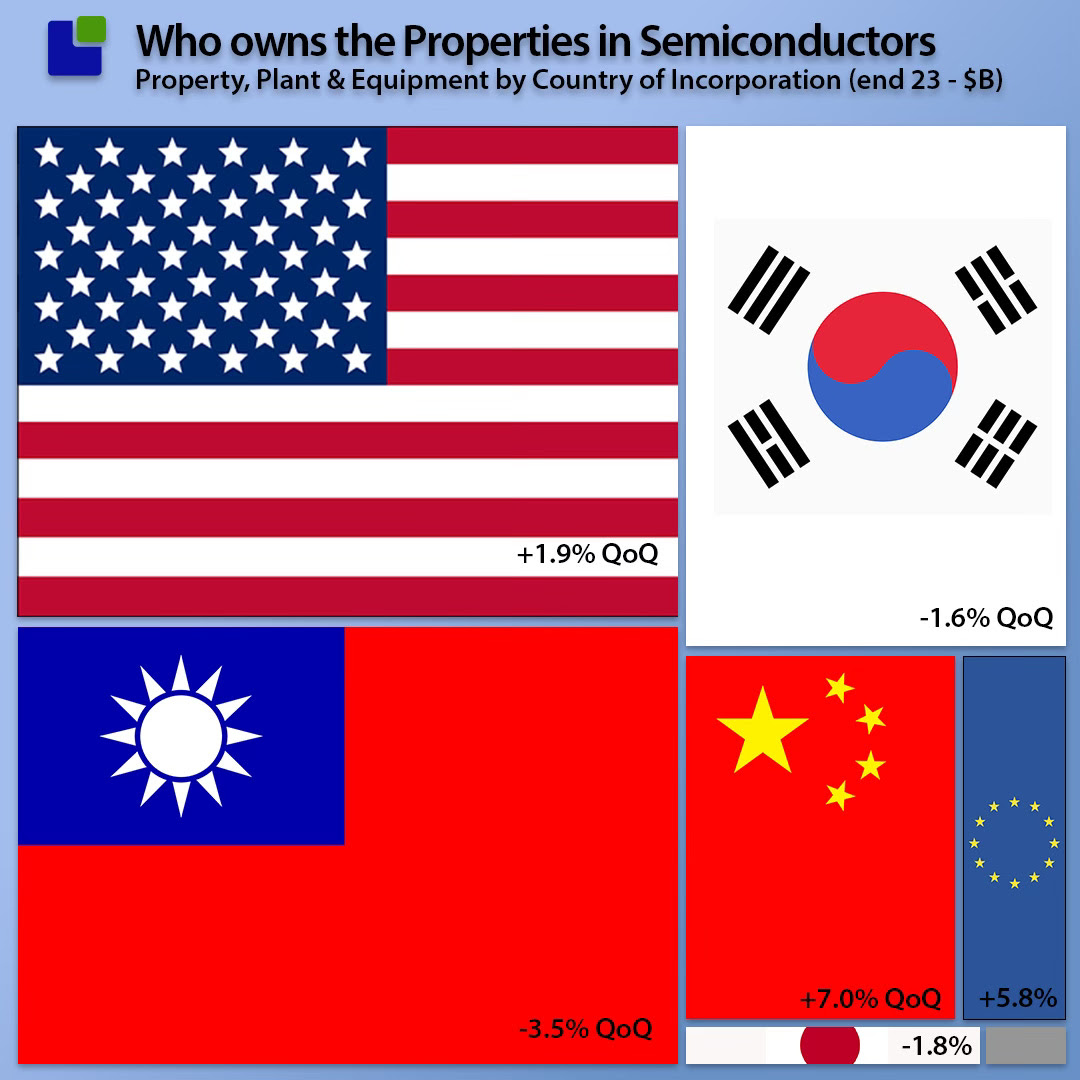
This gives a more nuanced image of what authority the properties are under rather than where they are located. This is increasingly important as governments are starting to lean on their local Semiconductor companies for patriotic investments.
In Q4-24, the most significant growth of PPE was in China, while Taiwan was declining. Europe also showed strong growth, which needs to be added to the political dialogue.
Applying our industry model gives the following output:
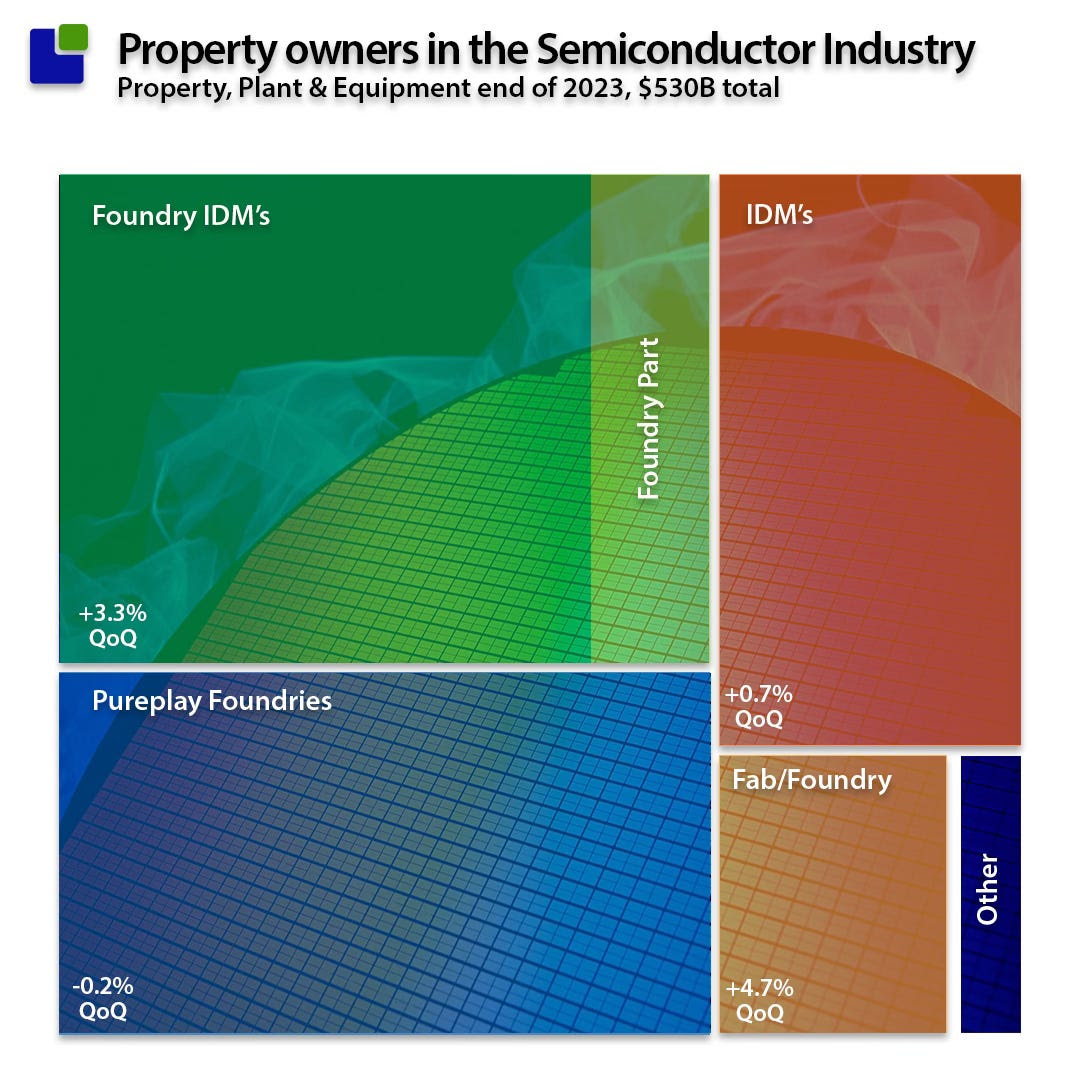
This is a different image than the broader press paints. From a PPE perspective, the two large IDMs with a foundry model (Intel and Samsung) dominate. The Foundry PPE is actually in decline while all other areas are growing.
The growth of the companies with mixed Fab/Foundry models is fascinating. This shows that the smaller mixed Fab/Foundry companies are adding PPE faster than the other models, a sign of them becoming more of a manufacturing company than a fabless company.
Traditionally, they have been unable to participate in the crazy manufacturing race of processing semiconductors, which they have outsourced. At the same time, these companies have manufactured analogue and power products on their fabs. While still expensive, these fabs don’t need the same insane technology as the processing parts.
The investment situation
As PPE depreciates quite fast in the Semiconductor industry, representing the rapid technological developments, the manufacturing part of the Semiconductor industry is dependent on high-octane Capital injections revealed in the cash flow statements under Capital Expenditure or Additions to PPE.
While fabless semiconductor companies can get away with a CapEx-to-revenue ratio (how much of revenue is spent on CapEx) of 3-4%, the IDMs need to shovel 28% of their income back into CapEx, as seen below.
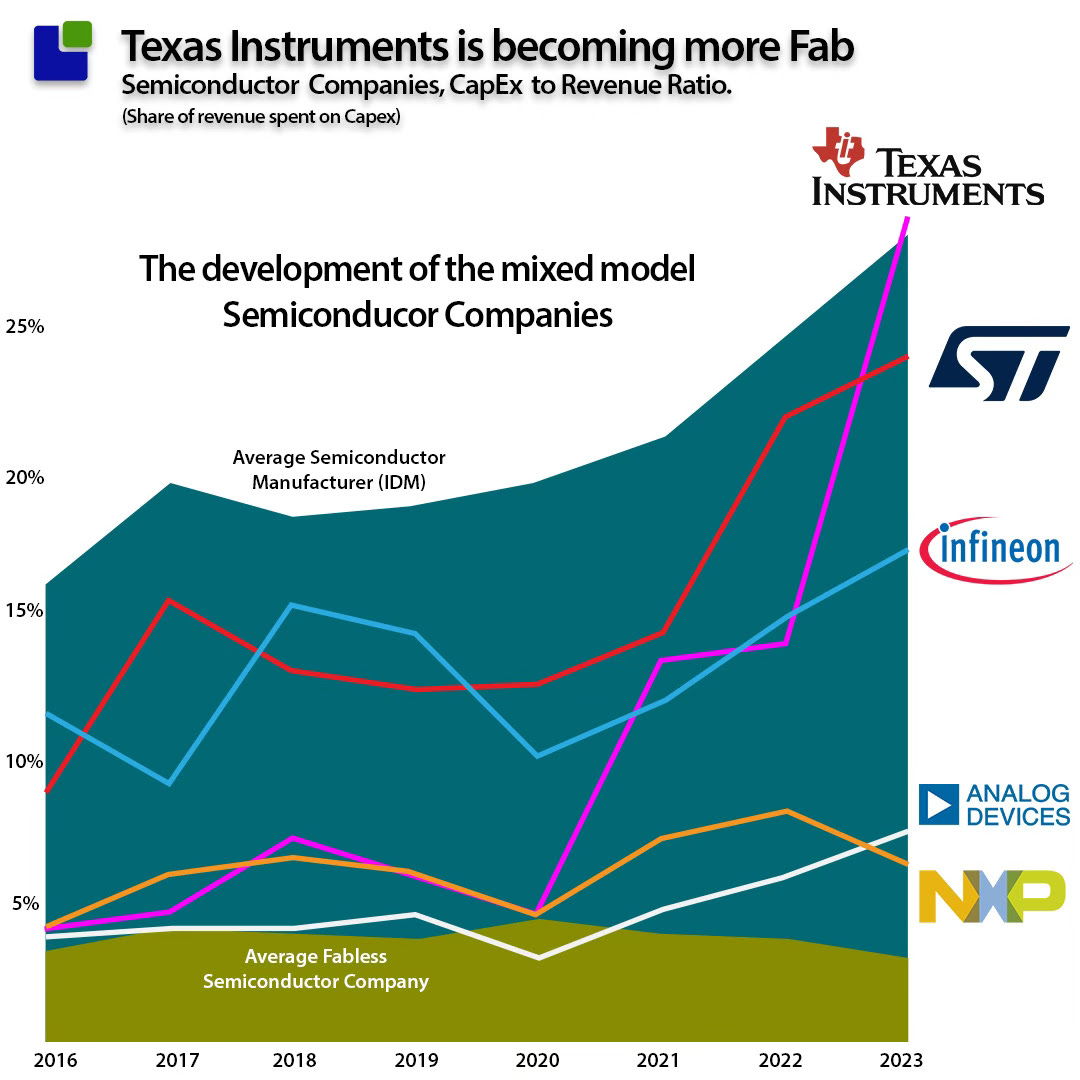
This chart also reveals the manufacturing appetite of the mixed Fab/Foundry model companies. While Analog Devices and NXP are closer aligned with the Fabless model, Infineon and ST of Europe are pursuing more manufacturing. At the top is Texas Instruments, with a 29% Revenue to Capex Ratio in Q4-23.
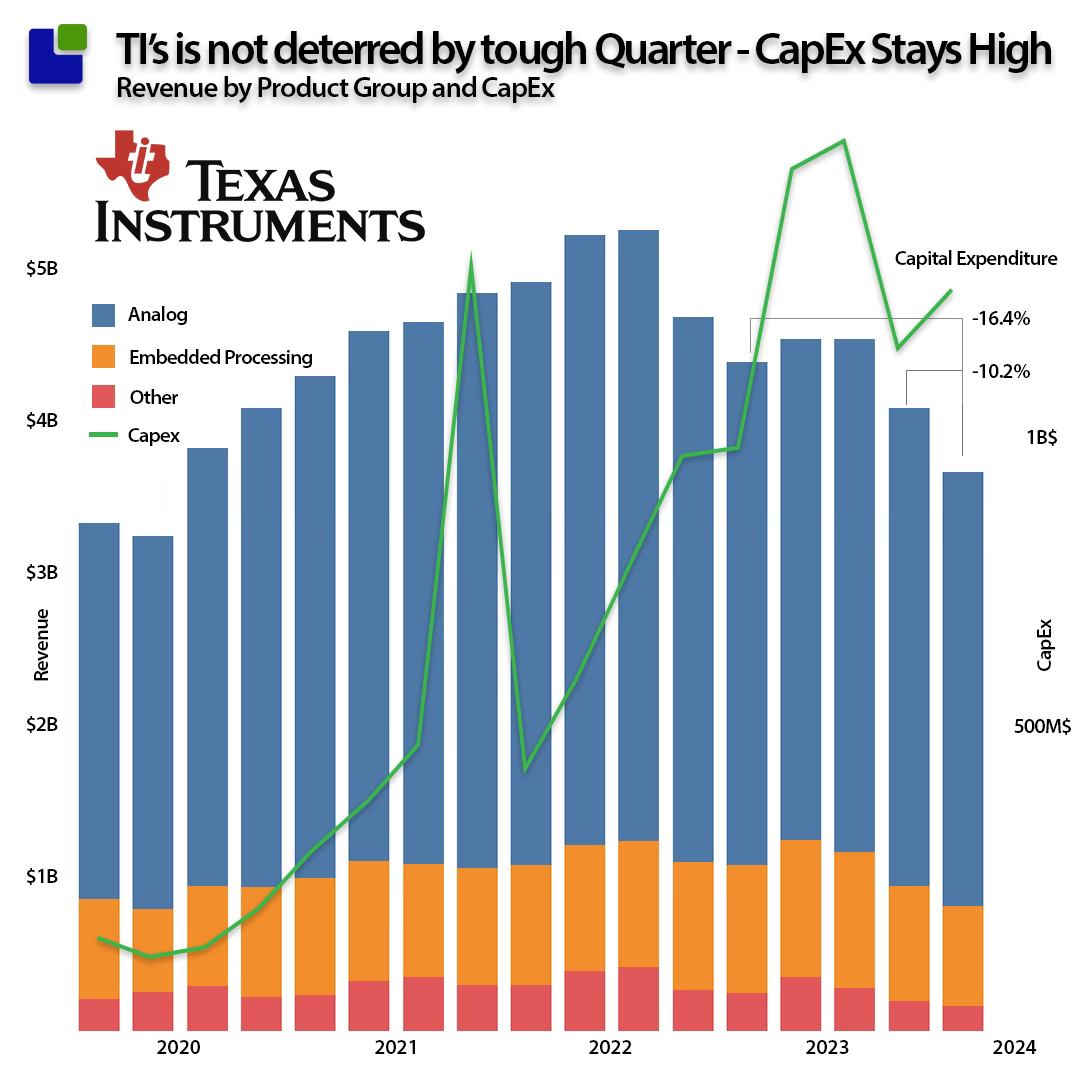
TI’s recent Q1-24 result revealed that the company now has a ratio of 34%, showing a steadfast commitment to more manufacturing. The company also expect to be able to capture a $1B grant from the US Chips Act.
The Foundry investment situation
The “Most chips are made in Taiwan” story should be “Most Foundry manufacturing is in Taiwan” instead. In Q4-23, TSMC represented 62% of the revenue and 87% of the operating profits in the Foundry market, so it is undoubtedly the gold standard. (A deeper dive into the Foundry market is here.)
The CapEx to revenue ratio for the foundries can be seen below:
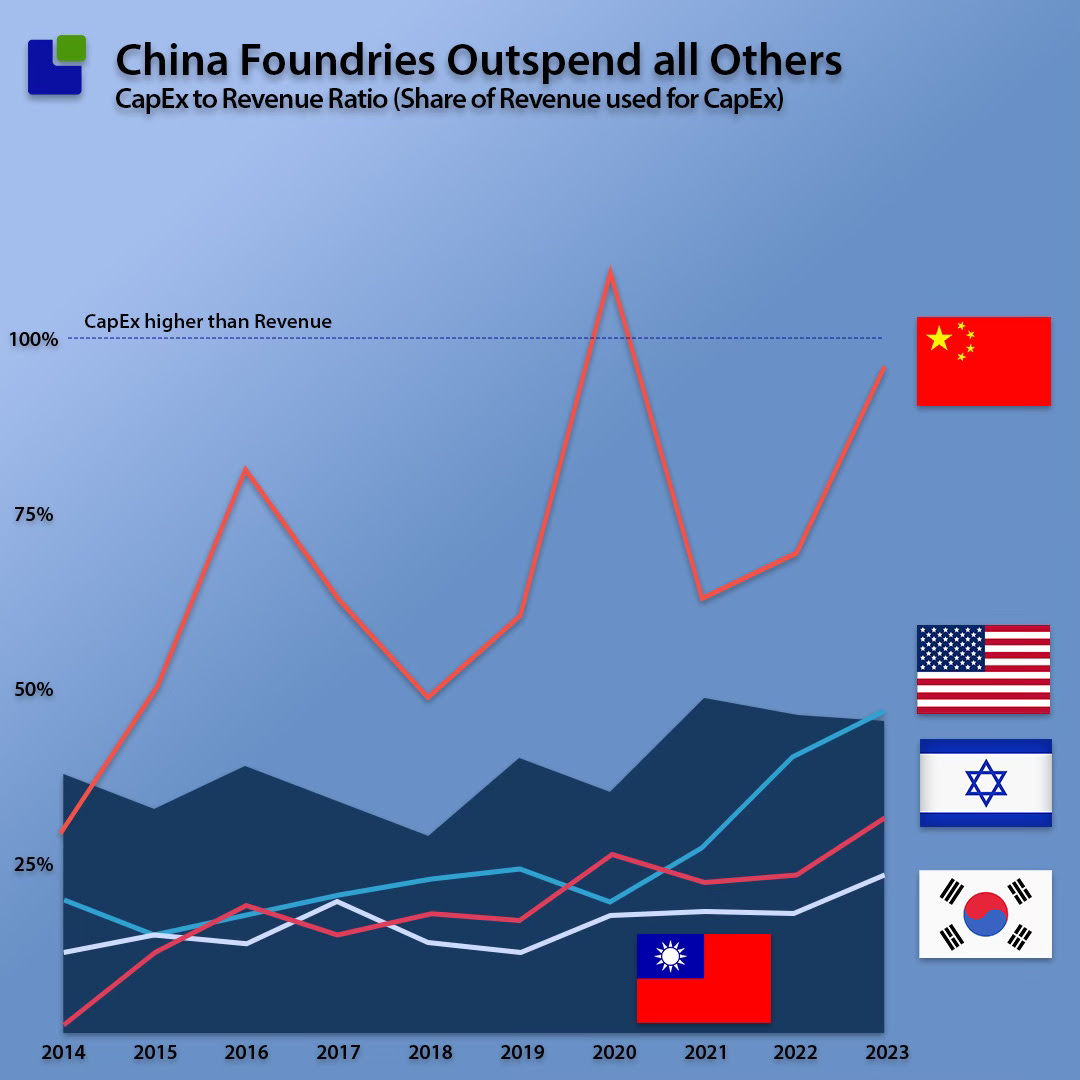
China foundries outspend all Others.
While the investments from the Taiwanese foundries have been high, they have been significantly outspent by the Chinese foundries. At times with CapEx that a higher than revenue, revealing the foundries operate in a different economical system than the reset. Recently also the American foundries have climbed higher and now has a CapEx to Revenue ratio slightly higher than Taiwan.
We keep monitoring the dynamics in the Semiconductor Industry using our proprietary models based on facts. If you want access to our data or neutral input to your strategy process, please contact us at: claus.aasholm@SemiBizIntel.com
Also Read:
Soitec Delivers the Foundation for Next-Generation Interconnects
Intel is Bringing AI Everywhere
No! TSMC does not Make 90% of Advanced Silicon
Share this post via:


TSMC N3 Process Technology Wiki